Category Archives: Dow Theory

Is a Recession Coming?

Review

On August 23, 2009, using Dow Theory and the Industrial Production Index [IPI], we predicted that the National Bureau of Economic Research (NBER) was going to say that the recession ended in June 2009 (article here).  We specifically said the following:

“Implicit in my discussion of the IPI [Industrial Production Index] is that we are at a turning point for the economy. Based on the combination of the Dow Theory confirmation of July 23, 2009 and the IPI turning up from the June low, I will have to guess that the National Bureau of Economic Research (NBER) is going to proclaim June 2009 as the official end to the recession. The end to this recession will be lackluster and questioned from all corners.”

As has been the case historically, the announcement that the recession had ended came 1-year and 3 months after the fact (NBER announcement found here.)  Additionally, few have been satisfied with the definition of a recovery especially if it means that job growth and income increases have not been exceptional.

Now we are faced with what we believe could be the defining moment for a sustained stock market and economic decline worthy of being deemed (by NBER) a recession.  The factors that go into this assessment are based on our interpretation of Dow Theory and the vacillations of the Industrial Production Index.

Dow Theory

Starting with Dow Theory, we have the following established indications:

  • On August 2, 2011, Dow Theory indicated that we were in the initial stages of a cyclical bear market (article here).  At the time, the Dow Jones Industrial Average (DIA) and the Dow Jones Transportation Average (IYT) fell below their respective June and March 2011 lows.
  • On August 9, 2011, we indicated that a bottom had been reached and that a bear market rally to prior highs was due, within the context of a cyclical bear market (article here).
  • On March 16, 2012, we demonstrated that the divergence between the Dow Jones Industrial Average and the Dow Jones Transportation Average was confirmation that we’re in a Dow Theory bear market rather than a renewed bull market (article here).

Generally speaking, Dow Theory acts as a leading indicator of the direction of the overall economy, with the Industrial Production Index following behind as confirmation.  In this case, this is the first month that the Industrial Production Index (IPI) has declined after the Dow Theory bear market indication of August 2, 2011.

Industrial Production Index

Historically, the Industrial Production Index has “averaged” a decline of 1.44 consecutive months in periods of an economic growth period.  This suggests that if the Industrial Production Index declines for two full months in a row, it would be enough to give us the all clear as to whether we can consider the economy as having reverted back into a recession after the rise from the June 2009 bottom.  This interpretation relies on Dow Theory also having a bear market indication.  In order for this to be the case, The Dow Industrials and Dow Transports would need to remain below their respective 2012/2011 peaks.

Month IPI data
August 2011 94.1845
September 2011 94.3800
October 2011 94.9389
November 2011 95.0939
December 2011 95.9095
January 2012 96.5705
February 2012 96.5731
March 2012 96.5685
Source: St. Louis Fed

What would the Market Impact Be?

So far, we expect that the recessionary period would have at least four consecutive months of declines in the Industrial Production Index (IPI) and a total of at least  7 non-consecutive months of declines within the period considered a recession.  This would be on par with the recession from July 1990 to March 1991.  At the time of the 1990 to 1991 recession, the S&P 500 (SPY) declined -19.61% and the Nasdaq Composite Index declined –29.90%.

However, The stock market typically leads the call of a recession by topping out first.  this suggests that potentially, the April 2, 2012 high for the Dow Industrials was the top and we're now in a declining trend at least until August/September 2012 to 10,611.59.

Again, our preliminary prediction is that if we see a second month of declines in the Industrial Production Index while the Dow Theory bear market indication is in place, we’ll have what will be considered a recession by the NBER which would be announced from 9 months to a year after the fact.

As a sidebar to the discussion of the possibility of a recession, the long-term gold stock positions that we've recently recommended which includes Agnico-Eagle (AEM),  Gold Fields Ltd. (GFI) and Newmont Mining (NEM) will require reduced exposure or sold off since gold and silver stocks tend to perform worse than the general stock market during a recession.

Note: Industrial Production Index data is subject to constant revisions by the Federal Reserve Bank.  We hope to reassess the Industrial Production Index based on the most updated information that is provided by the Federal Reserve.
Nasdaq 100 Watch List: March 16, 2012

Below are the Nasdaq 100 companies that are within 20% of their respective 52-week lows. This Nasdaq 100 Watch List is strictly for the purpose of researching whether or not the companies have viable business models or are about to go out of business. These companies are deemed highly speculative unless otherwise noted.

Symbol Name Price P/E EPS Yield Price/Book payout % from Low
CHRW C.H. Robinson Worldwide 65.67 25.06 2.62 2.00 8.55 50.38% 5.41%
VOD Vodafone Group Plc 26.41 12.28 2.15 3.60 1.02 44.19% 8.64%
EA Electronic Arts Inc. 17.46 0 -0.52 0.00 2.45 0.00% 8.79%
CTRP Ctrip.com Int'l 24.68 22.09 1.12 0.00 3.03 0.00% 12.08%
APOL Apollo Group 42.59 12.08 3.53 0.00 4.07 0.00% 14.86%
FSLR First Solar 29.08 0 -0.46 0.00 0.66 0.00% 14.99%
AMZN Amazon.com 185.05 135.07 1.37 0.00 10.82 0.00% 15.07%
RIMM Research In Motion 14.38 3.39 4.25 0.00 0.68 0.00% 15.50%
VMED Virgin Media Inc. 24.18 65.18 0.37 0.70 7 43.24% 17.84%
SRCL Stericycle, Inc. 86.88 32.3 2.69 0.00 6.11 0.00% 18.93%
DTV DIRECTV 47.47 13.68 3.47 0.00 -10.53 0.00% 19.21%
EXPD Expeditors Int'l of Wash 45.81 25.59 1.79 1.10 4.71 27.93% 19.76%

Watch List Summary

A company that we’re considering buying is C.H. Robinson Worldwide (CHRW), the first company on our list.  The primary consideration that we have is always the downside risk.  We almost ignore the upside targets and projections in order to come up with an idea on the best ways to avoid loss.

The following are two perspectives on the way to view the potential downside risk of buying CHRW. First, according to Dow Theory, CHRW has three significant downside targets that should be considered carefully. The three downside targets are as follows:

  • $60.34 (fair value)
  • $52.91
  • $38.06

The way we approach the Dow Theory downside targets is to buy CHRW if it falls to $60.34 (fair value according to Dow Theory). However, we prepare ourselves for the worst case scenario by expecting that CHRW will decline to the $38.06 level, the low for 2009. With this assumption, we ensure that our initial purchase does not include 100% of what we'd normally invest. Instead, we only invest 30%, 50% or 65% of the amount that we'd ordinarily invest. The remainder of funds is set aside for the possibility that the stock declines. Naturally the greater the amount invested initially, the greater the loss or gain if the stock declines or rises.

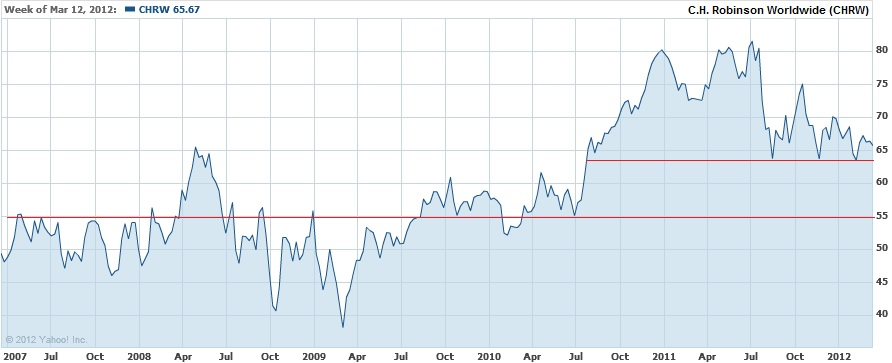
The second way to view CHRW's downside risk is strictly from the "technical" patterns based on a chart from the last 5 years.

3-16-2012

From a "technical" standpoint, there are significant support levels at $63.50, $55 and $38. These technical levels are not very different from Dow Theory even though the technical levels based on the chart above are strictly based on the visual cues. We specifically chose the last 5 years because Charles H. Dow has said that best way to gauge a company's future prospects is usually through careful consideration of the period when earnings, book value, price and other fundamental attributes are at their worst. For us, the inclusion of 2007 to 2009 is the best reflection of the worst that has been experienced recently.  With either approach to reviewing the downside risk of a stock, the purpose is ensure that you do not get caught off guard at the prospect of a major price decline.

Watch List Performance Review

In our ongoing review of the Nasdaq 100 Watch List, we have taken the topic 5 stocks from our March 6, 2011 Nasdaq 100 Watch List.   The top 5 companies from the watch list are provided below with the closing price from March 7, 2011 to March 6, 2012.

Symbol Company 2011 2012 % Change
CSCO Cisco Systems, Inc. $18.40 $20.03 8.86%
CEPH Cephalon, Inc. $56.17 $81.49 45.08%
AMGN Amgen Inc. $52.32 $67.38 28.78%
TEVA Teva Pharmaceutical Industries  $50.32 $43.08 -14.39%
ATVI Activision Blizzard, Inc $11.27 $12.65 12.24%
Average 16.12%
NDX Nasdaq 100 $2,328.07 $2,712.78 16.52%

3-6-2011 Top 5

Our primary goal at the New Low Observer is to achieve 10% gains within the span of a year inside of our tax deferred accounts.  In the case of AMGN, CEPH and ATVI our goal of 10% within a year was accomplished within the first four months.  CSCO was the last 10% gain that arrived at the end of the 1-year period.  Teva Pharmaceutical (TEVA) severely underperformed for the remainder of the 1-year period.  CEPH did not last very long since it was acquired by none other than Teva Pharmaceutical.  Cephalon was acquired by TEVA within two months of being on our watch list.

Our specific recommendation of Cephalon at $58.99 on February 15, 2011 and the subsequent acquisition explains why we’re drawn to companies at a new low.

Broader Market and Dow Theory Suggest Proceeding with Caution

As the Dow Jones Industrial Average and S&P 500 exceed the highs set in 2011, there is an alarming coincidence with 1972, just before the Dow Industrial’s -44% decline, that we’d like to bring to your attention.  To set the stage, we must first point out an important factor about the Dow Industrials and S&P 500 that contributes to their ability to reach new highs.

First, the Dow Jones Industrial Average is what is considered to be a price-weighted index.  According to Investopdia.com, a price weighted-index is:

“A stock index in which each stock influences the index in proportion to its price per share. The value of the index is generated by adding the prices of each of the stocks in the index and dividing them by the total number of stocks. Stocks with a higher price will be given more weight and, therefore, will have a greater influence over the performance of the index.” (read more here)

Next is the S&P 500.  The S&P 500 is a capitalization-weighted index.  Again, referring back to Investopedia.com, a market-cap weighted index is:

“A type of market index whose individual components are weighted according to their market capitalization, so that larger components carry a larger percentage weighting. The value of a capitalization-weighted index can be computed by adding up the collective market capitalizations of its members and dividing it by the number of securities in the index.” (read more here)

Each of these indexes are biased in the way they reflect the overall market movement.  In the case of the Dow Jones Industrial Average, it is biased towards the highest priced members while the S&P 500 is tilted to the stocks that are similarly expensive, on a market-cap basis.  In order to get a true sense of how all of the stocks are faring, rather than a select few that have been favored by investors, it is best to track a broadly based “equal-weighted” stock index.  According to Investopedia.com, an equal-weighted stock index  is:

“A type of weighting that gives the same weight, or importance, to each stock in a portfolio or index fund. The smallest companies are given equal weight to the largest companies in an equal-weight index fund or portfolio. This allows all of the companies to be considered on an even playing field.” (read more here)

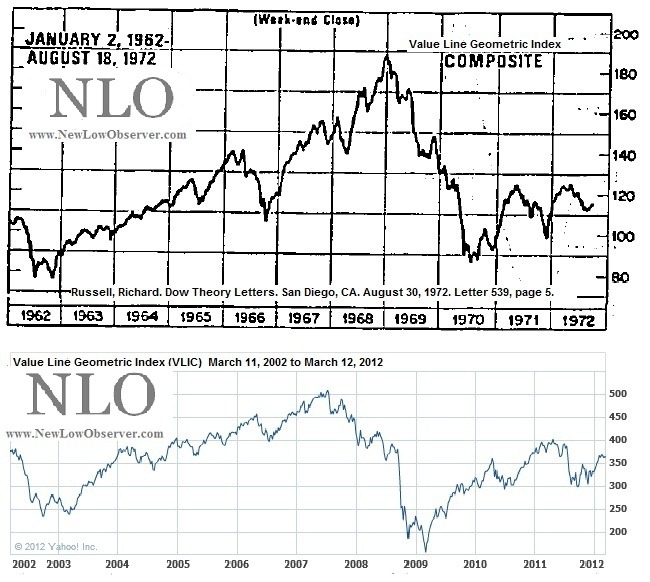
For the most part, an equal-weighted index reflects how all stocks have fared in a bull or bear market.  This is important because it allows for greater insight into where we are and potentially where we might be going.  One equal weighted index of over 1,700 companies that has been around since 1962 is the Value Line Geometric Index (found here).  In the chart below, we have compared the market action of the Value Line Geometric Index over a ten year period from 1962-1972 and 2002-2012.

Value Line Geometric

What should stand out the most between both charts is the fact that, according to the Value Line Geometric Index, while the general indexes like the S&P 500 and Dow Jones Industrial Average are making new highs, the majority of stocks have not participated in the rise.  In addition to not exceeding the peaks of 1968-1969 and 2007, the inability to exceed the 2011 highs is an indication of significant resistance as was experienced in 1971 and 1972 peaks.

Adding to our concern about the lack of participation by the broader stock market is the divergence between the Dow Jones Transportation Average and the Dow Jones Industrial Average since February 2012 (found here).  This divergence can also be found in the chart below in the period from April 6, 1972 to January 5, 1973 between the Transports and Industrials.  The declines that followed the divergence and peak of ‘72-‘73 were -59% and –44% for the Transports and Industrials, respectively.

DT '72

Until the Dow Theory divergence is resolved and the Value Line Geometric Index make new highs above the 2011 and 2007 peaks, we’re concerned that the stock market is skating on thin ice.

Dow Theory Update

It appears that Dow Theory is not understood, by even the best in the industry.  In an article titled “The Meaning of the Transports’ Weakness,” Mark Hulbert surveyed some of the industry’s best Dow Theorists for a clue as to what the market was expected to do next. What stands out in this article is the following remark:

“Frustratingly, not all Dow Theorists agree on an answer. In fact, two of the three monitored by the Hulbert Financial Digest — Jack Schannep of TheDowtheory.com and Richard Moroney of Dow Theory Forecasts — think the appropriate point of comparison is not last summer but late October. And because, near the end of December, the Dow averages rose above their late-October highs, both Schannep and Moroney believe that the Dow Theory is solidly in the bullish camp — notwithstanding where the Dow transports might be relative to their July high.”

Within this commentary is a revealing explanation as to the reason why we believe that Schannep and Moroney got it wrong, thereby issuing a bear market indication in August 2011 and a bull market indication in late December 2011.  In order to understand this, we must first point out a diagram of how Dow Theory reversals typically occur.

Plotting of Primary Reversal

Courtesy of Richard Russell’s Dow Theory Letters (www.dowtheoryletters.com), Figure 1a and Figure 1b show how the Industrials and Transports need to retest prior lows established at point A.  This retesting of the prior low would come after a medium-term rise at point B.  Once the market rests the prior low, the market would then need to exceed the medium-term high of point B.

With the diagram above, we can now see how Schannep and Moroney could have considered that a new bull market was in the making.  Once the market exceeded what they believed to be the POINT B in figure 1a and 1b, it then appeared to be a new bull market.  Unfortunately, while the Dow Industrials appeared to follow the script in Figure 1a, the Transports were far behind in providing a similar pattern of retesting the previous low.  This error led to an incorrect assessment of a new bull market.

Interestingly, Schannep and Moroney were inaccurate even in their call of a “bull market” using Dow Theory.  Based on the diagrams of figure 1, a new bull market should have been indicated in early October instead of late December.  In the chart below, it should be noted that the false bull market indication in October had much more to gain than the late December indication.  Worse still, only a month later, in February 2012, the Dow Transportation Average starts to diverge from the path of the Dow Jones Industrial Average.

2012 03 06 Dow Theory

The current divergence between the Industrials and Transports is a confirmation of the bear market trend.  Additionally, we expected that the Industrials and Transports are going to re-test the lows of 2011.  However, our suspicion is that both the Transports and Industrials will sink below the 2011 lows and possibly go strait to the 9,700 level on the Industrials.  The prospect remains that the bear market could potentially end if the Transports retest the lows of 2011 without falling significantly below.

As early as October 15, 2011 (article here), we indicated that the “…coming market volatility will provide great opportunities for traders and allow investors a chance to cash out of otherwise undesirable positions and take profits. Our expectation is that the Dow will go to the July 2011 highs before struggling at the May 2011 highs. Again, we’re still in a cyclical bear market until the Transports and Industrials exceed their respective 2011 highs.”

We hope that our readers have benefitted from our advice to unload undesirable positions.

Best regards.

Correction of Errors on iShares Silver Trust (SLV) Interpretation

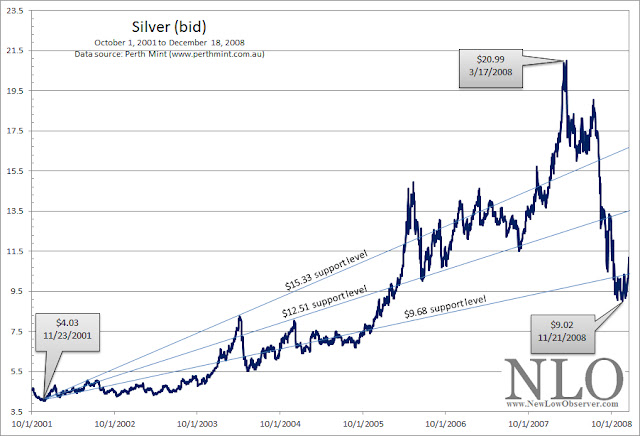
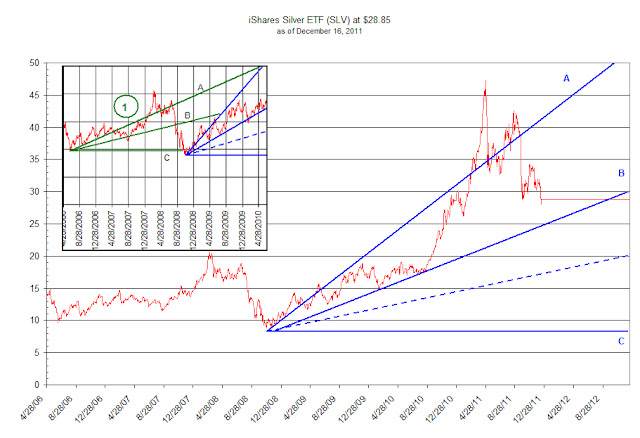
In our previous reviews of the iShares Silver Trust (SLV) (found here), we attempted to apply Dow Theory to the price movement of SLV. However, we have made an error in our analysis that has resulted in arriving at the wrong conclusion of the price potentially declining to the previous low that was established at the beginning of the bull market run on November 21, 2008 at $9.02.


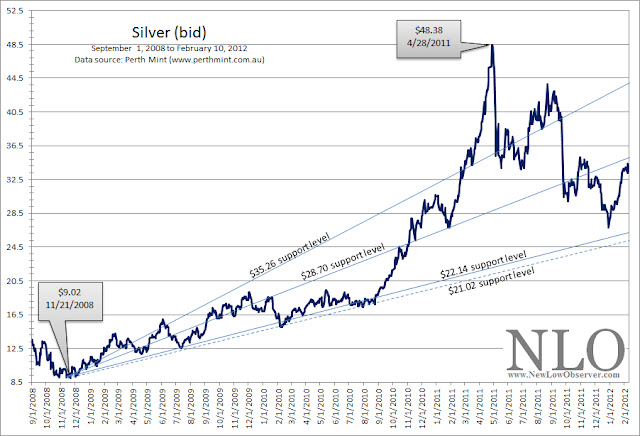
Instead, we are revising our analysis to reflect that the price of silver may decline as low as $21.02 if it were to replicate the rise and decline from October 2001 to November 2008.This revision should provide a more qualitative view on the future prospects for both SLV and the price of silver.


As background to the error that was made, we first must explain that the iShares Silver Trust (SLV) is supposed to track the price of silver. However, SLV has only been in existence since April 2006.Our Dow Theory analysis of SLV was incorrect because we didn’t have an appropriate starting point, the previous low, to arrive at a correct downside target. The previous low occurred in 2001 which was long before SLV began trading.


This resulted in the mistaken belief that SLV should be expected to go back to the low of 2008 at $9.02. To remedy our error, we have obtained the price of silver from the last major low in the price, and re-ran our Dow Theory analysis. The chart below provides the three downside targets from the March 17, 2008 high of $20.99.


The downside targets from the peak were as follows:
In the final outcome, the price of silver fell below the third downside target of $9.68, ultimately resting at the $9.02 level before making the ascent to the recent high of $48.35.This sets the stage for our analysis of the current price action.
Our current Dow Theory analysis involves the period from the November 21, 2008 low at $9.02 to the peak of April 28, 2011 at the $48.38 level. The downside targets are as follows:
It should be noticed in the chart below that as time passes, the support levels increase which exerts greater pressure on the price to either rise substantially or breakdown.


Despite the revision to our numbers, our previous analysis about the expected outcome has remained accurate.Our May 5, 2011 article was on target with the claim that SLV would trade in a range before falling much further. SLV traded in a range until mid-July and ultimately fell as low as $26.16, a drop of -30.87% since that article was written.
The current indications suggest that SLV will fall as the $22.14 support level. Because silver easily fell to the third support level in the period from 2001 to 2008 (within the context of a precious metal bull market), we expect that the $21.02 is a realistic worst case scenario to watch for. We will consider buying silver and related derivatives at $22.25 and below.
We view the most recent rise from the December 2011 low as running out of steam.Therefore, the rising resistance level established at $28.70 appears to be firmly in place…for now.

Dow Theory: Non-Confirmation

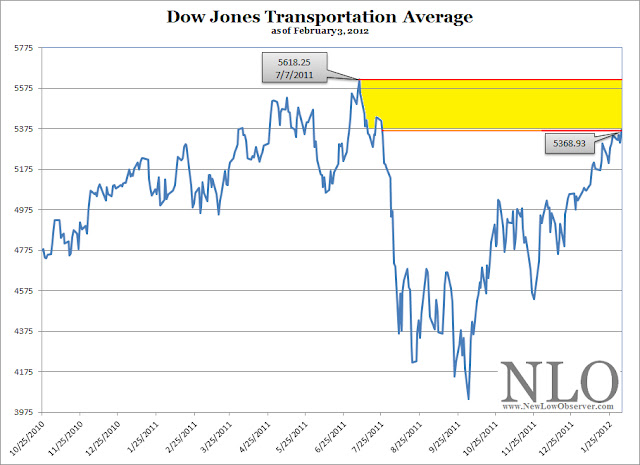
On February 3, 2012, the Dow Industrial Average made a new all time high since the low of March 2009.  All that is needed in order to achieve a confirmation of the upward trend is for the Dow Jones Transportation Average to exceed the July 7, 2011 high of 5,618.25.
There is a marginal difference of 4.64% between the Dow Transports high and the current level.  We're anxiously waiting to see if this gap can be closed with conviction in a relatively short period of time.  So far, every day that the Dow Industrials makes a new high with the Dow Transports below the previous high is considered a Dow Theory non-confirmation which reinforces the bear market thesis.

Dow Theory Applied to Silver?

A reader asks:

“How do you relate Dow Theory to the Silver market?”

Our response:

Charles H. Dow was first an economist, then a commodities expert and finally a stock market analyst. Before Charles H. Dow co-founded the Wall Street Journal, he was better known for writing the “Leadville Letters” for the Providence Journal. The “Leadville Letters” reported on Colorado’s silver mining boom in 1879. After co-founding the Wall Street Journal, the lessons learned in the silver mines ofColorado were found to have application on Wall Street.

Charles Dow was keenly aware of the importance and correlation between commodity prices and stock prices. Many of Dow’s articles in the Wall Street Journal were focused on the movement of commodity prices and all costs of production that went into commodity prices from shipping to the finished product.

As an example, Dow made the following observation:

“For the past 25 years the commodity market and the stock market have moved almost exactly together. The index number representing many commodities rose from 88 in 1878 to 120 in 1881. It dropped back to 90 in 1885, rose to 95 in 1891, dropped back to 73 in 1896, and recovered to 90 in 1900. Furthermore, index numbers kept in Europe and applied to quite different commodities had almost exactly the same movement in the same time. It is not necessary to say to anyone familiar with the course of the stock market that this has been exactly the course of stocks in the same period.”

Much of Dow Theory is based on Dow’s observation of the price action of commodities and then later applied to stock prices. The application of Dow Theory to the price of silver, gold or almost any other commodity is bringing Dow’s work back to its roots. In fact, Dow’s observations in commodities and then later applied to stocks is the basis for much of the modern fundamental and technical analysis that is done today, which includes the quest to determine the “value” of a company and the uses of Fibonacci numbers.

Dow Theory is applicable to all prices that are subject to the whims of market forces. Dow Theory also accounts for manipulation and hoarding. Dow Theory attempts to account for what can reasonably be expected of price action in the not too distant future.

Sources:

  • Dow, Charles. Review and Outlook. Wall Street Journal.February 21, 1901.
  • Bishop, George W. Jr. Who Was the First American Financial Analyst? Financial Analysts Journal, Vol. 20, No. 2 (Mar.-Apr., 1964), p.26-28.
  • Bishop, George W. Jr. New England Journalist: Highlights in the Newspaper Career of Charles H. Dow. The Business History Review.Vol. 34, No. 1 (Spring, 1960) p. 77-93.
  • More on Dow Theory from NLO

Dow Theory: 1907-1910

Bull market indication (A): According to Edwards and Magee, the bull market began on April 24, 1908. The New Low Observer believes that on January 9, 1908 (C), the DJI & DJT confirmed that we're in a bull market by going above the December 6, 1907 intermediate peaks. From the point (C) of the bull signal to the respective market tops, the DJI gained 55% and DJT gained 44%.
Bear market indication (B): Edwards and Magee indicated that on May 3, 1910, the bear market signal was initiated.  However, we believe that on January 12, 1910 (D) the DJI confirmed the  DJT bearish move of falling below the September 9, 1909 low. From the point of the bear signal (D) to the respective market bottoms, the DJI lost -23% and the DJT lost -16%.

iShares Silver Trust (SLV) Update

The iShares Silver Trust (SLV) ETF has fallen in line with our assessment from May 5, 2011.  However, it is times like these that we get nervous about our ability to believe that the price action of SLV will continue on a forecast that was presented over six months ago.  Back in May, we said the following:

“…we should see SLV tread water for a brief period of time before falling back to the prior low which began with the current run back in November 2008.   Dow Theory suggests that a reasonable buying opportunity would exist at [or] below line B (blue line B).”
Currently, the “blue line B” is around $24.31 and rising as time passes.  In our May Dow Theory interpretation of SLV, the price fell right through line B in 2008 without any hesitation.  We’re not so certain that such action will occur this time around.  As long as SLV can hold above the Dow Theory fair value of $28.15, there is a good chance silver will be able to rebound in a meaningful fashion.  However, closing below $28.15 (again) could be a confirmation of the downtrend.    
Many precious metal enthusiasts are arguing that what happened in 2008 was an outlier event for silver and therefore is unlikely to happen this time around.  It is hard to argue against such a view. However, it is difficult to get the period from 1974 to 1976 out our mind (visual here) when gold fell 50% and gold stocks fell 66% in the middle a gold bull market.  
Below is our updated chart of SLV reflecting the most recent price action:
The Punchline: If you like the idea of investing in silver, then a buying opportunity should be at/or below the blue line B ($24.31).  However, don’t go all in, just in case the dashed blue line does materialize at $17.


Dow Theory: Bear Market Rally Coming to an End?

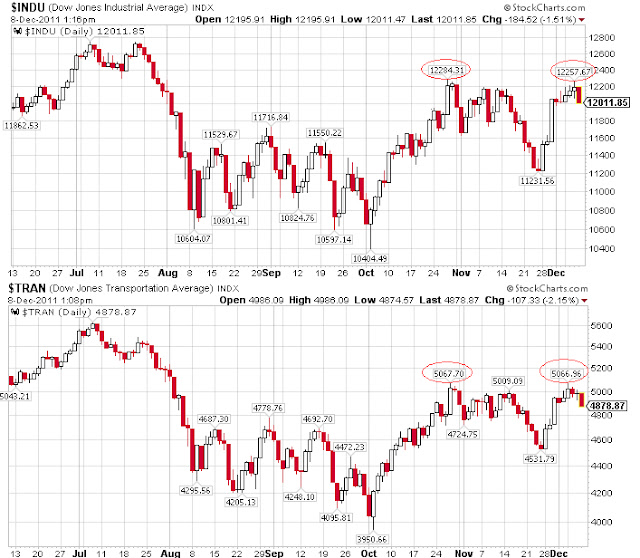
Does the end of the recent upside market action hinge on as little as 27 points? It appears that the inability of both the Dow Jones Industrial Average and Dow Jones Transportation Average to exceed the prior highs set on October 28, 2011 and October 27, 2011 (red circles), respectively, may have marked the end to the bear market rally.
The potential downside targets for both indexes are 1) the November 25th and 2) October 3rd lows, (in that order). Falling below the October low should bring a downside target of 9700 on the Dow Jones Industrial Average.  The upside targets remain in place as indicated in our October 15, 2011 article (found here).

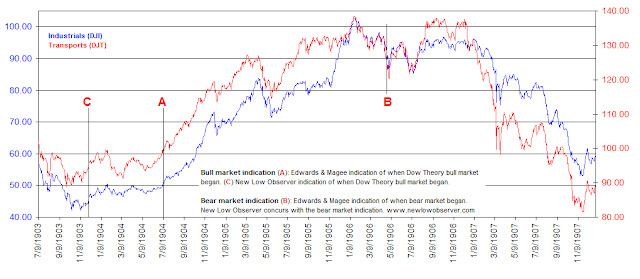
Dow Theory: 1903-1907

Bull market indication (A):According to Edwards & Magee's book Technical Analysis of Stock Trends, the bull market began at point A. From the point of the bull signal to the respective market tops, the DJI gained 100% and DJT gained 37%. The NLO team believes that at point (C) on 12/4/1903, the DJI confirmed the 11/30/1903 DJT signal that a bull market was in progress by exceeding the late Oct 1903 peaks. From the point of the bull signal to the respective market tops, the DJI gained 126% and DJT gained 47%.
Bear market indication (B): On 4/24/1906 the DJI confirmed the 4/19/1906 DJT bearish move. The signal came when the DJT dropped below the Sept 1905 low and the DJI dropped below the December 1905/March 1906 lows. From the point of the bear signal to the respective market bottoms, the DJI lost -42% and the DJT lost -35%. The NLO team is in agreement with the Edwards and Magee as to when the bear market began.
Please consider donating to the New Low Observer. Thank you.

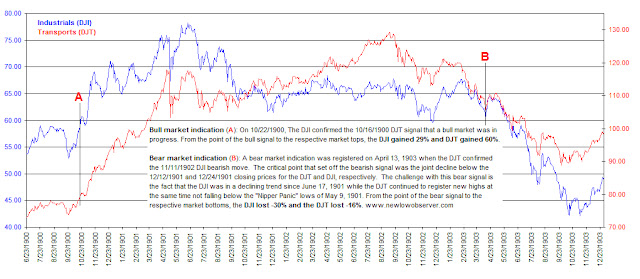
Dow Theory: 1900-1903

The following is the beginning of a series that examines prior bull and bear market indications according to Dow Theory since 1900.  We will include opinions and insights from the leading Dow Theory proponents and commentators from the respective periods, whenever possible.
Industrials (DJI), Transports (DJT)

Text in chart:

Bull market indication (A): On 10/22/1900, the DJI confirmed the 10/16/1900 DJT signal that a bull market was in progress.  From the point of the bull signal to the respective market tops, the DJI gained 29% and the DJT gained 60%.
Bear market indcation (B): A bear market indication was registered on April 13, 1903 when the DJT confirmed the 11/11/1902 DJI bearish move.  The critical point that set off the bearish signal was the joint delcine below the 12/12/1901 and 12/24/1901 closing prices for the DJT and DJI, respectively.  The challenge with this bear signal is the fact that the DJI was in a declining trend since June 17, 1901 while the DJT continued to register new highs at the same time not falling below the "Nipper Panic" lows of May 9, 1901.  From the point of the bear signal to the respective market bottoms, the DJI lost -30% and the DJT lost -16%.

Dow Theory: Market Behaving as Expected

On August 9, 2011, we proposed that a bottom had been established in the market. Additionally, we proposed what the upside targets were based on Dow Theory.

Our assessment of where the market bottom was (based on the August 8th low) at 10,809.85 was off by 154.55 points, or 1.42%, when the Dow Industrials reached the lower level of 10,655.30 on October 3, 2011.

The purpose of pointing out bear market rally targets is to indicate where the market is expected to go on the upside. So far there is only one upside target left from the August 9th article. All that has taken place since then has been in alignment with classical Dow Theory.

On October 15, 2011, we wrote an article titled "Dow Theory: Bullish Implications." In that article we said the following:

“The coming market volatility will provide great opportunities for traders and allow investors a chance to cash out of otherwise undesirable positions and take profits. Our expectation is that the Dow will go to the July 2011 highs before struggling at the May 2011 highs.”

Historically speaking, daily gains of 2%-3% or more in the Dow Industrials is reflective of an unhealthy market. We are repeating that the current run is a golden opportunity to shed unwanted positions. It is hoped that long-term investors are in positions that are compensating for the wait, through the reinvestment of dividend income.

We’re anxious to see whether or not the Dow Industrials and Dow Transports can exceed their respective 2011 highs. Such a breach would indicate an end to the current cyclical bear market run and the beginning of a cyclical bull market. However, the overhang of a secular bear market, marked by the October 2007 high, provides considerable resistance to even higher levels.

Please consider donating to the New Low Observer. Thank you.

Richard Russell Review: Letter 713

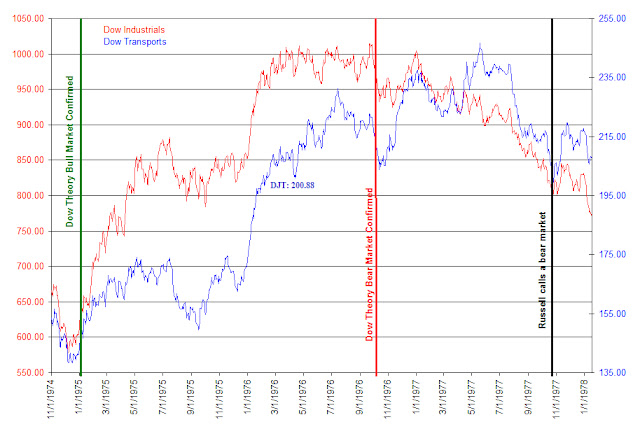
This review of Richard Russell’s Dow Theory Letters is dated November 9, 1977 when the Dow Jones Industrial Average was at 818.43 and the Dow Jones Transportation average was at 206.56.
  
Dow Theory
The first topic addressed by Richard Russell is Dow Theory.  On this topic, Russell says the following:
“THE PICTURE: As far as I’m concerned, as far as my studies of the Dow Theory are concerned, a valid primary bear market signal was given when, on October 24 [1977], the Transportation Average confirmed the prior bearish indications of the Industrials. There are always those who cry, ‘The signal was late, it was too late!’ But no competent Dow Theorist in history ever waited for an actual bull or bear signal before taking action! For instance, we bought stocks in December, 1974 before the 1975 bull market signal, and we sold our stocks in March and April of this year well ahead of the October, 1977 bear market signal. We bought and sold on many clear indications, and the final Dow Theory signal merely confirmed what we had suspected and had acted upon.”
First, we’d like to address when a bear market signal is most likely to have occurred after the bull market signal that was confirmed in January 1975. From our perspective, the bear market was signaled on October 5, 1976 for the Transports and October 8, 1976 for the Industials when both indexes fell below the late August 1976 lows.
For whatever reason, Russell acknowledges that the call was late but doesn’t confirm how late he was.  Looking back at the October 16, 1976 issue of Dow Theory Letters  (Letter 678), in the first issue after we believe the bear market began, Russell makes no reference to the dual violation to the downside by both indexes.  Russell does allude to the Transportation Average level of 200.88 which he believed the market to be “weak” if the index fell below such a point.  On October 16, 1976, Russell said the following:
“On the other hand, if the 200.88 level is broken, I would take this as a sign of unusual weakness, and I would take an even more cautious stance towards the market (which means selling more stocks and upping the bond portion of your portfolio even further.”
Naturally, there is a high level of inconsistency in suggesting that he would lighten up on his stock holdings if the Transportation Average fell below 200.88.  In the November 9, 1977 issue, Russell claimed that at the time the Transports fell below the indicated level he “sold our stocks in March and April of this year well ahead of the October, 1977 bear market signal.”
Although done in hindsight, our interpretation, almost a full year ahead of Russell’s call of a bear market, would have sheltered the investor from 3 times the loss.  This is consistent with our Dow Theory bull market indication in July 2009 and our more recent bear market call on August 2, 2011 (all NLO Dow Theory Bull Market articles) contrasted with Russell’s many bull and bear misinterpretations from March 9, 2011 (as partially outlined here).
The difference in Dow Theory Bear Market interpretations to the March 6, 1978 low:
Date
Transports decline
Industrials decline
Russell:
10/24/1977
-1.20%
-7.43%
NLO:
10/8/1976
-4.89%
-22%
Ironically, Russell says the following of those skeptical of the Dow Theory bear signal on October 24, 1977:
“…others said that if it was indeed a bear signal, then probably the greatest portion of the market slide was over anyway. Two days after the bear signal, the market rallied sharply, as if in disbelief.”
Since Russell’s call of a bear market was in fact long after the majority of losses were incurred, he only furthered the skepticism and misinformation of a useful tool for investors and businesses alike.  From the March 6, 1978 low to the April 27, 1981 high, the Dow Industrials increased by 37.87% while the Transportation Average increased 119.71%.  Alternatively, the Dow Industrials increased 23.17% and the Transports increased 117.55% after Russell’s indication that a bear market began on October 24, 1977.
Steps to a Dow Theory Bear Market signal:
  • July 14, 1976 Transports hit new high 231.27 but unconfirmed by Industrials
  • Sept. 21, 1976 Industrials hit new high at 1014.79 but unconfirmed by Transports
  • Oct. 8, 1976 both indexes fall below the late August lows-Bear Market begins
On page 3 of the DTL, Russell starts a Q&A with a question that has a very interesting answer:
“Question: Suppose we get a rally that turns out to be a huge advance? Then what, Russell?
“Answer: We have a number of ‘fail-safes’ that work on either the bull side or the bear side of the market. The one I’m thinking about in particular is my study of the three moving averages of the Dow. At this juncture, the 13-week MA is a whopping 71 points below the 50-week MA, and we would need a crossing to get a major bull signal. Furthermore, the 4-week MA (short-term MA) is at 814, 29 points below the 13-week MA (intermediate-term) which is at 843. We need a crossing of the 4-week MA above the 13-week MA merely to get a ‘buy-alert.’ That would take time. So in the absence of a full over-sold bottom, I would say, ‘Skip any rally that may be forthcoming, or wait for the Dow’s moving averages to cross.’”
There is a concern that we have regarding this section of Russell’s letter.  First, a “fail-safe” provision should address what actions to take if investments don’t work out.  Being out of stocks altogether isn’t investing nor is it working towards compounding, an overarching, albeit conflicting, theme in Russell’s work.  Therefore, Russell’s “fail-safe” observations based on a moving average requires reacting to a lagging indicator which compounds the delay in taking advantage of investment opportunities.  In fact, using such an approach causes investment activity, or lack thereof, to be made at the worst possible time.
In general, the use of moving averages for buy indications seems to be in contradiction to Dow Theory.  As pointed out earlier, moving averages are lagging indicators whereas the use of Dow Theory is supposed to act as a leading indicator.  Although Dow Theory provides bull or bear market indications not buy and sell recommendations, it can be effectively used to navigate market gyrations.  Based on the performance of the markets after Russell’s call of a bear market, it is clear that the mixing of moving averages and Dow Theory led to conflicting ideas of market direction that allowed Russell’s “Great” Depression bias to become the default reaction.
Treasuries
On page 4, Russell gives a quick blurb that had been overlooked for a long time in the mainstream media until recently.  Russell says the following:
“I might also mention that if the public became wary of the banking system, there could be a major move out of bank deposits and into Treasury bills.”
This has been the story of our experience in the market since 2008.  Furthermore, as the European Union struggles with their less than integrated banking system, demand for Treasuries grows.  This is in stark contrast to the belief that gold is king when there is a banking crisis.  We believe such a view is a holdover from when countries propped the price of gold with a gold standard.  The decline of gold and gold stocks in 2008 shows that there is another horse in the race for financial “safety.”
Gold & Swiss Franc
Russell points out something which seems extremely relevant to any investor in gold and that is the relationship between gold, gold stocks and the Swiss franc.  Russell says the following:
“Now here’s what nobody (or let’s say very few people) know.  If I asked you “How’d you like to own Swiss francs at the early-1974 price?”  you’d probably jump at the chance.  Why would you jump?  Because the Swiss franc has been a hot item, a glamour currency.  Look at my next chart (bottom of p.5).  Note that the Swiss franc was about 31 cents in early-1974.  Gold at that time was $166 per ounce.  All right, the franc is now 45 cents or about 45% above its early-1974 price, in terms of dollars.  But gold is roughly the same price as it was in early-1974!  Now what the hell makes the Swiss franc better than gold?  The irony is that the Swiss franc is highly valued because it has such a high level of gold backing.”
Nothing could be more instructive than the review of the price of gold, gold stocks and Swiss francs during what was perceived to be a gold bull market. Few gold bugs will acknowledge the amazing decline in the price of gold from early 1975 to the low of 1976.  The decline was nearly 50% of the peak price and lasted nearly two full years.  Likewise, the Barron’s Gold Average lost nearly 66% from the high achieved in 1974 to the low near mid-1976.  The Swiss franc, on the other hand, remained in the a narrow trading range or moved higher.
Russell was correct to question “…what the hell makes the Swiss franc better than gold?”  Although Russell never mentions it, by pointing out the “uncharacteristic” rise of the Swiss franc at the time, we gathered that the activity of the Swiss franc implies that it is an indicator for the longer-term price of gold.  Because we’ve pointed out in many previous articles the fact that gold isn’t always the safe haven that it is fabled to be, when the next big decline in the price of gold occurs we will be watching closely the action of the Swiss franc for any indications of investment opportunities in gold stocks.  We have constructed what we believe to be a reliable indicator for the best time to buy gold stocks that are constituents of the Philadelphia Gold and Silver Stocks Index.  The action of the Swiss franc will act as a confirming indicator when the index is near a new low.
More Russell Reviews:

Dow Theory: Bullish Implications

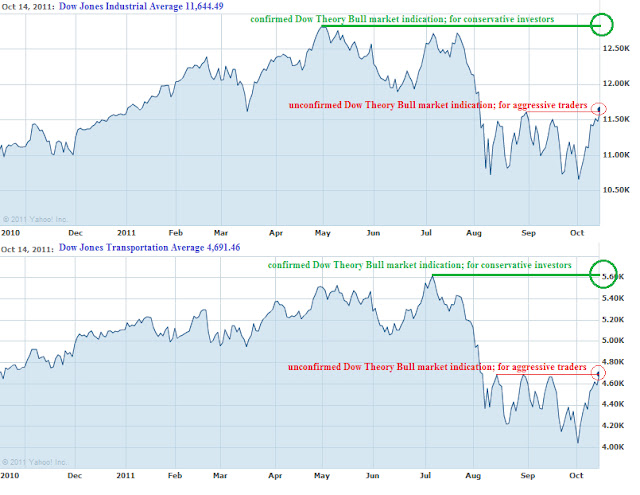
This week the Dow Jones Industrial Average and Dow Jones Transportation Average provided indications that, according to Dow Theory, have bullish implications.  On October 14, 2011, the closing of the Industrials above 11,613.53 and the Transports above 4,684.44 suggests that the indexes will at least rise to the July highs and maybe even the April 2011 highs.
This bullish implication stands juxtapose to the bear market confirmation that was received when the Industrials and Transports simultaneously declined to new lows on October 3, 2011.  Our view is that we’re still in a cyclical bear market that cannot become a cyclical bull market until both indexes exceed the April and July highs.  To become a secular bull market, the Industrials and Transports need to go above their 2007 high.


Some would suggest that for anyone to wait until the indexes rise to the 2011 highs there would be a lot of missed investment opportunities.  However, as we’ve indicated many times in the past, we use Dow Theory signals as an allocation indicator.  During bull markets, we put more money to work and the opposite is true when there is a bear market indication.  There are few instances when we’re completely out of the market for an extended period of time based on a bear market indication, as demonstrated in our 2008 investment transactions.  Therefore, we have little concern for “missed” opportunities.


Additionally, although we got a bear market signal on August 2, 2011, which was 96 days after the April 29, 2011 peak in the Industrials, our portfolios were up for the year.  After reallocating our investment positions upon getting the bear signal, we were able to reinvest in quality companies, sometimes the same stocks, at significantly lower prices.


The coming market volatility will provide great opportunities for traders and allow investors a chance to cash out of otherwise undesirable positions and take profits.  Our expectation is that the Dow will go to the July 2011 highs before struggling at the May 2011 highs. Again, we’re still in a cyclical bear market until the Transports and Industrials exceed their respective 2011 highs.


Related article: A Lesson in Dow Theory published November 7, 2010
Please consider donating to the New Low Observer. Thank you.