Below is a great charting of Dow’s 50% Principle from the work of Richard Russell. Continue reading
- Japan
- Market Indicator
- Price Momentum Indicators
- Richard Russell
- Silver
- Speed Resistance Lines
- U.S. Dividend Watch List

Below is a great charting of Dow’s 50% Principle from the work of Richard Russell. Continue reading
Posted in 50% principle, bear market, bear market rally targets, Dow Theory
Tagged members
Bear Markets for the Dow Jones Industrial & Transportation Averages from their peaks to their ultimate lows.

see also:
In terms of duration:
A bear market usually lasts ¼ to ⅓ of the preceding bull market. It’s just a rule of thumb but it will be clear why this is needed. Let’s look at the data, based on Charles H. Dow’s requirements, and arrive at potential durations for the current bear market.
The bull market of 2002 to 2007 had a bear market that was 28% (in time) of the trough to peak.
If this bull market began in 2009 and ended on February 2020 and matched the length of the 2002-2007 bear market then the presumed equivalent would bring the end of the bear market out to July 2022 (approximately).
However, let's assume that this bear market is going to last 14% of the 2009-2020 period (half of the 28%), then that would bring us out to April 2021 (approximately).
Being as conservative on the bear market scenario as possible, if this bear market lasts 7% of the 2009-2020 period, then that would bring us out to September 2020 (approximately).
On April 3, 2019, we said that the 2014-2016 period might have been a recession (as outlined in a major publication). If we took 25% of the period from the February 2016 low to the February 23, 2020 peak as a separate bull market then the current bear market would end in December 2020.
This is going to be a long year even under the best case scenario with a bear market that ends approximately September 2020. When we say it ends in September 2020, we mean that the price of major indexes decline below the lowest levels already reached on March 23, 2020.
Posted in bear market, Charles H. Dow, Duration
A bear market is upon us so it's time to dust off these books that can help us navigate through this market.
Posted in bear market, bear market rally targets, book
NOTE: In our Dow Theory posting of May 18, 2014, we revealed an issue with Dow Theory that has gone unaddressed since S.A. Nelson’s book, The ABC of Stock Speculation, coined the term “Dow’s Theory.” We believe the acknowledgment of this issue adds clarity to the writings of Charles H. Dow and may produce new insights that have not previously been explored.
On May 19, 2012, we said that the bear market rally had ended (found here). In our view, we believed that the Dow Jones Jones Industrial Average would not exceed the high of 13,279.32 set on May 1, 2012. The most recent run of the Dow Industrials is causing us to wonder if our assessment was correct.
Despite our concern that the Dow Industrials will increase above 13,279.32, we do need to point out two technical non-confirmations of the market that have been established so far. First is the secular (long-term) level of the market. Ordinarily, the secular (long-term) trend of the market would be bullish when and if both the Industrials and Transports rise above their respective 2007 to 2012 peaks.
As can be seen in the chart below, the horizontal black lines shows that the Transportation Index managed to rise above the prior high of 2007/2008. At the same time, the Dow Jones Industrial Average did not come as close to the prior highs. This lack of confirmation suggests that we are still in a secular (long-term) bear market.

At the same time, on a cyclical basis (short-term), as indicated by the green lines above, the Dow Jones Industrial Average and Transportation Average have gone their separate ways. The Dow Jones Industrial Average trending higher while the Dow Jones Transportation Average has trended lower.
So far, all indications are that we’re in a cyclical and secular bear market. Since our bear market indication of August 2, 2011 (found here), we have not received any indication to the contrary. However, if we’re completely wrong about the bearish direction of the market, a Dow Theory bull market indication on a cyclical basis (short-term) would occur if the Dow Industrials and Transports were to increase above 13,279.32 and 5,627.85, respectively. Additionally, a bull market indication on a secular basis (long-term) would occur when the Dow Industrials and Transports exceed their respective highs in the period from 2007 to 2012.
Despite our concern for the bear market that we are in, we continue to pursue the policy of accumulating stocks that appear reasonably undervalued which is in accordance with Charles H. Dow’s emphasis on values at a reasonable prices. Our most recent purchases of Carbo Ceramics (CRR) and Expeditors International of Washington (EXPD) brings our partnership portfolio to 57.78% in stocks and 42.22% in cash.
Comments Off on Dow Theory Update
Posted in bear market, Dow Theory, Dow Theory Non confirmation
Review
On August 23, 2009, using Dow Theory and the Industrial Production Index [IPI], we predicted that the National Bureau of Economic Research (NBER) was going to say that the recession ended in June 2009 (article here). We specifically said the following:
“Implicit in my discussion of the IPI [Industrial Production Index] is that we are at a turning point for the economy. Based on the combination of the Dow Theory confirmation of July 23, 2009 and the IPI turning up from the June low, I will have to guess that the National Bureau of Economic Research (NBER) is going to proclaim June 2009 as the official end to the recession. The end to this recession will be lackluster and questioned from all corners.”
As has been the case historically, the announcement that the recession had ended came 1-year and 3 months after the fact (NBER announcement found here.) Additionally, few have been satisfied with the definition of a recovery especially if it means that job growth and income increases have not been exceptional.
Now we are faced with what we believe could be the defining moment for a sustained stock market and economic decline worthy of being deemed (by NBER) a recession. The factors that go into this assessment are based on our interpretation of Dow Theory and the vacillations of the Industrial Production Index.
Dow Theory
Starting with Dow Theory, we have the following established indications:
Generally speaking, Dow Theory acts as a leading indicator of the direction of the overall economy, with the Industrial Production Index following behind as confirmation. In this case, this is the first month that the Industrial Production Index (IPI) has declined after the Dow Theory bear market indication of August 2, 2011.
Industrial Production Index
Historically, the Industrial Production Index has “averaged” a decline of 1.44 consecutive months in periods of an economic growth period. This suggests that if the Industrial Production Index declines for two full months in a row, it would be enough to give us the all clear as to whether we can consider the economy as having reverted back into a recession after the rise from the June 2009 bottom. This interpretation relies on Dow Theory also having a bear market indication. In order for this to be the case, The Dow Industrials and Dow Transports would need to remain below their respective 2012/2011 peaks.
| Month | IPI data |
| August 2011 | 94.1845 |
| September 2011 | 94.3800 |
| October 2011 | 94.9389 |
| November 2011 | 95.0939 |
| December 2011 | 95.9095 |
| January 2012 | 96.5705 |
| February 2012 | 96.5731 |
| March 2012 | 96.5685 |
| Source: | St. Louis Fed |
What would the Market Impact Be?
So far, we expect that the recessionary period would have at least four consecutive months of declines in the Industrial Production Index (IPI) and a total of at least 7 non-consecutive months of declines within the period considered a recession. This would be on par with the recession from July 1990 to March 1991. At the time of the 1990 to 1991 recession, the S&P 500 (SPY) declined -19.61% and the Nasdaq Composite Index declined –29.90%.
However, The stock market typically leads the call of a recession by topping out first. this suggests that potentially, the April 2, 2012 high for the Dow Industrials was the top and we're now in a declining trend at least until August/September 2012 to 10,611.59.
Again, our preliminary prediction is that if we see a second month of declines in the Industrial Production Index while the Dow Theory bear market indication is in place, we’ll have what will be considered a recession by the NBER which would be announced from 9 months to a year after the fact.
As a sidebar to the discussion of the possibility of a recession, the long-term gold stock positions that we've recently recommended which includes Agnico-Eagle (AEM), Gold Fields Ltd. (GFI) and Newmont Mining (NEM) will require reduced exposure or sold off since gold and silver stocks tend to perform worse than the general stock market during a recession.
Note: Industrial Production Index data is subject to constant revisions by the Federal Reserve Bank. We hope to reassess the Industrial Production Index based on the most updated information that is provided by the Federal Reserve.
Today, the Dow indexes continued to slump and ended the day down more than 2%. While we would look for a breach of the June 2011 low to be a key indicator of the bearish trend, we’re primarily focused on the March 2011 low to be the most revealing level. The charts below graphically make clear what may become the trend for the market over the next several months.


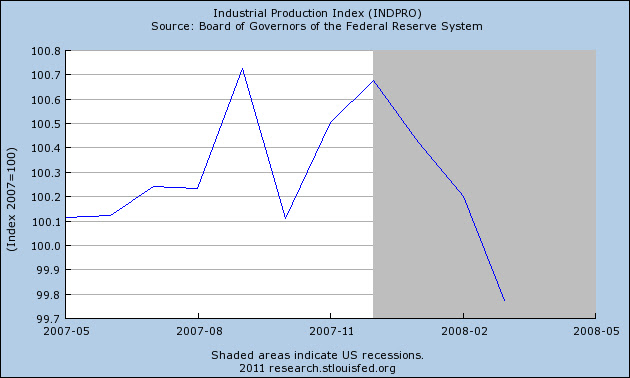
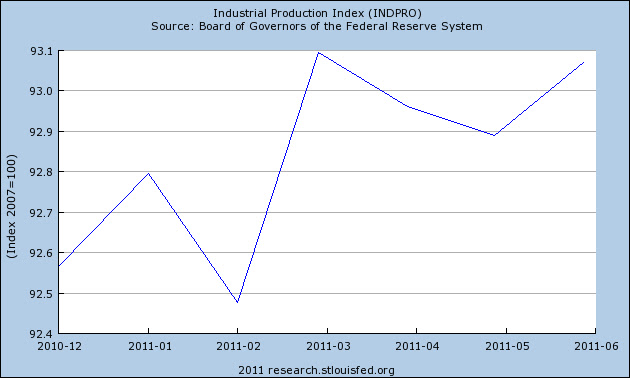
The connection between the Industrial Production Index and Dow Theory is well established as put forth by the Dow Theorist Robert Rhea. Our last article (found here ) on the Industrial Production Index made clear the importance of considering the movements of this indicator.
We’d be jumping to conclusions if we went so far as to conclude that the July Industrial Production Index numbers would not exceed the March 2011 high of 93.0943. However, we would be surprised if the INDPRO, despite already being so close to the high, manages to go above the numbers that were set in June and March 2011.
The caveat to our analysis on the Dow Industrials and Dow Transports is the possibility that the Industrials actually don’t go below the low set in March 2011 (considered a divergence or non-confirmation of the trend). If the Dow Industrials do not confirm the same lows as the Transports then we’d essentially be in a Dow Theory no-man’s land. Under such conditions, the bias should be towards being bearish but on a wait and see basis.
Posted in bear market, Dow Theory