
In our prior work on the topic of gold and silver, we indicated that the precious metals market had entered into a secular bull market. Our confidence in that thesis was based on the works of Edward Dewey and Edwin Dakins 1947 book titled Cycle: The Science of Prediction. In that book, Dewey and Dakins illustrated the cycles for inflation which indicated that a peak in inflation would occur in 1979 and a trough of inflation would occur around 2006. While the 1979 peak was accurate the 2006 bottom was off by a few years. However, we feel confident that being off by a few years within the context of a 50-year cycle allows for some margin of error.
As investors, the NLO team is primarily concerned with the downside risk and major downside targets. For the gold and silver market, we will use the Philadelphia Gold and Silver Stock Index (XAU) to determine where the next low might occur.
To project the downside target for the XAU, we will use speed resistance lines as pioneered by Edson Gould. William X. Scheinman wrote a piece in Barron’s titled “600 on the Dow” on February 9, 1970 that outlined exactly how Gould’s resistance lines work.
The forecast by Scheinman of a closing low for the Dow at 600 was off by 2.57% when the index closed at 584.56 on October 4, 1974. [As a sidebar, Dow Theory gave a bull market indication in January 1975 that would have investors fully invested.] Although being off by such a small amount, Scheinman also said that the low would occur approximately a year from the date that the article was written. We believe that the tactical error on the part of Scheinman was to expect that the decline would be based strictly on a set time frame rather than based on the level of the resistance line. The chart below is the original piece that was generate by Scheinman from 1970.
In our chart of the Gold and Silver Stock Index, we have drawn the XAU on a daily basis from 1983 to the present. As described by Scheinman, the counter-trend movement should revert to the speed resistance line or two-thirds of the established high. As an example, the previous peak of the XAU on March 14, 2008 was at the 206.37 level. 206.37 divided by 3 is 68.79. The reversal from the 2008 decline was 65.72 on the XAU. This was within 4.5% of the speed resistance level.
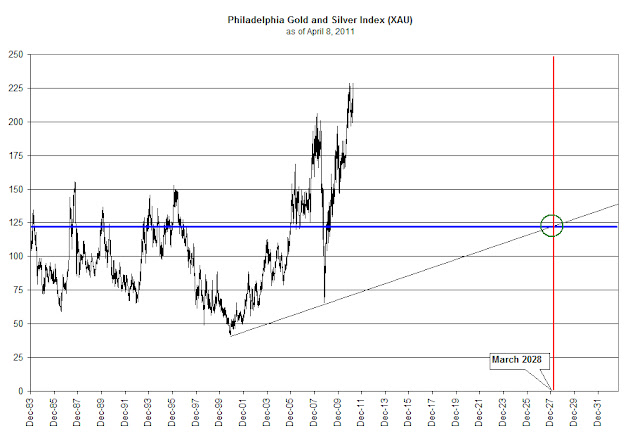
Based on the most recent high of 228.95 the downside target for the XAU index is 76.32. We recommend that whenever the XAU index falls at or below the speed resistance line drawn on the chart, between now and just before 2028, as part of the secular rising trend in interest rates/inflation, we would expect that the stocks in the index are underpriced. Confirmation of fair values should be determined for possible speculative positions at these times.
Note: A variation on this method is to divide the high by three then adding the first major low after the start of the bull market, in this case the October 27,2008 low for the XAU. An example of the usefulness of this technical approach to projecting downside targets can be found by dividing the 2007 top in the Dow Jones Industrial Average (14,164) by three and adding the 1987 low (1738.74). This provided a speed resistance line of 6460.07 which was within 2% of the actual March 9, 2009 low. The blue horizontal line, in our chart of the XAU above, represents the expected downside target when adding the October 2008 low to the speed resistance line.