
Although the markets have been relatively quiet in the last few weeks, according to Dow Theory, the Dow Jones Industrials Average and the Dow Jones Transports Average have been demonstrating classic conditions that would allow us to determine if the market will continue beyond the prior highs set in January or continue lower.
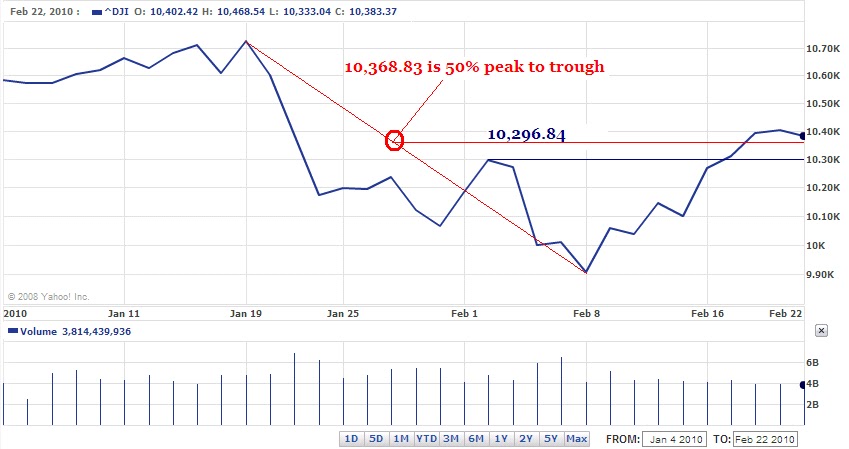
The Dow Jones Industrial Average is the measure by which everyone gauges “the market.” In the chart below, since the January 19th peak of the Industrials, the market declined until the February 8th bottom. After February 8th, the Industrials managed to exceed the rally high of 10,296.84. By exceeding the high of 10,296.84 and the 50% level of 10,368.83, the Industrials have demonstrated a bias towards going higher rather than lower.
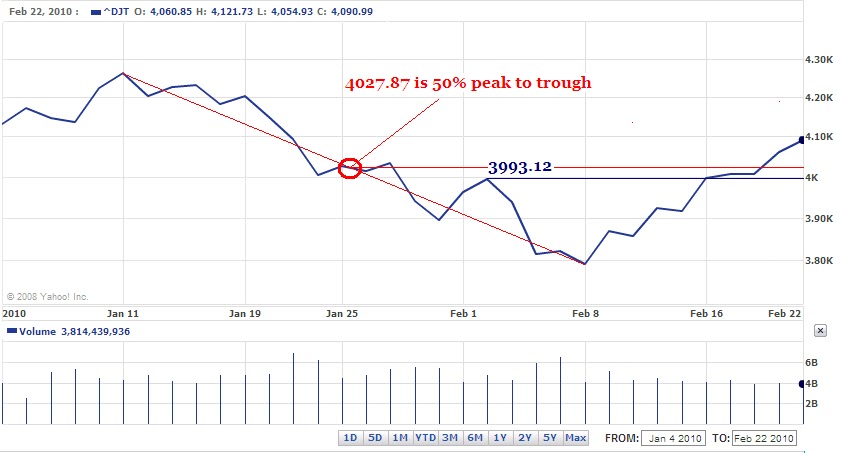
For the Dow Jones Transportation Average, the peak of January 11th and the trough of February 8th gave us a decline of 469.97 points or 11.02%. When the index bottomed on February 8th, it was able to exceed the 3993.12 level, which is a classic Dow Theory indication that the index is going back to the old high of 4262.85. Ideally, in the chart below, if the index could stay above the 50% level (red horizontal line) and finally the 3993.12 (blue horizontal line) then we could expect the Transports to go back to the old high and possibly beyond 4262.85.
In order for Dow Theory to work, we need both the Industrials and the Transports to confirm the action of each other. So far, we’ve seen the Industrials confirm the decline started by the Transports on January 11th with a declining pattern on January 19th. After both indexes started trending downwards they both had significant rallies within the downward trend, which peaked at 10,296.84 and 3993.12. Both indexes bottomed on February 8th and moved above the rallying peaks and the 50% ranges within the previous downward trends. All of these confirming moves point to the prospect of a higher market.
The only holdout is that the Industrials went lower today (Feb. 22nd) while the Transports continued higher. From my experience, since the bottom in March 2009, I have noted that the Transports have led the way with the Industrials ultimately confirming the direction. However, this current move down, by the Industrials, while the Transports moved higher has to be taken into consideration. Any non-confirmation could lead to a major change in the trend.
The Industrials now need to stay above either the 10,368.83 or 10,296.84 while at the same time going above 10,402.34 in order to confirm the Transports’ move higher today. Alternatively, if the Industrials break down from here, falling below the 50% and rally peaks, then the Transports should follow in a similar fashion.
It should be noted that the current market action is dancing around my calculations of 10,302 being the 50% level for the Dow Industrials peak of October 2007 and the trough of March 2009 as indicated in my May 2009 posting. It is not surprising that we’re witnessing listless market action at this time. Market participants large and small are deciding if they should capitulate to the trends since March 9, 2009 or get out at a theoretical break-even point. Remember, the 50% level of the previous decline is an approximation of the average price paid by a majority of the current market participants. Is there enough momentum to keep the market going higher? Since March 9, 2009 the Transports have told us the answer to this question. We’ll have to see if this continues to be the case going forward.
-Touc