Category Archives: Dow Theory

Dow Theory: Bear Market Downside Target

On August 2, 2011, we received what is widely understood to be a Dow Theory bear market indication. According to Dow Theory, a bear market indication shall remain in place until counteracted by a bullish indication. The middle ground, where there is not a new bear market confirmation nor a new bull market signal, is generally considered a range or a “line.”

On August 9, 2011, we presented what we believed to be bear market rally targets according to Dow Theory. In the comment section of that same article, we revised the bear market rally targets based on the low of the Dow Industrials set on August 10, 2011.

The first bear market rally target, which seems next to impossible for the Dow Industrials to stay above, is 11,416.80. This level was only the first of five upside targets that would need to be breached for any prospect that a renewed cyclical bull market is in the works.

A confirmation of the bear market would be signaled if the Dow Industrials and Dow Transports were to fall below 10,719.94 and 4,149.94, respectively.

According to Dow Theory, we are still in a bear market and the early unconfirmed indications are that we may be headed to the 9,686.48 level.

Dow Theory: Bear Market Remains as INDPRO Surges

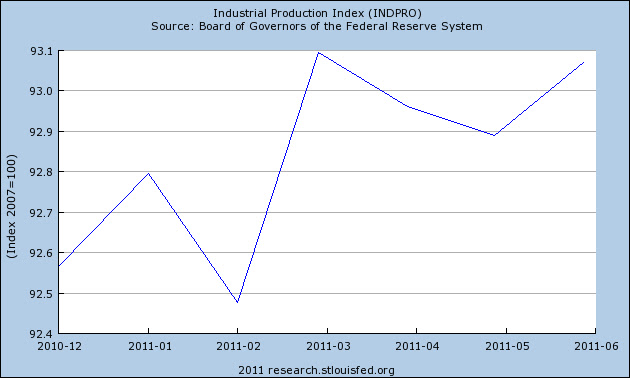
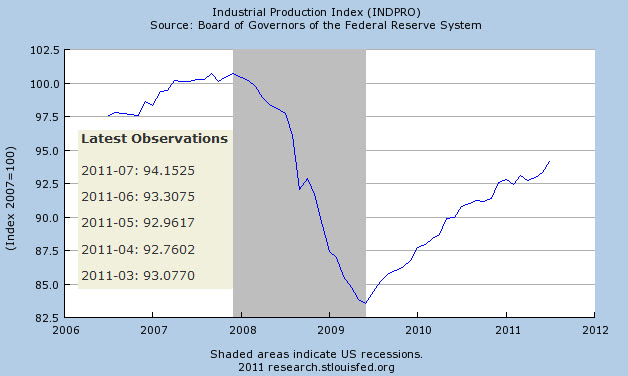
On Tuesday August 16th, it was reported that the current unadjusted Industrial Production Index (INDPRO) rose to 94.1525 for the month of July from the June level of 93.3075 which exceeded the March 2011 unadjusted high of 93.0943 (adj. 93.0770).  We'll have to watch closely in the coming months to determine if the INDPRO tops out with the July or August figures.
In our recent Dow Theory analysis of August 2, 2011, we indicated that we'd be surprised at an INDPRO figure that was above the March 2011 level.  As new information has come in (i.e. government revisions of the data) it appears that we have to allow for some time to pass before the stats are "finalized." We'll definitely provide updates as the revised data presents solid indications on the direction of the economy or confirmation of Dow Theory.
So far, the market still retains the Dow Theory bear market indication.  Additionally, there continues to be resistance, on the part of the Dow Jones Industrial Average, to convincingly close above the  first bear market rally target of 11,416.80.  We don't believe that it is advisable to take on new positions unless they are considered speculative in nature, which means that you're willing to accept all losses.
With a new cyclical bull market initiated when the Dow Jones Industrial Average and Dow Jones Transportation Average go above their respective highs for 2011, the missed opportunity for investment gains on new purchases between now and then are worthwhile.  When the next bull market indication is provided, our Dividend and Nasdaq 100 watch lists will point you to ideal investment candidates at reasonable values.  
Please consider donating to the New Low Observer. Thank you.

2 Years of Profitable Dow Theory Analysis

Below are the articles that take you from the beginning of a cyclical bull market indication starting on July 24, 2009 to a bear market indication on August 2, 2011.  Although it is possible to have a change from the current bear market indication to a bull market indication at a moments notice, we're willing to submit that an uninterrrupted bull market indication in a two year period within a secular bear market has yielded the intended results.  In some instances, these articles can be found on Seeking Alpha.com (found here) with added commentary from those who had questions about the concepts or ideas on the topic of Dow Theory.


Date Article Title Topic
8/2/2011 Dow Theory: August 2, 2011 A new bear market begins, bull market ends
6/30/2011 Waiting for Confirmation Bull market confirmation, next target Apr & May high
6/24/2011 Dow Theory: Price and Values Values, price, seeking fair profits
6/13/2011 Russell: Wrong about the Industrial Production Index Industrial Production: 1929 and today
5/4/2011 Price Decline equals Dividends Canceled Values, dividends, fair profit
4/6/2011 Richard Russell's Miscue Russell says 2007-2009 was not bear market
4/6/2011 Dow Theory: Cyclical Bull Market Confirmed cyclical bull market confirmation
2/14/2011 Dow Theory: Continuation of Bull Market Confirmed cyclical bull market confirmation
11/8/2010 Dow Theory Q&A Primary trends, confirmations, S&P in Dow Theory
11/7/2010 A Lesson In Dow Theory When to buy, sell, and wait for confirmation
11/4/2010 Dow Theory: Continuation of Bull Market Confirmed cyclical bull market confirmation
9/25/2010 Seeking Ten Percent Seeking pair profits
9/8/2010 Dow Theory: The Formation of a Line Lines
8/5/2010 Dow Theory, Stock Markets and Economic Forecasting Economic forecasting, stock markets
6/30/2010 Dow Theory Bear market non-confirmation
5/13/2010 Dow Theory Secondary reactions
4/13/2010 Dow Theory Q&A When to sell; asset allocation
4/11/2010 Dow Theory cyclical bull market confirmation
3/23/2010 Dow Theory cyclical bull market confirmation
2/23/2010 Dow Theory Q&A Manipulation; Averages discount everything
2/22/2010 Dow Theory 50% principle
1/24/2010 Dow Theory Downside targets
1/19/2010 Dow Theory on Fair Value Values and Price
1/10/2010 Dow Theory confirmation; line; 50% principle
9/24/2009 Dow Theory retest recent lows; going higher
9/2/2009 Dow Theory Double tops and Double bottoms
8/25/2009 Dow Theory Russell changes from bear to bull
8/24/2009 Dow Theory possible non-confirmation
7/24/2009 Dow Theory a new bull market begins, bear market ends
We hope you have profited from our analysis and  enjoyed our contributions to the topic of Dow Theory.
Please consider donating to the New Low Observer. Thank you.

Bear Market Rally Targets

Now that a bottom has been established, within the context of a bear market, we can calculate the bear market rally targets according to Dow Theory.  The upside targets are:
  • 11,527.87
  • 11.767.18
  • 12,073.49
  • 12,724.41
  • 12,807.51
A new bull market would be considered when the Dow Industrials and Dow Transports jointly exceed the prior highs set in May 2011, respectively.
 
Please consider donating to the New Low Observer. Thank you.

Dow Theory: Q&A

A reader has asked, “if the bear market is confirmed, do you see a possible longer term test of the lows from ’08 [2009]?”
This question is predicated on the fact that the Dow Jones Industrial Average confirms the March low as the Transports plumbed both the June and March lows. Dow Theory relies heavily on confirmations of the two key indexes and without such there is no theory.
In addition, we’ve included Robert Rhea’s use of the Industrial Production Index as an indicator to watch for. If the Industrial Production Index exceeds the prior high while the Dow Industrials fail to decline below the March low then we’ll be in a no-man’s land, which would require that the Dow Industrials and Transports exceed the May high to get a change from the current bearish condition.
From a Dow Theory perspective, the downside target relies heavily on the concept of the 50% principle. Although mistakenly attributed to E. George Schaefer by Richard Russell, the 50% principle is derived from Charles H. Dow’s “great law of action and reaction.” Dow describes the “law” in the following manner:
“The market is always responsive to the great law of action and reaction. The longer the swing one way the longer it will be the other. One of the best general rules in speculation is the theory that reaction in an advance or a decline will be at least one-half of the primary movement [50% principle].
“The fact that the law is working through short ranges and long ones at the same time makes it impossible to tell with certainty what any particular swing may do; but for practical purposes, it is not infrequently wise to believe that when a stock has risen 10 points, and as a result of one or two short swings [double tops] does not go above the high point, but rather recedes from it, that it will gradually work off 4 or 5 points.[1]”
In another excerpt from Dow’s work, on the topic of the 50% principle, Dow says:
“It often happens that the secondary movement in a market amounts to 3/8 to ½ of the primary movement.[2]”
Again, Dow emphasis the concept of the 50% principle:
“Whoever will study our averages, as given in the Journal for years past, will see how uniformly periods of advance have been followed by periods of decline, amounting in a large proportion of cases to from one-third to one-half of the rise. [3]”
Finally, George Bishop, one of the greatest authors on the topic of Charles H. Dow, concludes:
“The law of action and reaction applies to both the general market and to individual stocks. This law states that the reaction to an advance or decline will approximate half the original movement.[4]”
As far as we know, the concept of applying what is commonly known as fibonacci numbers to indexes and individual stock prices was never published before Dow’s time and yet Dow is often quoted offering up such indications in the Wall Street Journal. So pervasively is the “law of action and reaction” applied to stocks that free online stock charting software allows an investor to automatically indicate the fibonacci numbers with little reference to Dow’s use of such parameters for declines or increases from a primary trend.
Based on the chart above, the 50% principle, or law of action and reaction, indicates that the next downside target at 38% is 10,417 and at 50% is 9,679. We first must reach these downside targets in order to then project the next stage of the decline.
While we believe that a fibonacci 5th wave is possible, meaning that the index could fall below the prior low of March 2009, we have seen that this type of action can be deceptive and costly to those who gamble big in the belief that the low of the 5th wave will be substantially lower than 6440. We covered this topic in an October 16, 2009 article titled “Stock Market Projections”:
“The second type of market low is based on the premise that the Dow fulfills the Wave principle and falls below the upward trending line (red) to the old support level 8100 and then 6440. A true Wave move down to the old low would bring the market below 6440. However, the last time this was fulfilled, in the period from 1970 to 1974, the market only fell 8.5% below the previous low of 631.16 on the Dow Industrials in 1970. Additionally, the Industrials ran up from 631.16 in 1970 to 1051.70 in 1973, an increase of 118% of the previous peak. As more time passes I expect the index to fall to 5474 if we do manage to complete a Wave formation on the downside.”
The prior piece suggests that anything is possible between the point where we are and the point we expect to be going towards. Our personal investing experience as demonstrated by our claim of 40% gains (going long only) from January 2008 to August 2008 and closing out 2008 with +14% gains suggests that getting out of the market entirely is not exactly the solution to a bear market signal. Charles Dow has commented on this matter:
"Even in a bear market, this method of trading will usually be found safe, although the profits taken should be less because of the liability of weak spots breaking out and checking the general rise.[5]"
Finally, we do need to emphasis that our analysis of the market is subject to change as conditions change. After the very first Dow Theory bull market indication in July of 2009, we have had to continually update the status of the indexes based on all significant and indications. Since that time, we’ve issued more than ten confirmations that the trend was bullish.
Likewise, we will have to revisit our August 2nd call with relevant updates that support or change our view. For now, the market bias is definitely bearish and would require both the Dow Industrials and Dow Transports to exceed the previous May 2011 highs to change our current view.
Citations:
[1] Dow, Charles H. Wall Street Journal. October 19, 1900.
[1] Bishop, George. Charles H. Dow and the Dow Theory. Appleton-Century-Crofts. New York. 1960. page 119.

[1] Sether, Laura. Dow Theory Unplugged. W&A Publishing. 2009. page 112.
[2] Dow, Charles H. Wall Street Journal. January 22, 1901.
[2] Bishop, George. Charles H. Dow and the Dow Theory. Appleton-Century-Crofts. New York. 1960. page 120.
[2] Sether, Laura. Dow Theory Unplugged. W&A Publishing. 2009. page 117.
[3] Dow, Charles H. Wall Street Journal. January 30, 1901

[3] Bishop, George. Charles H. Dow and the Dow Theory. Appleton-Century-Crofts. New York. 1960. page 120.
[3] Sether, Laura. Dow Theory Unplugged. W&A Publishing. 2009. page 199.
[4] Bishop, George. Charles H. Dow and the Dow Theory. Appleton-Century-Crofts. New York. 1960. page 231.
[5] Schultz, Harry D. A Treasury of Wall Street Wisdom. Investors' Press. (New Jersey, 1966). p. 12. Additional commentary here.

Please consider donating to the New Low Observer. Thank you.

Dow Theory: August 2, 2011

In a first since the bear market bottom of March 9, 2009 and the bull market indication that initiated the New Low Observer on July 24, 2009, the Dow Jones Industrial Average and the Dow Jones Transportation Average has signaled the beginning of a bear market.


The last confirmation of the bull market that we received was on April 6, 2011. At that time we suggested that the market, as a leading indicator for the economy would continue to rise for “…at least for the next month and a half….” As far as the market is concerned, the top came in early May.


Almost as a total shock to some, the announcement of the extension of the debt ceiling didn't help the market in the least. In fact, one could have applied the adage “buy the rumor (of a deal), and sell the news.”


Today, the Dow indexes continued to slump and ended the day down more than 2%. While we would look for a breach of the June 2011 low to be a key indicator of the bearish trend, we’re primarily focused on the March 2011 low to be the most revealing level. The charts below graphically make clear what may become the trend for the market over the next several months.


Starting back in May 2011, both indices had risen to the high then retraced (secondary reaction) in June before heading higher. The Transports took off and broke above the May high hitting 5,618 (point A1). The Industrial, however, failed to confirm by going to a new high and reached only 12,724 (point A2). This first non-confirmation was a definite sign of bearishness, although it did not signal a bear market had begun.


As our April 6, 2011 Dow Theory article indicated, “What we see from the Transports on the way up we may also see on the way down.” Today was no exception to that idea. The Transports didn’t bother falling to the prior secondary reaction levels set in June, instead it plummeted past the March 2011 low. Both the Industrials and the Transports closed the day lower than such key support as noted in point B. The Industrials closed slightly below at 11,866 (point B1) while the Transports tumbled to 4,942 (point B2).


What is most worrisome now is that the Transports have taken out both the June low and the March low of 4,950 as seen on the chart at point C2. The Industrial index may appear to have quite a distance to go, but our calculations reveal that it would take only 2.1% decline for the index to confirm the Transports (point C1) action. Confirmation of the March lows by the Dow Industrials would be a devastating signal for the stock market and economy going forward.


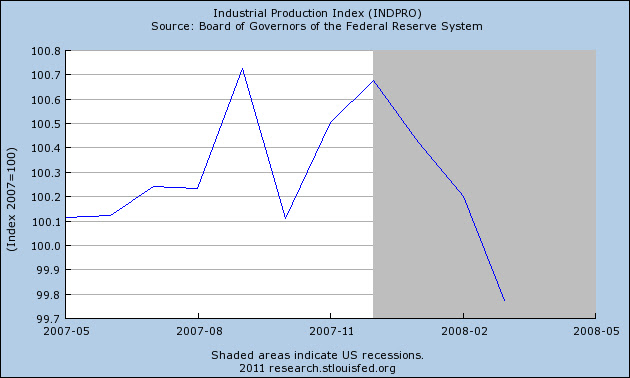
The characteristics of the market in the last several months is not unlike what was experienced back in November 2007 when Richard Russell wrote and excellent article on the bearish Dow Theory implications for Barron's (article here). The similarities between now and 2007 don’t end there. The charts of the Industrial Production Index (INDPRO) show a pattern of trying to achieve new highs in 2007 and the present but then failing.


The connection between the Industrial Production Index and Dow Theory is well established as put forth by the Dow Theorist Robert Rhea. Our last article (found here ) on the Industrial Production Index made clear the importance of considering the movements of this indicator.

We’d be jumping to conclusions if we went so far as to conclude that the July Industrial Production Index numbers would not exceed the March 2011 high of 93.0943. However, we would be surprised if the INDPRO, despite already being so close to the high, manages to go above the numbers that were set in June and March 2011.

The caveat to our analysis on the Dow Industrials and Dow Transports is the possibility that the Industrials actually don’t go below the low set in March 2011 (considered a divergence or non-confirmation of the trend). If the Dow Industrials do not confirm the same lows as the Transports then we’d essentially be in a Dow Theory no-man’s land. Under such conditions, the bias should be towards being bearish but on a wait and see basis.

Please consider donating to the New Low Observer. Thank you.

Dow Theory: Waiting for Confirmation

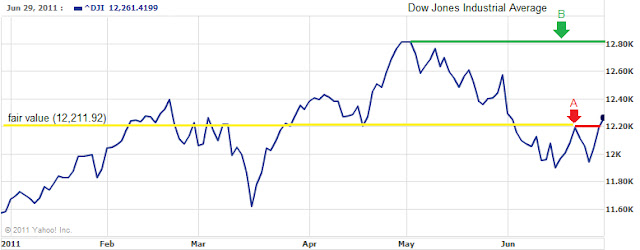
Recent activity in the Dow Jones Industrial Average (DJIA) has given favorable indications that we may reach a confirmation of the bullish trend that has been established since July 2009. Below is a chart of the DJIA for the last six months.
On the DJIA chart are several characteristics worth noting. First, and what we believe to be the most important, is the ability for the DJIA to break above the fair value level (yellow line). The fair value level, also referred as the 50% principal, indicates where a majority of investors in the index of stocks are at a break-even point with their investment.

Next is the unconfirmed bull market indication at point A (red line). Occurring at the same time that the DJIA is above the fair value level is the fact that the index broke above point A (red line) which indicates whether or not there is any conviction in the market to go higher. For the time being, there is plenty of conviction in the market as represented in the consecutive triple digit gains that have been posted despite the worrisome foreign and domestic economic news.

There are a couple of important points to highlight about the two positives that have been mentioned. First is the often misinterpreted view by some Dow Theorists to accept that if the price of the DJIA goes above point A (red line), then we’re in a confirmed bull market. In fact, this indication, going above point A, is only telling us that the next target for the index is to the previous high (point B; green line) and the trend is bullish. The market still has the opportunity to get a non-confirmation by either the Dow Jones Transportation Average or the Dow Jones Industrial Average not advancing to a new high (point B; green line). Lack of a confirmation from either index could weigh heavily on the prospects of a market advance.

The next issue dovetails with the first. By going above the fair value plane, it could be interpreted that the market, on a short-term basis, is overvalued. Not only could the market be considered to be overvalued, we could also consider that there is a built-in upper limit for the market. Many investors could interpret the prior high (point B; green line) for the DJIA to be as much risk, in a 2-year doubling of the market, as they’re willing to accept.

Each of these concerns are at play when new information comes in that implies risk is being added to the market. The problems with Greece, US deficit and debt, municipal default, inflation in China, and nuclear threat to Japan are already factored in for the next 3-9 months. There has to be a new twist on the current themes or a black swan event, something that no one has considered, to change the current message of the market.

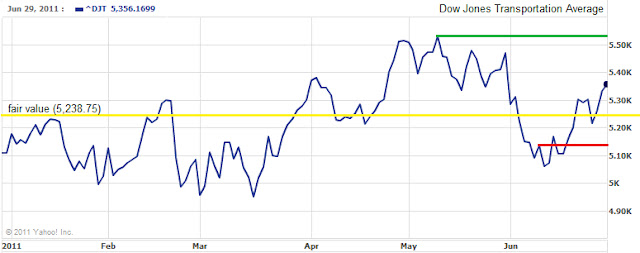
As a follow up to prior commentary on Dow Theory, the DJTA continues to lead the way higher. In this case, the Transports fell the most (-8.45% v. –7.11%) from the peak in May and the DJTA recovered the most (+7.18% v. +4.35%). We continue to keep a watchful eye on the Dow Jones Transportation Average for any early indications of market direction (chart below).

Our best guess is that the upside prospects are for the DJIA and DJTA to go back to their respective highs set on April 29th and May 10th. Between now and then, investors should remain focused on our Dividend and Nasdaq 100 watch lists for new opportunities with companies that are undervalued and good long-term investments.
  • This is a follow-up to our last Dow Theory market call on April 4, 2011

Please consider donating to the New Low Observer. Thank you.

Richard Russell Review: Wrong About the Industrial Production Index

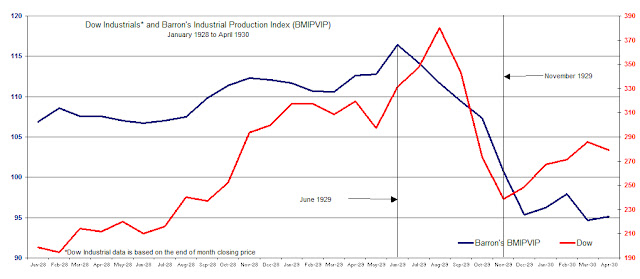
On June 6th, Richard Russell wrote an article on the Financial Sense website titled “Are We Fated to Live 1929-1930 All Over Again?” In that article, Russell discussed the Barron’s Monthly Index of Physical Volume of Industrial Production [BMIPVIP] reflecting on the movements of the index as compared to the Dow Jones Industrial Average in the period from the peak of the stock market in 1929 to the bottom in 1932.

Richard Russell pointed out that from November 1929 Barron’s Monthly Index of Physical Volume of Industrial Production [BMIPVIP] gave ample warning that the direction of the U.S. economy was still headed lower despite the rebound of the Dow Jones Industrial Average from November 1929 to April 1930 as depicted in the chart below.

Source: Persons, Warren. Barron's. May 15, 1933; pg. 18
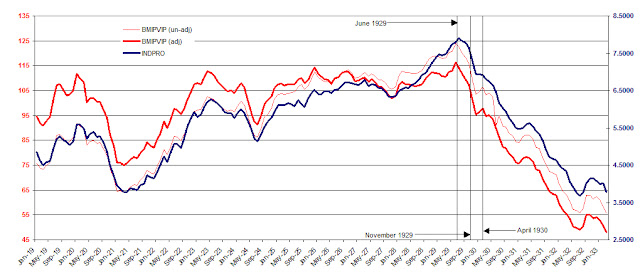
Because the BMIPVIP was discontinued in 1938, we’ve used the closest approximation which is the Federal Reserve’s Industrial Production Index (INDPRO) found at the St. Louis Federal Reserve website.  In order to make a comparison to the two indexes, we checked the performance of the INDPRO to the BMIPVIP.  Below is the chart of the Barron’s adjusted and unadjusted BMIPVIP index and the Federal Reserve’s INDPRO from 1919 to 1933.

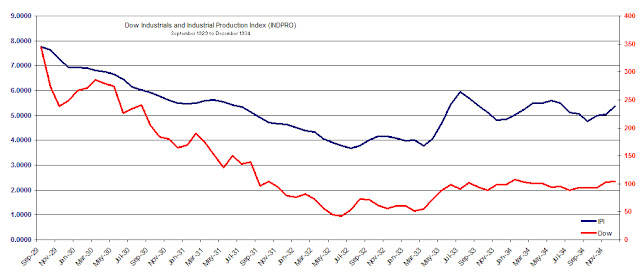
 It can clearly be seen that the Federal Reserve’s index (INDPRO), which is still in use today, can be used to measure against the Dow Jones Industrial Average.  Whenever the Barron’s index zigged the Fed’s index zigged, whenever the Barron’s index zagged so too did the Fed’s index.  We believe that using the Fed’s Industrial Production Index is the best and most consistent approximation to compare to 1929 to 1934 (shown below) as well as today’s market.

source: Person, Warren. Barron's. May 15, 1933. pg. 18.


According to Russell, the BMIPVIP hit its high in the month of June 1929.  This was a full 3 months before the peak in the Dow Industrials in September 1929.  The Federal Reserve index actually peak in July 1929 however, this was still ample enough time to gain inferences from the index’s movement.

Russell correctly observed that the BMIPVIP was critical in the evaluation of whether or not the economy and the stock market were on a rebound.  The great Dow Theorist Robert Rhea first introduced the use of Barron’s Industrial Production Index in his book Dow’s Theory Applied to Business and Banking.  Rhea used BMIPVIP as a means to confirm the signal provided by Dow Theory which contributed to his accurate call of a market bottom in July 1932.

Richard Russell’s point was that even though the stock market rallied strongly after the initial crash from the September 1929 high to the November 1929 low, the subsequent rebound was unsustainable when viewed from the perspective of the BMIPVIP or the INDPRO.  Unfortunately for Russell, his analysis of the BMIPVIP index and the Dow Jones Industrial Average comes to the wrong conclusion when attempting to bring actions of the past to market activity of the present.

Russell closes his article with the following thoughts:

“After April 1930, the post-crash rally ended, and a great bear market began. As the market turned down again, the US economy crumbled. By July 1930, Barron's Index of Industrial Activity had fallen to 85.5. The Great Depression was on.

“And I'm wondering about the comparison with today's action. Recently, we've seen the Dow climbing steadily from its March 2009 low, all the while with the economy neutral to weak. Then we see the Dow hitting a high last month in May with business today sluggish and even weaker than it was in January.

“And I'm wondering, ‘Are we fated to live 1929-1930 all over again?’ Is the stock market rally of March 2009 to May 2011 a repeat of the stock market rally of November 1929 to April 1930? In both instances, business weakened as the market climbed higher.

“But the scary part is that in 1930 when the Dow broke support, the Great Depression began and Barron's Business Index continued to plunge. Let's keep an eye on the March 2011 lows -- Dow......11613.30 and Transports ....4950.17.”

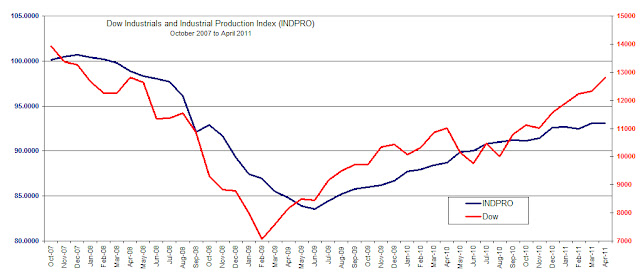
We’re disappointed that Russell’s remarks are uninformed and misleading with the intent of creating fear. First, Russell withholds the data necessary to test whether his assessment is accurate. Next, Russell implies that the Dow Industrials of today may be rising in spite of the Industrial Production Index falling. However, the Fed’s INDPRO has been in perfect alignment with the rise of the Industrial Average since 2007 as shown in the chart below.

Finally, Russell closes his article with an attempt at drawing the events of the past to the present.  Russell's effort lacks all substance when he speaks of targets for the Dow Industrials to watch for but doesn't introduce the Industrial Production Index nor it's relationship to 1929 and today. 

While the true test may come when the Dow Industrials and Industrial Production Index (INDPRO) attempt to exceed the prior high of 2007, there is little indication that Russell’s assessment is correct.

Please consider donating to the New Low Observer. Thank you.

iShares Silver Trust (SLV) Debrief

On April 14, 2011, we provided what we believed to be the downside target for the Philadelphia Gold and Silver Index (XAU) in anticipation of the current decline that is taking place using Edson Gould’s speed resistance lines (article here).  Although appearing to be very similar, there is a distinct difference between Gould’s resistance lines and Charles Dow’s 1/3 support levels.  Gould’s lines have support levels based on 1/3 of high while Dow’s support levels are based on 1/3 the difference between the prior bottom and the most recent high.


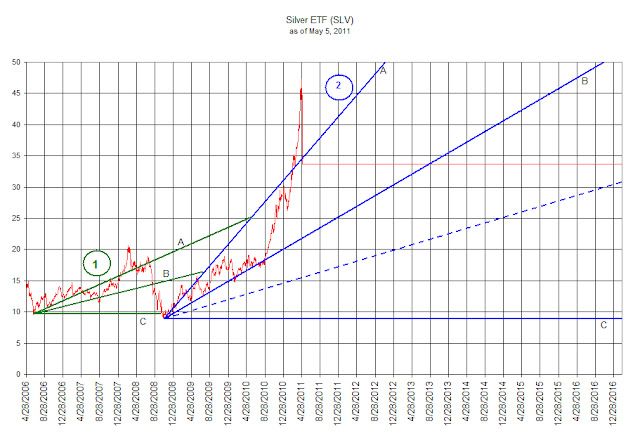
In this review we’re going to tackle the trading pattern of the very controversial iShares Silver Trust (SLV). In the chart below we have drawn the Dow Theory support levels where the price of iShares Silver Trust (SLV) is likely to revert to as part of a normal reaction.  As a point of clarification, according to Dow Theory, a bear market does not begin until the index or stock falls by at least 1/3 of the prior rise.  In the case of (SLV), today’s closing price at $33.72 heralds what is sufficiently below the first support $34.52 and should be considered to be a bear market. 


Although this could be considered a bear market based on Dow Theory, we only need to look back to 2008 to know how quickly and viciously a bear market in precious metals can begin and end.  The precious metals bear market of 2008 crushed the XAU gold and silver stock index with a 68% decline in eight months.  During the same time, the iShares Silver Trust (SLV) declined slightly more that 55%.  


Bear market or not, some observations are worth considering.  First, in the chart below, the overall pattern of the price decline in (SLV) for the Dow Theory indication numbered 1 (in green) is very similar to the current decline represented with the Dow Theory indication numbered 2 (in blue).  Since Dow Theory works on a relative basis, once initiated at a major low, the signals provided are not confused through the distortions of large or small numbers.  Headlines about SLV having declines of historic proportions are grossly exaggerated if there is no comparison on a percentage basis and compared to prior declines.

Second, at the beginning of each run at point 1 and 2, the price of SLV bounced off of the middle line B (also known as the 2/3 support line) before going parabolic. 

Finally, the decline from each peak was rapid and vicious.  One-third of the prior rise was wiped out in a matter of days after the peak.


What remains is a high level of uncertainty for (SLV) going forward.  However, in general, we should see SLV tread water for a brief period of time before falling back to the prior low which began with the current run back in November 2008.   Dow Theory suggests that a reasonable buying opportunity would exist at below line B (blue line B).  However, we wouldn’t jump in at the slightest move below line B.  Instead, we’d like to see the price decline to the dashed blue line at $15.41 or below.

Price Decline Equals Dividends Canceled

The question of retaining profits on quality dividend companies through the selling of a position seems to counter the whole point of dividend investing. After all, aren’t you supposed to allow the dividends to compound? In a small way, we described one approach and our rational for selling quality companies after small gains in yesterday’s article (Our Primary Concern: Retaining Profits).

However, there is another way to view the rationale behind selling a dividend stock after a “fair profit.”  In the early years of the Dow Theory Letters, Richard Russell would often cite a Robert Rhea quote about the impact of a stock decline.  Rhea said: 

“’Buying in bear markets is merely gambling and not very good gambling at that. Why not have cash instead of investments in bear markets? Why insist that one cannot afford to forego investment income when one day’s price shrinkage may cancel several years’ dividends?’”
Russell, Richard. Dow Theory Letter. May 10, 1960. Issue 103. page 2. www.dowtheoryletters.com.
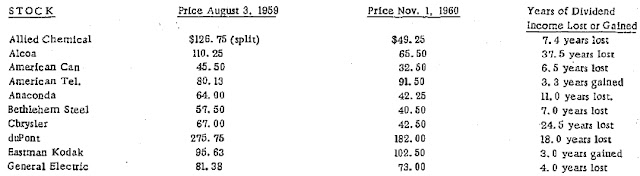
The idea of canceling several years of dividends is at the forefront of our thinking when gains evaporate into losses.  In Richard Russell’s Dow Theory Letter dated November 23, 1960, he presents, in literal terms, the impact of price decline and the loss of years of dividend income in the process.  The table below is from Russell’s newsletter and needs little in the way of explanation.
Source: Richard Russell, Dow Theory Letters, http://www.dowtheoryletters.com/

Because stocks are not required to return principal with a stated yield as with many bonds, there is no assurance that the price will recover to the level that a purchase was initiated. Therefore, receiving short-term income on a dividend stock, although a necessary source of income for retired individuals, the prospect exists that an investor could end up with only a portion of the principal instead of the intended income plus principal.

The lack of assurance of principal and income with dividend stocks is why we believe people have become disenfranchised with technology stocks like Microsoft (MSFT) and Cisco Systems (CSCO).  If they’ve invested in the stocks with the belief that they’re in it forever, when the decline comes, absent any dividend, there is little recourse or hope of recovering lost funds or keeping up with inflation.

Even new investors to Microsoft and Cisco Systems, aware of their bold promises in 1999 and subsequent failure to deliver in 2011, are asking themselves, “is it really worth facing the prospect of no return?”  These questions are being asked when in some instances, especially with Microsoft, the timing probably couldn’t be better (especially now that they’re paying a dividend).  Our supplementary comments on Microsoft can be found here.

While we subscribe to the Graham/Buffett principles of investing (buying for the long-term, you’re buying a business, concentrate on values, etc.) we assume that since there are only a handful of billionaires hewn strictly from investing in stocks, we might do well to hedge our thinking and strategy.

Finally, further analysis of Robert Rhea’s claim on not being invested at all during bear markets is something that is at odds with Charles Dow and we’ve decided is not appropriate or necessary.  From our experience, bear markets are no guarantee of losses in your portfolio.  Charles H. Dow, founder of the Wall Street Journal, has said that:

"Even in a bear market, this method of trading will usually be found safe, although the profits taken should be less because of the liability of weak spots breaking out and checking the general rise."

Schultz, Harry D., A Treasury of Wall Street Wisdom, Investors' Press, (New Jersey, 1966). p. 12. Additional commentary here.

Evidence of the fact that bear markets don’t always equal destruction of wealth, while going long stocks, is demonstrated in our 2007, 2008 and 2009 performance review.  Naturally, 2008 is not expected to be replicated (having gains, while going long only, during a market decline of 40% or more).  However, we do know that being all in or timing the market to be all out during bear markets shouldn’t be the goal.  The goal, from our perspective, should be the preservation of gains whenever possible.

Please revisit New Low Observer for edits and revisions to this post.

Richard Russell’s Miscue

On the Dow Theory Letters (http://www.dowtheoryletters.com/) site yesterday, there was an interesting admission by Richard Russell. Russell said:
“I mistakenly took the vicious decline of 2007 to 2009 as a turn in the tide and a bear market.”
This comes as a shock since most market veterans would say that when almost every market, foreign and domestic, declines by 30% or more then it would be sufficient to label it as a bear market. When the gold stock index (XAU) declines 62% along with almost all other commodity indexes then a reasonable person, lacking any other term for it, would call that a bear market.
Instead of being a bear market, according to Russell, the decline from 2007 to 2009 was simply a “…correction in an ongoing bull market.” As I attempted to process this thought, I only wonder what Russell would re-characterize the stock market decline in Japan (from the 38,000 to 8,000 level) as. Dow theorists like Hamilton, Rhea and many others are very clear on what constitutes a bear market. Russell’s assertion that 2007 to 2009 was simply a “correction” was in complete contradiction to his prescient call of an eminent bear market in Barron’s in November 2007. Nor does Russell’s latest missive add credibility to his prior claims that the rise in the market from the 2003 low was a bear market rally.
To top off Richard Russell’s wild claim that a year and a half decline of over 40% in global equity price was only a “correction” is the fact that he omitted any reference to Dow Theory having any role in his sudden realization that he was wrong about his belief that we were only in a correction rather than a bear market. Russell credited his not so secret Primary Trend Indicator, Lowry’s Selling Pressure Index and Lowry’s Buying Power Index. Apparently, Dow Theory plays a small or non-existent role in a publication that is titled The Dow Theory Letters.
By inference, not crediting Dow Theory for his change in thinking suggests that Dow Theory doesn’t work. However, the NLO team has been adamant that up to this point, Dow Theory has indicated that we’re in a bull market and that a bear market has not been signaled since the July 23, 2009 bull market indication. This is in stark contrast to Russell’s back and forth calls of a bull and bear market as early as January 2009.
So what is Russell’s remedy for his error in judgment for the last 2 years? In today’s note (April 6, 2011) Russell says, “If this market is going to turn primary bearish, I would want to see an orthodox Dow Theory bear signal.” Wait a minute, as the market was rising Russell arbitrarily misapplied his version of Dow Theory and now he thinks that he’ll turn bearish when he receives “…an orthodox Dow Theory bear signal.”
As an attempt to salvage some sort of credibility Russell says, “In the meantime, all is not lost. Gold is at new highs as are the gold ETFs, and silver is at a 31-year high.” This comes after Russell said on March 1, 2011 that if the Dow Industrials fall below 11,800 then investors should sell all stocks “including gold stocks." Well, on March 16, 2011, the Dow fell to 11,600 leaving anyone who believed Russell’s commentary on March 1, 2011 in the lurch.
The NLO team is disappointed since Richard Russell has been the primary inspiration for our work in Dow Theory and critically analyzing financial markets. In addition, we’d rather have Russell retire as a legend with a legacy that will continue to inspire. However, Russell’s latest work comes off as sloppy and requires significant willingness to view his work as entertainment, at best.
 
Please revisit New Low Observer for edits and revisions to this post. Email us.

Dow Theory: Cyclical Bull Market Confirmed

On April 4, 2011, we were provided with a Dow Theory confirmation of the cyclical bull market, within a secular bear market, when the Dow Jones Industrial Average exceeded the prior peak of 12,391.25 set on February 18, 2011.
As has been the case throughout this bull market run, the Transportation Average has taken the lead on the way up. This most recent move by the Industrial Average only confirms what the Dow Jones Transportation Average managed to accomplish on March 31, 2011 by closing at 5,299.89. At least for the next month and a half, the economy is expected to continue to grow. What we see from the Transports on the way up we may also see on the way down.

What do the new short-term highs mean for the market overall? It appears to indicate that the Dow Industrials will continue to stagger towards the old high that was established October 9, 2007 at 14,164. For us, a possible leading indicator for the market (even before the Transports) is the price of gold and silver. If precious metals can continue to rise then the Dow has a more favorable chance of rising. However, if precious metals are falling then, in this stage of the interest rate cycle, the general market will have little chance of going up.

According to Dow Theory, all technical indications in the stock market should translate into the economy. Dow Theory was never intended to predict the stock market. Instead, Dow Theory was intended to determine if the prospects for the economy were favorable or not, using the stock market as a leading indicator. The best example of this is in Robert Rhea’s easy to read book, The Dow Theory Applied to Business and Banking.

 
Please revisit New Low Observer for edits and revisions to this post. Email us.

Dow Theory: Continuation of Bull Market Confirmed

On Friday February 11, 2011, The Dow Jones Industrial Average (DIA) and the Dow Jones Transportation Average (IYT) registered Dow Theory bull market confirmations. This confirmation is a continuation of the first bull market indication that was given on July 23, 2009.

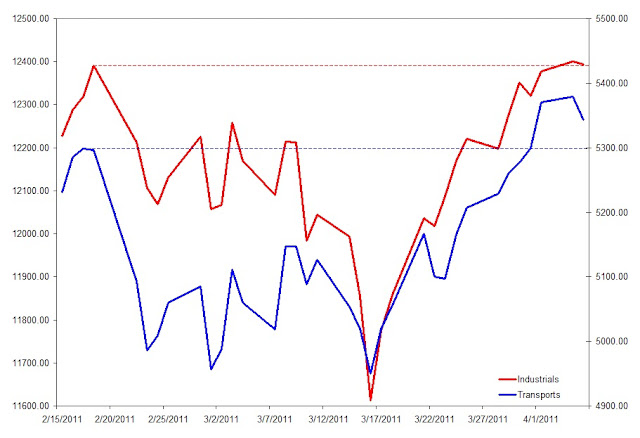
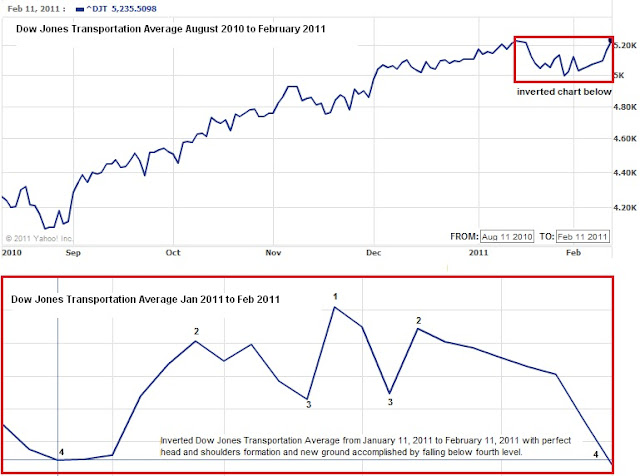
The majority of the Dow Theory bull market confirmations since July 2009 has hinged on the movement of the Transportation Average and this most recent indication has been no exception. In accomplishing the Dow Theory confirmation of the bull market, the Transportation Average had to overcome significant technical resistance. In the chart below, you will see that the decline and recovery in the last month has been dramatic.

Over the last month, the Transportation Average has managed to succumb to an inverted head-and-shoulders pattern. This suggest that there is strength in the rise of the Industrials and Transports most recent bull market confirmation since, as the chart below demonstrates, the Industrial Average never let on that there was any weakness to the same extent that the Transports did.

In the last Dow Theory confirmation of the bull market on November 3, 2010 (article here), the Dow Industrials fell about 2% (on a closing basis) over a period of 29 days before regaining its footing and heading to the current level. From the November 3, 2010, it took 101 days for the Dow Industrials to rise 9.44% and the Dow Transports to rise 7.69%.

Looking ahead, if the markets were to replicate the prior modest moves in the same period of time then we could expect an intermediate low around March 11, 2011 with the Industrials and Transports peaking at 13,431.86 and 5638.12 on May 22, 2011, respectively. Our recent article on where the market might top (article here) indicated that June 18, 2011 is the farthest out we could project on a cycle basis. We now have refined this assessment down to between May 22nd and June 18th.

It would be exceptional if the market could accomplish the 13,000 level given the current valuation and the uninterrupted (no Dow Theory bear market indications) run we’ve had since the first Dow Theory bull market indication on July 23, 2009. Achieving 13,000 is only 6% away however, what is more important is sustaining the momentum.

Naturally, the alternative to this optimistic market forecast is that the Industrials and the Transports give a bear market signal somewhere between May 22nd and June 18th. Simultaneously falling below 9,700 for the Industrials and 3,900 on the Transports would indicated that a new bear market has begun. Until then, we can look forward to modest gains and nearly full exposure to the stock market for the next 2-4 months.

Market Review and Analysis

As the Dow Jones Industrial Average (DIA) approaches the 12,000 level, we believe it is necessary to review our analysis leading up to this point. There have been indications that the market would knock on the door of 12,000. And we’ve been at the forefront of this analysis very early on.
Starting as early as February 12, 2009 (article here), we warned that despite the declining trend in the markets, history has proven that declines of 40% or more tend to retrace 60% to 100% of the previous decline.
In September 2009, after reviewing the Coppock Curve (article here), we pointed out that if the market held up in October 2009 that 12,000 on the Dow would not be an unrealistic price target.
In January 2010, we mistakenly thought that the Dow had a good chance to reach 12,000 by February 2010 (article here). Although we were woefully inaccurate in the timing of our estimate, we were convinced that 12,000 as an upside target was not unreasonable.
On March 23, 2010, we came out with an article that highlighted what we thought was confirmation of a cycle low in the market on February 8th (article here). In retrospect, although it was a major low for the year 2010, it was not as significant as the July 2010 low. However, we reiterated 12,000 as the target for the Dow.
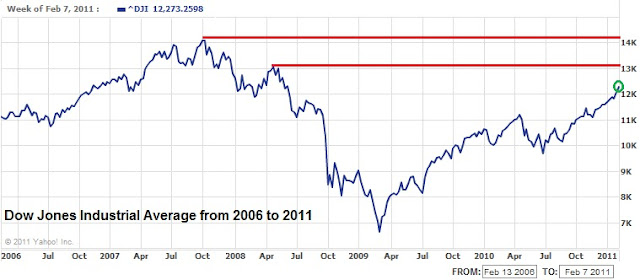
Our eyes are now trained on the next target for the market. This is where our “analysis” is put to the test. All along we’ve thought that a rise from 6,400 to 12,000 would not be very unusual. However, getting back to even, or 14,164, will be very challenging. There are many who feel that external forces have falsified the markets rise.
As far as we’re concerned, we’ve accomplished the target that was long since projected and is now upon us. As we’ve indicated in a recent article, the Dow Industrials’ upward trend has less to do with the actions of the Federal Reserve and more to do with the corrective nature of markets after a significant plunge like in the period from October 2007 to March 2009 (article here).
We’ve noted in the article titled “Diversification Doesn’t Matter” that declines in the Dow will be amplified in the S&P 500 and Nasdaq Composite Index (article here). Exposure to these diversified indexes through the use of index funds and ETFs will result in surprising losses that defy the theory of diversification as was the case in 2008.
We believe that as long as the price of gold keeps moving higher in conjunction with the Philadelphia Gold and Silver Index (XAU) and Dow Theory confirmations of the bullish trend continue, there is a good chance that the market will retrace 100% of the previous decline from 2007 to 2009. At times like these, the rise and fall of the price of gold may be a leading indicator for where the market might be headed. Our numerous articles on the correlation between gold and the stock market have proven to be correct for those willing to accept the data from an unemotional standpoint (article link).
Although it is not unusual for markets to retrace 100% of a prior decline of 40% or more, we’re more than willing to figuratively step aside and watch what happens next. However, we cannot help taking another stab at when, and not at what exact level, the Dow Industrials will peak. Two prior articles on the topic are the basis for our thoughts on the prospects for where the top may occur.
On June 14, 2010, we wrote an article titled, “A Market Cycle Worth Observing” (article here). In that article, we reminded readers of the consistency of 4-year cycles to provide key markers for tops and bottoms in the market. We included referenced from Charles H. Dow’s era, founder of the Wall Street Journal, from 1901 and prior. We gave examples as provide by Richard Russell from 1953 to 1979. We were even able to provide examples from the period between 1987 and 2009.
If there really are 4-year cycles, as we contend, then October 2007 would stand as the marker for the last peak in the cycle. In theory, the mid-point for the peak would be some point in 2009. For us, March 9, 2009 represents the low or mid-point for the 4-year cycle. Our estimate is that the full 4-year cycle should be completed with the Dow Jones Industrial Average peaking at some point in 2011.
According to Dow Theory, the downside target is set at 9,273.50. If this level is breached in conjunction with the Dow Transports, then we could consider a bear market has been initiated.
The second article that we derived our view of the market is dated April 11, 2010 on the topic of Dow Theory (located here). In that market analysis, we proposed, in addition to the fact that the Dow Industrials “…could go to 11,574.59 with no problem,” we outlined three hypothetical scenarios under which the Dow Industrials would reach 14,164.
In retrospect, and upon further analysis, we realized that those projections were really indications for when the market would top irrespective of the exact level that the top would occur. It seems to us that the period from January 31, 2011 to June 18, 2011 is the timeframe for when the completion of the cycle should take place.
Despite our concerns for an eminent top in the market, we will continue to buy and sell individual stocks. From our experience in 2008, gains can be obtained from individual stocks within the context of a declining trend in the market. In fact, during 2008 there were only three months where losses were registered which were June, October and November. Although these months incurred substantial losses, 2008 ended with overall gains of 14% in our portfolio (article link).


Please revisit New Low Observer for edits and revisions to this post. Email us.

Dow Theory Q&A

A reader comments on a prior thought:

1. Part of the confusion might be that Mr. Schannep gave a SELL signal on 30 Jun 10 -- that articlle of yours seems to have been published that very day, while the 2nd sentence implies that it was written the previous day. Therefore, the next signal would have to be BUY, which came 27 Sep 10.

Is it possible you missed the 30 Jun 10 signal?

Also, your 7 Nov 10 article implies a "bull market indication" on 24 Jun 09 -- I'm not sure what that means, but as a historical note, Schannep gave a BUY signal on 9 Apr 09.


2. Regarding Dow Theory analysis: At its simplest, my understanding is that a market move must meet rather basic criteria for time and distance, as noted on page 18 (examples follow) of the book, with caveats.

A secondary reaction move, after a primary market high or low must be about 3% -- enough to allow ONE index to recover at least 3%; ONE index -- but not both -- may exceed the previous high or low. It must take at least two weeks to reach that point, which sets a "mark" (peak or trough). After which, when BOTH indicies exceeds their "mark", there is a Dow Theory Signal -- a change in trend, turn of the tide, etc.

So, the market picture for 2010 was:

DJI: High on 26 Apr, reaction mark on 7 Jun, bounce on 18 Jun, SELL signal on 30 Jun.

DJT: High on 3 May, reaction mark on 7 Jun, bounce on 15 Jun, SELL signal 30 Jun.

I've omitted SPX, since you folks seem to be somewhat "purist". However, I might suggest a review of the Dow Theory section of "Technical Analysis of Stock Trends (9th Edition)", page 24 in particular. As the basis for Dow's Theory is market movement, it should be reflected in -- or at least agree with -- movement in such a large index. In addition, merely because it did not exist when Dow, Nelson, Hamilton or Rhea were alive does not merit exclusion from consideration. Deliberately ignoring it, as Russell and Moroney do, may be akin to using Ptolemy to critique Copernicus.

The previous caveats mentioned are threefold:

1. Schannep rigorously defines Bull and Bear markets as a 19% rise/16% drop from low/high (those are reciprocal) on page 86. Therefore, they serve as a "trailing stop", should Dow Theory not give a signal.

2. Schannep also defines "capitulation" on page 90 (10% drop below 10 week average) as a drop significant enough to warrant shortening the two-week timeframe to one week, for a BUY signal.

3. The bounce after a reaction must occur over more than one day; thus the 27 May 10 bounce was not valid.

Hope that is helpful.

Our Response:

It is definitely possible that we could have missed the June 30 sell signal.  However, Let us try to prove that our understanding of Dow Theory is correct.

First, there is the issue of the primary trend. No primary trend stops and then re-starts only two months apart. This goes back to the issue that you’ve mentioned about the timing of a call. Such a short period of time between bull or bear market calls is a tip-off that a false signal had to have been triggered on June 30, 2010. A review of the primary trend from Rhea, Hamilton, Nelson, Russell and Schaefer is in order on that point.


Second, Dow Theory is all about confirmations. No matter which source that is used, there was not a confirmation of the decline to the same supports levels in the Transportation and Industrial Averages for the Feb. 5th and Feb. 7th. This is very significant because the exact same confirmation of both the Industrials and Transports was used to re-issue a buy indication on November 3 by Mr. Schannep. Although it should be said that Mr. Schannep used the S&P and the Industrials which gave a “buy” only a couple days ahead of the standard Transports and Industrials signal. Was it worth the extra days advance notice? Absolutely, if you’re already out of the market. However, Hamilton, Rhea and Russell are very clear on the risk of jumping the gun on bull and bear market signals without accurate confirmation.

In our November 4th “analysis” we were specific in indicating that we chose to opt for the sure fire call instead of the earlier call on September 27th when the markets broke above the line. Again, if the call for a “buy” signal can wait 4.73% for the sure-fire confirmation of the bull market or “buy” signal then we’ll opt for the most conservative route.

The whole premise of Dow Theory is about following the steps as outlined by Nelson and further elaborated on by Hamilton and Rhea. When E. George Schaefer proposed the 50% principal, he didn’t create something that wasn’t already a part of Dow Theory. Schaefer only highlighted an aspect that others may have taken for granted or overlooked. Adding elements that didn’t exist may seem to bring the concept of Dow Theory out of the dark ages. However, there are specific aspects that Schannep has introduced that are not consistent with Dow Theory.

Third, the introduction of the S&P 500 as a valid index to track is erroneous in that it assumes that there is an advantage by introducing the index. Since the S&P 500 was created in 1957, all data prior to 1957 is modeled on a 100% correlation to the Dow Jones Industrial Average. This means that movement in the index would have mirrored the Dow industrials which is impossible now and therefore could not possibly happen before 1957. This means that all insightful examination of price movements of the S&P 500 before 1957 is useless.

There is evidence to suggest that in the period from 1929-1932, data from the Barron’s 50 index actually declined by only 78% instead of the Dow Industrials’ 89% reflecting that human judgment related to changed in the index impacted the outcome of the decline. Without the S&P 500 being in existence at the time there is no way to test this theory. We covered the topic of changes Dow Industrial Average and their impact from 1929 to 1932 in our article titled “Dow Jones’ Decline Largely Impacted by Index Changes” and “After the Crash of 1929, Recovery was Quick.”

In addition, the current beta on the movement between the Dow Industrials and S&P 500 is only occasionally at 1 or 99.9% correlated. In any instance that there isn’t a correlation it is in the favor of the Industrials. This defies logic since any index of stocks with only 30 companies should fall by a greater magnitude and rise by a greater magnitude than an index of 500 companies. If you use the Yahoo!Finance interactive charting, you will find that during almost any period since 1970, the Dow Industrials fell less than, and rose more than, the S&P 500. Although this isn’t true for every period it is true for the majority (80/20) of periods selected especially if you pick periods further out in time to the present. This means that signals gained by one index will not be the same with another index.

We’ve already shown that there is a problem with the belief that a broader index provides more accuracy and stability in the markets in our article titled “Diversification Doesn’t Matter.” In fact, we’ve done a recent update on this data and have found that the Dow Industrials have exceed the performance of the S&P 500 in the 5-year, 3-year, 1-year, and YTD categories. In addition, the 2008 performance of the Dow Industrials fell less than the S&P 500 which defies the point of having a diversified index.

The net result of sticking to an index that existed over an extended period of time is that people of today can test the validity of the claims made by Dow Theorists in the past. If we cannot test the theory on a continuous index then we would not be able to prove or disprove the accuracy of the claims. Being able to prove the claims of people in far flung eras allow for us to give credence to the facts.

Our next issue is the introduction of Edwards and McGee’s classic book Technical Analysis of Stock Trends (9th edition). The use of such a source is unfortunate since it is not the source. The source for Dow Theory is from books published by Russell, Schaefer, Greiner, Shumate, Fritz, Dow, Nelson, Hamilton, Rhea, Olmerod, Collins and Raeder. All of the aforementioned are Dow Theorists first. Although a great book, Technical Analysis of Stock Trends is not an authoritative source for considered understanding on Dow Theory even though they correctly say that "...Dow Theory is the granddaddy of all technical market studies."

Schannep’s definitions of a bull and bear market and the parameters that are set around such definitions are probably useful and profitable. However, it is probable that we’re talking about Schannep’s theory instead of Dow’s theory. I don’t mind that Schannep has his own way of accounting for bull and bear markets. However, Dow Theory is usually much more simplified than what has been proposed by Schannep.

As mentioned before, your understanding of Schannep’s work is far greater than ours. This gives you the benefit of knowing, in our opinion, one more approach on the topic than we have. We couldn’t claim to be Dow purists since we’ve only opted for the method that seems the simplest. 


We hope our response has added food for thought and thank you for your contribution to Schannep’s work. As a subscriber to Schannep’s service, you are a credit to his efforts and thank you for your time spent explaining his philosophy.

Please revisit New Low Observer for edits and revisions to this post. Email us.