Category Archives: Dow Theory

A Lesson in Dow Theory

In a September 20, 2010 article titled “Dow Theorist Believes Buy Signal is Imminent” on MarketWatch.com, there are views from three different well known Dow Theorists with different conclusions from each one of them. This is an instance where the author, Mark Hulbert, should at least know something about the topic on which he writes. Instead, the author clouds the picture on Dow Theory, which few people really understand or write about. Since Mark Hulbert rates the performance of stock market newsletter, he should probably stick to the performance numbers rather than muddy the interpretation on Dow Theory by writers who aren’t following the clearly defined rules of the theory.

Now it is the job of the New Low Observer team to clean up the confusion created by Mr. Mark Hulbert, on the inaccuracies of the Dow Theorists.

First, in all instances, none of the theorists mentioned (Russell, Schannep, Moroney) could possibly be interpreting Dow Theory accurately if they are somehow about to generate a “buy” signal. This would mean that prior to a buy signal there would have been a sell signal indicated. According to our work on Dow Theory, which is well documented and freely available (check here), there hasn’t been a single sell signal since the July 24, 2009 bull market indication which was selected by the New Low Observer team as the initiation date of our website. This is further evidenced by the simple fact that the Industrials and Transports have continued to climb higher since March 2009 to the present.

Not to be outdone is the great Dow Theorist Richard Russell. Mr. Russell is referred to in the article as a “traditionalist” when it comes to Dow Theory. Mr. Russell says that he cannot “…say that even a short term buy signal has been generated. That’s because the Dow Transports as of mid-day trading in New York remain about 1% below their early August high (which came in at 4,516.35).” To his credit, Mr. Russell sticks with the use of the Dow Transportation Average for an indication of a Dow Theory “buy” signal.

Unfortunately, on the very first day that the Transports exceeded the 4,516.35 level on September 28, 2010, Russell never gave any indication that a short-term buy was at hand. The very next day, still no indication of a short-term buy indication. September 30th, still no indication of a “short-term” buy signal. As the Transportation Average continued to climb to the current level of 4,923.40, Mr. Russell has made no reference to Dow Theory based on the numbers or the technicals. Instead, Mr. Russell has talked about the major premise behind Dow Theory is values. While this is true, some consideration of current market action is what Dow Theory is all about. The pattern created by the “short-term” buy signal is exactly the same one that Russell used when he called the market bottom in January of 1975. We’re not certain why he doesn’t recognize this pattern today.

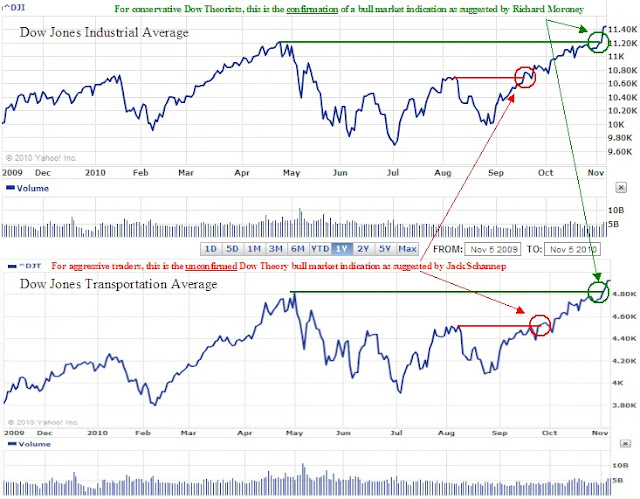
Next, as a Dow Theorist of sorts (we’re not really sure), Mr. Schannep has several issues that require addressing. Among our concerns, Mr. Schannep never needed to replace the Dow Jones Transportation Average for the S&P 500 Index in order to get a Dow Theory signal. We understand the goal of Mr. Schannep in this strategy, reduce the period of time to garner a signal so that more upside is obtain. If, in fact, the goal of Mr. Schannep was to get an earlier signal by using the S&P 500, then he probably got it by three days at best.

It is important to note that if Mr. Schannep was applying anything like Dow’s theory, then he would have to wait for the last of the two indicators to confirm a signal. This means that although the S&P 500 signal came almost two weeks ahead of the Transportation index, the Industrials’ confirmation came within three days of the Transports’ confirmation. The chart below demonstrates how Mr. Schannep could have utilized the Transportation index and gotten the same signal in the same period of time.
The matter of timing the signal is a concern that plagues every Dow Theorist. However, resorting to the tactics of Mr. Schannep only undermines the point of Dow Theory as outlined by Robert Rhea in his book The Dow Theory. Instead of changing Dow’s theory into our own, in order to generate earlier signals, we have decided to use Dow’s Theory as an asset allocation tool instead. More funds in stocks that are undervalued during bull market indications and fewer funds in stocks that are undervalued during bear market indications. This way, we’re not beholden to issues of late signals requiring modifications of Dow’s theory.

The article suggested that on September 20, 2010 a buy signal was about to be registered according Jack Schennep’s website. Mr. Schannep manages to mix the usage of the Dow Industrials, Dow Transports and the S&P 500 index to garner a “Dow Theory” buy or sell signal. It appears that, according to Mr. Schannep, if you cannot get clarity from the standard indicators, the Dow Industrials and Dow Transports, then you replace any one of the two indexes with the S&P 500 index. Mr. Schannep indicates that this approach is a more modern strategy for determining Dow Theory buy and sell indications. We don’t like Mr. Schannep’s modification to the Dow Theory but if it works profitably for his subscribers then more power to him. However, it should be said that Mr. Schannep isn’t practicing Dow Theory.

Another problem we have with Mr. Schannep is that he advocates buying at a point just short of a full confirmation. A reasonable market technician would agree that if there is only 4.73% before a clear indication is given (new high), why try to capture so little with the prospect that the market could reverse direction? Instead, wait for the clear signal and decide how much you want invested in the next move. This idea is driven home in the following chart and excerpt from a 1939 series of articles in Barron’s that later became the book “Making the Dow Theory Work” by Sparta Fritz Jr. and A.M. Shumate.


“Point 9 represents the upward penetration of the minor high, with encouragement from the volume of trading. The averages are still at levels to suggest buying.

“All rules of sound practice would forbid buying at point 10. Possible losses, figured against recent lows, are unattractively large. At the same time, a bullish forecast still lacks the authority which the averages could give by bettering the old highs. If the speculator has missed the good chances that have been left behind, surely he out not buy here. It will be far wiser to wait and pay a little more, when and if the averages jump the hurdle of their former highs.

“Aside from other considerations that enter into forecasting, the market position at point 10 actually suggests to the speculator a tactical sell-out of some of his stock. Suppose it turned out that the bull market was over. Important savings could be made by sales here. The speculator can step aside, and re-enter the market at a slight concession, if the highs are bettered.

“The bull market is demonstrated to be still in progress at point 11. Stocks can be bought here, but it cannot be considered a first-class risk. It is simply the last reasonable buying level as the primary trend moves on. Stocks bought here will sometimes show a loss on the next reaction.”

Sparta Fritz Jr; Shumate A.M. “Making the Dow Theory Work.” Barron’s (September 11, 1939). page 9.
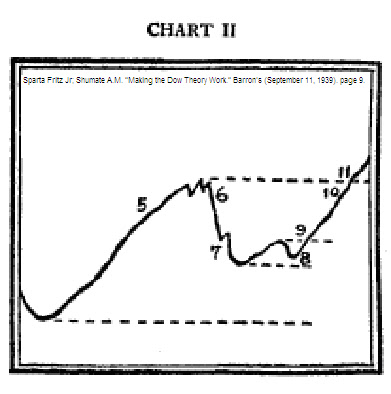
Basically, Mr. Schannep recommends buying the market at the equivalent of point 10 when he could have more certainty in the call at point 11. In our view, this isn’t a responsible approach to calling the market, let alone a mangled version of Dow Theory.

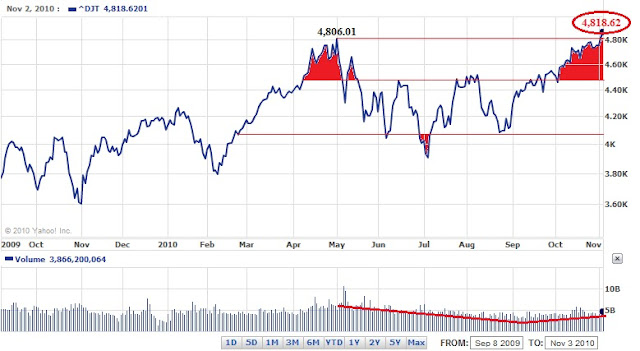
The MarketWatch.com article makes reference to Richard Moroney of the Dow Theory Forecasts newsletter. Mark Hulbert says that Mr. Moroney has an interpretation of Dow Theory that is “different than that of both Schannep and Russell, the two Dow averages must surpass their mid April highs to trigger a buy signal. Those levels, which remain some way off, are 11,205.03 for the Industrials and 4,806.01 for the Transports.” Based on his commentary, Mr. Moroney is the only one who is actually practicing Dow Theory. The numbers that Mr. Moroney indicated as being required for a Dow Theory buy signal were exactly the same numbers that the New Low Observer team was looking for as a continuation of the bull market.

Unfortunately, there is a distinction between a “buy” signal and continuation of the trend. As mentioned before, a buy indication means that a sell had to be given previously. A continuation of the trend indicates that a prior signal is being confirmed and nothing has changed. This nuance is very importance since anyone who considers buying at this point should understand that “…it cannot be considered a first-class risk…” as described by Fritz and Shumate.

The handling of such a topic as Dow Theory should not be left to chance when the material on the topic is so accessible. Unfortunately, Mark Hulbert isn’t aware of the discrepancies mentioned above. Such a lack of knowledge on Mr. Hulbert’s part only feeds the misunderstanding about Dow’s Theory. This is reflected in the comment section that follows the article where readers justifiably deride the theory and it’s practitioners.
Note:
Any and all bull market indications are within the context of a secular bear market.  The secular bear market is deem over when the Dow Industrials and Dow Transports exceed the previous highs set in 2007.  Therefore, the current market is considered to be a "bear market rally" or a cyclical bull market.
Please revisit New Low Observer for edits and revisions to this post. Email us.

Yearning for the Richard Russell of Yore

As Dow Theorists, it is required that we read the information that is put out by Richard Russell. So it perturbed us to find that there has been nary a peep on Russell’s site about Dow Theory based on the recent movement of the Dow Jones Industrial Average and the Dow Jones Transportation Average. As noted on our site today, Dow Theory has given a reiteration of the bullish trend that has been in place since the July 2009 bull market confirmation.
In the last two days we have feverently scoured Russell’s website for any confirmation of our perspective on Dow Theory. We’ve found nothing. Even more alarming is the vague reference to Dow Theory as it pertains to value. This reference in passing was circumspect at best and puts into question any attempt to demonstrate any understanding of the topic. On November 3, 2010, Richard Russell said:

“My own opinion regarding the markets is that the test of values trumps all other considerations.”

Russell goes on to conclude that based on historical values of the market, stocks and bonds are in a bubble. After concluding that stocks and bonds are in a bubble, Russell says that he doesn’t want his subscribers to buy stocks or bonds. Finally, in his November 3, 2010 posting, Russell laments the period of 1997 to 1999 and states, to our disbelief:

“Who were those geniuses who piled into AMZN [Amazon.com] when it was selling for under five clams?”

Along with the preceding quote, Russell included only a chart of AMZN and a description on how much he buys almost everything from the Amazon.com.
We’re not so sure that Russell was pining for AMZN back in July 1, 1998 when Amazon.com was selling for $19.02 [adjusted for splits]. At that time, in his letter published on the same date, Russell said:

“Bookseller Amazon.com is priced at over 81 [ $81 unadjusted/$19.02 adjusted] now, but it won’t be making a nickel of profit for at least two years.”

 There was no indication that Amazon.com was at a value at the time.
On November 4, 2010, Russell ties the concept of Dow Theory to values. This was the first reference to Dow Theory after the bull market confirmation on November 3rd. In this excerpt, Russell gives an idea as to what exactly he looks for to determine values, namely dividend yield and P/E ratios. Then Russell goes on to say:
“In the business of investing, money is made in the buying (see Amazon study on yesterday’s site). Buy right and you’ll end up with profits. Buy wrong, and you’ll end up with tears.”
We were perplexed that Russell would connect Amazon.com with buying values at a time when, back in 1998, there were no dividends to generate a dividend yield and no earnings to generate a P/E ratio. This attempt to demonstrate the importance of values was further distorted when Russell starts discussing buying gold in the November 4th article. Russell said:
“Buy gold at the highs, buy gold on a correction, buy gold when its in a confusing consolidation, and within five years you’ll thank the day when you bought it.”
To say “Buy gold at the highs…” counters all the efforts to educate investors on the importance of values. In addition, there was no reference to the fact that Dow Theory had giving a bull market confirmation. It is troubling that Russell further tarnishes his reputation as a keen observer of markets [regardless of being right or wrong] by not addressing the validity of the signal on a theory that is the title of the newsletter.
Although we generally agree with Russell’s perspective on gold, for different reasons, we hope his subscribers aren’t being led astray by his blatant contradictions simply because he is bullish on gold at a time that the gold market happens to be moving higher.

Sources:

Please revisit New Low Observer for edits and revisions to this post. Email us.

Dow Theory: Continuation of Bull Market Confirmed

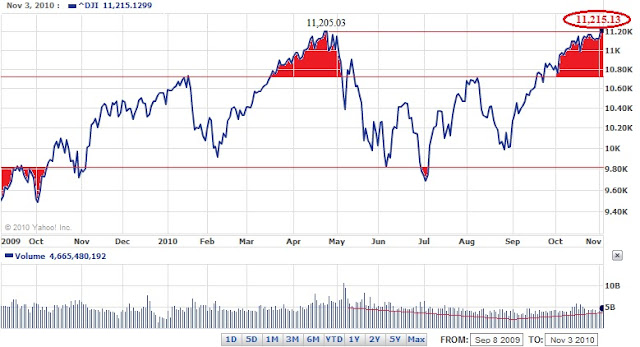
In our last discussion of Dow Theory on September 8, 2010, we indicated that the Dow Industrials and Dow Transports had formed a line. The line that we discussed in the September 8th article was broken through on the upside in the month of October. According to William Peter Hamilton, a line in the market could be considered as important as a market crash. We decided against a reaction on the line being broken to the upside out of concern for jumping the gun. To be conservative on the topic of Dow Theory, we opted for the sure fire signal of a continuation of the bull market trend with the markets making new highs above the April/May points.
On November 3, 2010, the Dow Industrials confirmed the Dow Transports breach of the their respective highs since the 2009 bottom. The new high came on the news that the Federal Reserve is going to fully implement quantitative easing (QE2) to further boost the economy. In addition, the new high arrived as the results of the November 2nd election were finally in. We are not surprised of the coincidence of QE2 being introduced immediately after the election results. Our last article on the topic Dow Theory on September 8, 2010 closed with the following commentary:
“Politicians vying for re-election will fight tooth-and-nail against outcomes that don’t ‘appear’ positive. With this in mind, it is possible that the only option is to the upside.”
With this confirmation, we can only guess as to where the next stop for the markets might be. However, in our February 12, 2009 article, we discussed the idea that when the stock market falls 40% or more there is the tendency to retrace 50%-100% of the prior decline. So far the Dow Industrials have retracted 61% of the previous decline from 14,164.53. With the introduction of QE2 at this point in the game, we’re likely to achieve 100% retracement of the market from the October 2007 top.
With a goal of self-preservation in mind, we have the tendency to believe that the market is always going to fall rather than head higher. This time is no different. However, the Dow Theory signal is telling us that as long as we don’t get a sudden reversal of the trend we’ve got at least another 3 to 9 months of an upward bias in the stock market and the economy. Our September 8th article said:
“the length of time that has been spent in such a range seems to indicate that we’re due for a breakdown or an explosion if the markets cross below or above the range.”
As a result of breaking above the line and the previous high, we may experience the oddity of a full-fledged financial stock panic to the upside regardless of whether it is warranted or not. Basically, this could be the final blow-off before attaining the cyclical bull market top.
Downside targets for the Dow Jones Industrial Average are:
  • 10,000
  • 9,500
  • 8,000
Because we have a natural bias against the upside prospects, we caution all investors to pay close attention to the downside targets. All new investments should be with the acceptance that the Dow Industrials could fall to the 8,000 level without warning. However, facts being what they are, Dow Theory seems to be pointing the way for the economy and the stock market.

Please revisit New Low Observer for edits and revisions to this post. Email us.

Seeking Ten Percent

A reader asks:
“I see that your Watch List performance for the past 12 months is no better than the Dow's. How is that possible when you focus on the Dividend Achievers that are close to their 52-wk lows and do so much in-depth research and analysis?
“Am I missing something? If not, then how do you argue against just investing in something like a Vanguard index fund? Or, better still, there are value-oriented funds like those run by Tweedy Browne, et al, that have substantial outperformance to the market.
“Should your approach be modified to take into account the macro view first and then selecting the right sectors (from among the S&P 500's ten sectors) based on where the economy is in its growth/decline cycle? Thus, should the cycle analysis be used along with your present criteria to achieve outperformance?”
Our response:
These are all great questions. First, we’ll address the question of why bother doing all the work of researching these company if the final result is simply to underperform the Dow Jones Industrial Average. As indicated in the book Investing: The Last Liberal Art there is an element of joy in learning new things. We love the process of understanding the research into cell apoptosis that a drug company is doing. We love finding a book like Taking Chances: The Psychology of Losing and how to Profit from it which helps us to understand more fully the benefits of failing. We love stumbling upon mathematical "quirks" like Benford’s Law whereby it can be proven that the order and frequency of the first digit in a set of numbers can reveal that there is accounting fraud. Simply put, our research of stocks fulfills our desire to understand the world around us while we attempt to pursue the profit motive.
In pursuit of the profit motive, the goal of the New Low Observer is to obtain mediocre gains of 9%-12% in each investment that we make. This means that when a stock rises to the level that we’re comfortable with, within the designated range, we find the next best alternative that is on any one of our new low lists.
As mentioned before, we consider selling a stock when it reaches a gain of 10% within a year. All of the stocks on our September 25, 2009 watch list accomplished our goal of 10% well before the end of the one-year period. The table below is the best demonstration of our approach in action.
Symbol
days to 10%
Annualized gain
WMT
54
67.59%
CAH
44
82.95%
WEYS
208
17.55%
ABT
44
82.95%
NWN
162
22.53%
BCR
182
20.05%
LLY
52
70.19%
BDX
68
53.68%
PNY
84
43.45%
*based on September 25, 2009 Dividend Watch List
As you can see from the stocks above, in some cases, accomplishing 10% occurred much earlier than we would have expected. We like to think of returns of 10% in less than a year as a form of accumulated time. This means that if we gain 10% in 5 months, we have at least 7 months to sit back and study the markets. This is seven months where we can detach ourselves from the noise and chaos that normally distorts rational thinking. Obviously, this is an option that we exercise from time to time when we’re not sure of the market prospects.
The example that we provided in our performance review of Dividend Achievers from September 25, 2009 was actually the worst case scenario if you decided, for some reason or another, to buy and hold all of the stocks that were on the list at the time (not recommended.) As far as we’re concerned, we were out of those stocks long before one year as has been demonstrated with the Sell Recommendation section of this site. Again, we seek mediocrity in our investment strategy knowing that if 10% can be accomplished within a year then we have been exceptionally fortunate. As mentioned in previous articles, we only expect 1/3 of the stocks to achieve 10% in one year during a bull market. However, if a stock that you purchase is on our Dividend Watch List, you can be assured that you can hold the stock for the “long term” if you choose to do so.
Finally, we are constantly trying to keep abreast of the macro view of the markets and the economy. However, our best experience has been with the use of Dow Theory. Although not infallible, Dow Theory is intended to be an all encompassing guide to not only what is going on right now but also what to expect in the future up to three to nine months ahead. We’re cognizant of the fact that Dow Theory is only a tool and not THE answer to what the future holds. Therefore, we only apply Dow Theory as a tool for determining asset allocation. Charles Dow himself has been specific on the point that investors can still have their money at work in a bear market (during a recession or depression). The only change that needs to take place during such hard economic times is the expectation of returns. As we at the New Low Observer seem insistent on getting 10% during the good times, we must be willing to accept 5% during the bad times.

New Low Team Beats NBER to the Punch

 The New Low Observer (NLO) team has done it again on the economy, stock market and our “guess” of when the National Bureau of Economic Research (NBER) would declare the end of the recession that began in October of 2007.


First and foremost, the NLO team announced on July 24, 2009 (the initiation of the NLO site) that Dow Theory had indicated that we were definitely in a cyclical bull market. This ignores our article on February 11, 2009 titled “Convergence of Extraordinary Forces” that indicated that there would be a bottom in the market around June 2009. According to Dow Theory, a bottom in the stock market implies a trough in the economy as well.


Second, on August 22, 2009, the NLO team indicated that based on the Industrial Production Index (IPI) and the Dow Theory bull market indication the stock market and the economy were headed high.


Finally, along with our call to the end of the recession on August 22, 2009, we predicted that the NBER would “…proclaim June 2009 as the official end to the recession.” The headline out of the NBER today, September 20, 2010, is that “…a trough in business activity occurred in the U.S. economy in June 2009.”


Some of the articles can be verified with the postings on Seeking Alpha.com; which we cannot alter once published. Just look at the approximate date that the article was published since Seeking Alpha does not publish exactly when submitted.


Seeking Alpha Articles:


Subscribers to our site have received all indicated articles with any revisions of our view as appropriate. Anyone interested in subscribing by email can use the following link.

Dow Theory: The Formation of a Line

According to Dow Theory, the formation of a line, the stock market trading in a narrow range, typically portends a major movement in the market once the range is broken through on the upper or lower end of the channel it has traded in. To be specific, Dow Theory indicates that a line is created when both the Dow Jones Transportation and Industrial Averages are in a range of 5% over a period for 8 weeks or more.
 
In the charts below, neither index has exhibited a narrow range of 5% or less. In addition, from a strictly technical basis, it would be difficult to say that a range has not been broken on the upside in March and April of 2010 for the Dow Jones Industrial Average or the downside in July 2010 for both indexes. However, it is challenging to ignore the general range of 10,700 to 9,750 that the Dow Industrials has traded in since late September 2009. Likewise, the Transportation index has traded in a fairly tight range since mid-May 2010.
Saved for the exactitudes of Dow Theory, I believe that we’re witnessing an over-extended “line” as defined by William Peter Hamilton. Hamilton said of lines:
 
“Such a narrow fluctuation, to the experienced student of the averages, may be as significant as a sharp movement in either direction.”
Rhea, Robert. The Dow Theory. Barron’s (1932). page 82.
This suggests that a range bound market is the equivalent to a stock market crash. It is hard to quantify what the extent of the crash would look like if it took place instead of trading in a range. However, we could compare the range to the crash from October 2007 to March 2009 with the current market in terms of time. In the period from 2007 to 2009, it took approximately 17 months to flush out the weakness. The current market is bordering on 12 months of relative inaction.
 
If this is a correct assessment, then the price of the market must have approached some sort of alignment with the values of the market. Therefore, a rise above the upper end of the line could represent a “sudden” realization that the current market is ridiculously undervalued.
 
Conversely, if the weakness of the market hasn’t been wiped out of the market over the last 12 months then a slump to the downside could be devastating since a verdict indicating that we’re still overvalued would awaken investor’s worst fears about all the headlines of an economy that is getting by on dwindling government (i.e. Federal Reserve) life support.
 
If the pattern of a line formation is not correct then the alternative view could be that we’re witness to a classic head-and-shoulder formation in the Dow Jones Industrial Average with the head being April 2010 and the shoulders being January and August 2010. My suspicion is that, like the pendulum on a clock, the areas in red are only reactions to the prior extremes and therefore offset the otherwise technical relevance of each extreme. Basically, the April-May extremes were counteracted by the July extremes rendering the significance of each period null and void.
 
The further the markets continue in this range the greater the impact it will have once that range-bound action is broken. However, the length of time that has been spent in such a range seems to indicate that we’re due for a breakdown or an explosion if the markets cross below or above the range.
 
This is one instance where the outcome of a 50/50 proposition could have a dramatic effect on the short-term economic decisions of our nation. Politicians vying for re-election will fight tooth-and-nail against outcomes that don’t “appear” positive. With this in mind, it is possible that the only option is to the upside. We say this with a note of grudging acquiescence since we would rather opt for what is restoring and regenerative instead of what is expedient.
 
Related Articles:

Dow Theory, Stock Markets and Economic Forecasting

A reader writes:
In a recent Time Magazine article dated July 27, 2010, David Rosenberg said the following:
 

"…But the market gets it wrong as often as it gets it right – it was wrong to forecast a recession in the fall of 1987, again in the summer of 1998 and again in the winter of 2003. It was wrong to forecast sustained growth in the summer of 2000, a recovery in the winter of 2002, an avoidance of recession in the fall of 2007 and the end of the downturn in the spring of 2008. It may be a discounting mechanism, but the stock market has a spotty record – let's remind ourselves of that."

Does this mean that the Dow Theory was not giving the right signals for the stock market during all the periods Rosenberg mentions above? Can you tell me what was Russell saying with regards to the stock market's and the economy's trend as forecasted by the Dow Theory during those periods?
 
To put it another way, there are two separate issues involved here:
 
  • First, does the Dow Theory correctly forecast the bull/bear trend reversals in the stock market? (Answer seems yes, though with a considerable lag.)
  • Second, does the stock market correctly forecast recoveries/recessions in the economy? (Some say No!)
Our Response:
To address the preceding questions, we’ll first cover the role of Dow Theory from our perspective. Then we’ll address the aspect of modern usage of Dow Theory from the leading proponents with the widest following. Then we’ll circle round to address Dow Theory and how to make it useful regardless of its obvious shortcomings. We’ll address Richard Russell’s take on Dow Theory and what he was saying about the market using Dow Theory. We’ll make comments on David Rosenberg’s assessment that the stock market “…gets it wrong as often as it gets it right” by comparing the periods of recession with the Dow Jones Industrial Average.
 
When thinking in terms of Dow Theory, the New Low Observer team doesn’t take the conventional view on how it should be used. To us, Dow Theory isn’t a market forecasting tool as much as it is an allocation indicator. When there is a bull market indication then we have a target allocation of 33% or more for a single stock. When there is a bear market indication then we have a target allocation of 25% or less for an individual stock.
 
Some take Dow Theory too seriously and extrapolate far beyond even the most rudimentary use and allow it to become a make or break approach for buying or selling stocks. The most useful, but least understood, element of Dow Theory is Charles Dow’s discussion of values. Subsequent writing on the topic of values, in the context of Dow Theory, by Nelson, Hamilton, Rhea, Collins, Shumate, Schaefer, Russell and Schennep are worth heaps more than any successful market call of a top or bottom. In fact, the Dow Theory understanding of values trumps all market signals since great values can exist in both bull and bear markets.
 
Aside from ignoring the emphasis on values, the two most common mistakes that are made when thinking about Dow Theory are misinterpretation and misapplication. Accurate interpretation is the primary goal of every Dow Theorist. However, it becomes easy to get overwhelmed with current market conditions. This makes the acceptance of what the indicator is saying very challenging. Front load a few personal experiences from the “Great” Depression and WWII and it become impossible to see the market from the trees. Renowned Dow Theorist Robert Rhea once cautioned those trying to interpret the markets (especially Dow Theory) that, “the wish must not father the thought.” In many cases, it becomes too easy for the wish to supercede the judgment of markets.
 
The linked article written on June 16, 2010 on MarketWatch.com titled “Avoiding a Death Sentence” by Mark Hulbert provides a perfect example of misinterpretation and misapplication when trying to use Dow Theory. We get misapplication by trying to recommend selling stocks based on the misinterpretation of a potential bear market indication.
 
In the article, Hulbert highlights opinions on Dow Theory from the most prominent Dow Theorists today starting with Richard Russell, Jack Schannep and Richard Moroney. The basic view in the article was that the stock market was grasping at the last straws of a bull market and it was only a matter of time before a sell signal would to be given.
Richard Russell was the only one of the three Dow Theorists who was unwavering in his view that a sell signal had already been registered. The article quotes Russell as saying that, “the curse is cast. …[The breaking of the May lows] means that the primary bear market is resuming. The monster is creeping towards Bethlehem.”
 
Schannep and Moroney seemed to be in agreement that a violation of the June 7th low would be what they needed to see in order for them to officially declare that a sell signal had been indicated, according to Dow Theory. As it happens, the June 7th lows were violated for both the Dow Industrials and Dow Transports (on a closing basis) which means that both Dow Theorists would have given sell recommendations to their newsletter subscribers.
 
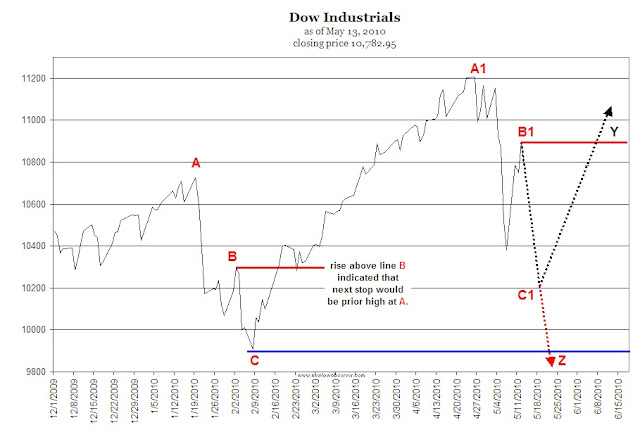
The misinterpretation of Dow Theory that was executed by these three theorists was a function of two distinct issues. First, there wasn’t a focus on prior action as suggest by Charles H. Dow. Our May 13th article on Dow Theory outlined the specific action that should be watched for prior to the occurrence based on the Dow Industrials movement from January 19th to February 5th. The next item that was misinterpreted was the May 6th “flash crash.” The fact that the Dow Industrials and Dow Transports had similar closing lows of May 6th made the otherwise technically significant closing price unimportant in comparison to the intra-day low. The intra-day low reflected either the psychological influence needed to fall as much as it did or the psychological influence needed to recover from such a low.
 
These are the factors that I think contributed to the misinterpretation of the signals given. Some Dow Theorists have said that because they take an arms length approach to the market (i.e. not invested personally in stocks) that their interpretation is not clouded by the desires for financial gain. However, those same Dow Theorists manage to get it wrong just as often as anybody else.
 
Next is the issue of the misapplication of Dow Theory. William Peter Hamilton was correct in titling his book on Dow Theory The Stock Market Barometer. Like a weather barometer, Dow Theory was intended to be a guide to the direction of the market on a short-term basis. The readings from a weather barometer tell you to either bring an umbrella or leave it at home. The barometer never tells you to stay at home if it is going to rain. Telling investors that a bear market has been signaled and therefore you need to sell all or some of your stocks is the equivalent of saying, “its going to rain today, you’d better stay home.”
 
Again, Dow Theory wasn’t intended to generate a buy or sell indication. Instead, it was created to tell investors what the current conditions of the market are with a 3-month, 6-month, or 9-month peek at what might lay ahead. If the indication is that we’re in a bear market then we could expect that the market will decline further. If the indication is that we’re in a bull market then we could expect that the market will rise. What an investor does with this information is something else altogether. In many respects, buy and sell reactions based on Dow Theory bull and bear market indications are misapplications of the theory.
 
Throughout the writings by Rhea and Hamilton, it has been noted that Dow Theory is not a “get rich quick” way to make money in the stock market. Neither is the theory infallible. Because misinterpretation of Dow Theory is so easy to accomplish, the New Low Observer team attempts to focus more attention on values and the application of Dow Theory as an asset allocation tool rather than being right about the big picture or primary trend.
 
When you combine the effects of misinterpretation with misapplication by some of the most renowned Dow Theorists, it is no wonder that critics complain that Dow Theory is archaic. However, put in its proper context, observations in Dow Theory can provide better judgment in selecting individual stocks at appropriate times with proper allocations. Although Dow Theory generally gets it right about the stock market direction on a short term basis, I personally wouldn’t rely on the market calls as much as I do with Dow’s writings on values.
 
Like most market participants, we don’t necessarily know values in the way that someone as smart as Warren Buffett might. However, everyone is clear on the fact that well established companies with consistent dividend increasing histories near a new 52-week low are most likely to be closer to “real” value propositions instead of stocks in a well established rising trend or at a new high. Charles Dow was very clear that values, above all else, determine the direction of the market. This includes the values that can be found within a bull or bear market.
 
In regards to Richard Russell’s commentary on Dow Theory, it is necessary to take Russell’s bias into account when determining whether he was wrong or right about the markets in 1987, 2000, 2002, 2003, 2007, and 2008. Russell’s bias is infinitely and always to the downside and this bias has grown as time has passed. This is what makes his late 1974, early 1975 call of a market bottom so amazing and worth studying.
 
Despite being right at the time, it is next to impossible to say whether Russell truly called the tops of 1987, 2000, 2007, and 2008 or was continuing with his downside bias (false positives). However, what we can gather from each call of a market top are the nuances that are very distinct from the other times that Russell was bearish. You’d have to read all of his letters from the beginning of a rising market to the peak to know the distinctions.
 
How biased against the upside is Richard Russell, despite what Dow Theory and his proprietary Primary Trend Indicator says? The following quote should summarize Russell’s attitude.
 
“In his latest mailing, Steve [Leuthold] talks about secular bear markets. What’s a secular bear market? They are the really big ones. Steve tells us that the dictionary defines secular as ‘coming once in an age.’ Steve Leuthold says that in 46 years in this business, he has only seen two secular bear markets, the bear market of 1969 to 1974, and the bear market of 1999 to 2002. Fair enough. But I disagree. Writing at the time, I called the bear market as starting in 1966, not 1969, but Steve and I both agree that the secular bear market ended with the crushing market collapse of 1973-1974. We both agree that another secular bear market began in 1999. Steve believes that bear market ended in 2002. But I believe the bear market that started in 1999 is still in force, although it’s been extended due to the manipulations of the Federal Reserve under Alan Greenspan.”
Richard Russell. http://www.dowtheoryletters.com, staff2@dowtheoryletters.com, Letter 1378, November 17, 2004, Page 3
Even though the market bottomed in October 2002 and Dow Theory signaled a bull market in June 2003, Russell stuck to his bearish view. In his July 19, 2006 letter, Russell said, “The Big, Big Picture is this-the bear market that began in January 2000 never ended.” Russell did not indicate that we were in a bull market until January 2009. Russell managed to ignore the Dow Theory signal that was given in June 2003 at around the 9000 level for the Dow Industrials all the way to the peak in 2007 at 14,100. A span of 4 years and 55% wasn’t enough to convince Russell that the last bear market had ended. As I mentioned before, out of the blue we got the January 2009 bull market call by Russell, which seemed, at the time, to defy all available data and logic.
 
The comment posed by David Rosenberg, in the July 27th issue of Time Magazine, “that the markets continuously get it wrong,” is certainly a matter of subjectivity. Rosenberg’s assessment could be very accurate if viewed from the perspective that the popular media outlet’s parade of talking heads, representing the voice of the market, got it all wrong beforehand. However, if viewed from a Dow Theory perspective, especially in retrospect, the message that the market was sending was very clear and quite accurate, albeit somewhat delayed. Naturally, Dow Theory isn’t perfect but the consistency, as compared to the alternatives, is enough to give a general overview of future market activity that is later support by some, not necessarily all, economic indicators.
 
To be specific with Rosenberg’s contention, let us get the data portion on recessions during secular bull and bear markets out of the way. Below is a side-by-side comparison of the National Bureau of Economic Research (NBER) account of economic peaks to troughs (recessions) and the Dow Jones Industrial Average of peaks to troughs (bear markets).
 
Peak Trough DJIA peak DJIA trough DJIA % change Coincidence
June 1899(III) December 1900 (IV) 4/4/1899 6/23/1900 -29.40% YES
September 1902(IV) August 1904 (III) 9/19/1902 11/9/1903 -37.80% YES
May 1907(II) June 1908 (II) 1/19/1906 11/15/1907 -48.50% YES
January 1910(I) January 1912 (IV) 11/19/1909 7/26/1910 -26.80% YES
January 1913(I) December 1914 (IV) 9/30/1912 12/24/1914 -43.50% YES
August 1918(III) March 1919 (I) no coincidence no coincidence no coincidence NO
January 1920(I) July 1921 (III) 11/3/1919 8/24/1921 -46.60% YES
May 1923(II) July 1924 (III) 10/14/1922 7/31/1923 -16.00% YES
October 1926(III) November 1927 (IV) no coincidence no coincidence no coincidence NO
August 1929(III) March 1933 (I) 9/12/1929 7/8/1932 -89.20% YES
May 1937(II) June 1938 (II) 3/10/1937 3/31/1938 -49.10% YES
February 1945(I) October 1945 (IV) no coincidence no coincidence no coincidence NO
November 1948(IV) October 1949 (IV) 6/15/1948 6/13/1949 -16.30% YES
July 1953(II) May 1954 (II) 1/5/1953 9/14/1953 -13.00% YES
August 1957(III) April 1958 (II) 4/6/1956 10/22/1957 -19.40% YES
April 1960(II) February 1961 (I) 8/3/1959 10/25/1960 -16.50% YES
December 1969(IV) November 1970 (IV) 12/3/1968 5/26/1970 -35.90% YES
November 1973(IV) March 1975 (I) 5/26/1972 10/4/1974 -39.80% YES
January 1980(I) July 1980 (III) no coincidence no coincidence no coincidence NO
July 1981(III) November 1982 (IV) 4/27/1981 8/12/1982 -24.10% YES
July 1990(III) March1991(I) 10/9/1989 10/11/1990 -15.30% YES
March 2001(I) November2001 (IV) 1/14/2000 10/10/2002 -35.75% YES
December 2007 (IV) no trough announced 10/9/2007 3/9/2009 -53.38% YES
For the sake of all the economists out there, we will only view stock market declines with recessions as a coincidence indicator. We cannot know when a sustained market decline is a simple correction or an indicator of a coming recession. However, in the table above, we can see that 19 out of 24 occurrences of a recession were led, or accompanied, by a decline in the stock market. The far right column indicates if there was no coincidence or an/or the percentage change of the market when there was coincidence.
 
I’m willing to submit to the view that the answer to this question is yes, stock markets lead or coincided with economic contractions. However, the nature of the recover may not meet the expectations of some, if not many, of the participants of the economy in question. During a secular bear market, the frequency and length of recessions will be longer and occur more often than during a secular bull market. The opposite is true during a secular bull market.
 
It is important to note that the designation of a recession often occurs months and sometimes year(s) after the fact. For example, the indication of the December 2007 recession was given by the NBER exactly one year later. At the same time, the coincidence of the market corresponding with or leading a recession has occurred in real time. Dow Theory gave a confirmed indication of a bear market in the month of December 2007.
 
During a secular bear market, only certain aspects of the economy will experience growth while other elements will continue to wane or hold in a range. The recession from 2007 to 2009 is just such an example. Housing and employment has not “enjoyed” the tepid growth in the economy that has occurred since the March 2009 bottom. The government has had a crowding out effect with preferential stimulus in housing and jobs, which has only prolonged the uncertainty of the “real” numbers in foreclosures and unemployment. After all, why pay your mortgage when there is a program set up to keep you in the house? Why take any old job when you could hold out for that “ideal” job because you’re getting another extension of unemployment benefits? These aren’t artificial attributes of the rising stock market and economy as some Austrian economists argue. Instead, stimulus and printing of money simply adds to the complexity within an overall secular bear market.
 
During a secular bull market, the impact of a recession will not be as deep or broad in its scope or as long as in a secular bear market. Most elements in the economy will thrive despite a build up of otherwise dire conditions (which result in severe recessions and bear markets). One industry’s fall will not impair the breadth of the economy. Corruption and scandal, in business and politics, is looked upon as isolated incidents. There is less of a demand for a complete change of the entire system when problems are revealed. Cyclical bear markets within a bull market allow for a healthy purging of excesses and reinforce the view that prior excesses were justified somehow.
 
Sources:

Richard Russell Review: Letter 762

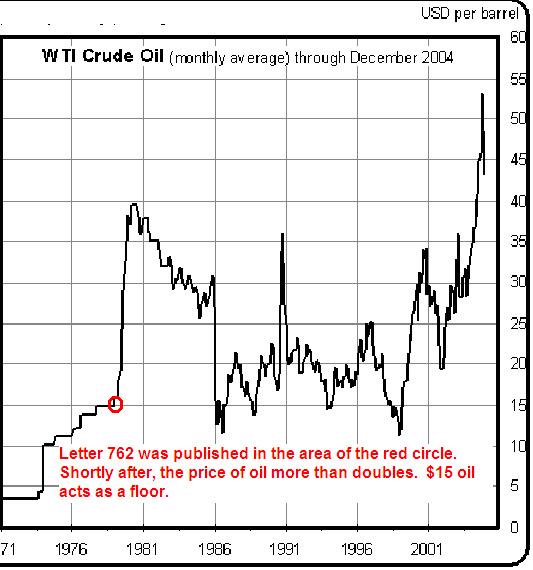
Letter 762 was published on August 1, 1979. At the time, the Dow Jones Industrial Average was indicated at 839.76. There were a couple of items that stood out as I read this newsletter.
Richard Russell said:
“As a matter of fact with Libya’s recent 10% cut in oil shipments and Algeria’s just announced 20% cut, I suspect that there’s an oil (and gas) glut building up now! The world is learning to cut back on fuel use—and fast, and this could turn out to be the shocker of 1979-1980.” Page 2.
In fact, it wasn’t long before oil prices reflected the glut that Richard Russell spoke of. Under normal circumstances, it would be difficult to see beyond the present crisis and think that it will end at some point. It seems that Russell was cognizant of the prospect, as remote as it seemed at the time. Unfortunately, as indicated in the chart below, $15 oil would become a base, or floor, instead of a ceiling.
One item that has been a longstanding issue with Richard Russell is reflected in the next quote.
Russell said:
“Last week I was asked this question: ‘Russell, if you could change any part of your stock approach over the past year, what would have done?’ My answer was, ‘There are many subscribers who are willing to speculate, and I think I have been too conservative and too stubborn on this issue. The change I would have made is that I would have offered speculative choices for those willing to assume the risk of buying in a market that is not over-sold and not in an ideal buying area.’” Page 2.
In addition to the previous remark by Richard Russell, he also said:

“I want to add that I personally am buying no shares here. I prefer to wait for the ‘ideal buying situation.’” Page 2.

The two remarks above have been the biggest challenge to Russell’s ability to adhere to Dow Theory or even his Primary Trend Index which was created to avoid potential market manipulation. Russell is infinitely waiting for the “ideal buying situation” while ignore individual values along the way.
Russell points out a fact that every investor should have ingrained in their mind before committing a single dollar to the stock market or any other potential investment opportunity. Russell said:
“Every investment must ultimately be valued on its return. In the stock market that means dividends. Ultimately, dividends must be paid if a stock is to be worth anything.” Page 4.
I thought that the following remark was profound.
“Now here’s an interesting aside on inflation. One of the reasons it’s so insidious is that as soon as a man starts protecting himself against it, as soon as he buys a house or a load of gold coins or a painting or a stamp collection-that man wants his inflation hedge to go up. He becomes (deep in his heart) an inflationist. Take housing: the value of total housing in this nation is $2.2 trillion (two thirds of these houses have mortgages). The last thing these home-owners want is a declining market. They are secretly in favor of rising prices and inflation.” Page 4.
Russell’s comment is right on target when it comes to the attitude of most people. It seems that everybody is an inflationist. There are few market participants or commentators who express the view that they hope their long position will decline in value. The NLO team happens to be among the few who, after going long a stock, are eagerly anticipating a decline in price. Shameless self-promotion aside, Russell’s commentary on the closet inflationists is truly profound.
Russell points out that if you’re in commodities but not in precious metal then you could be losing your shirt. Russell says:
“Commodity traders have had one of their roughest seasons in years. If you weren’t in the metals, you probably ‘got killed.’ For instance, the October cattle contract is now down from 74.45 to 61, a drop of almost 18%. One trader told me that ‘it looks like the country is vegetarian.’ Live hogs are much worse, with the October contract dropping from 51 to 32 a drop of 37%. On piggies I was told that they act like ‘the whole world is going Jewish!’” Page 5.
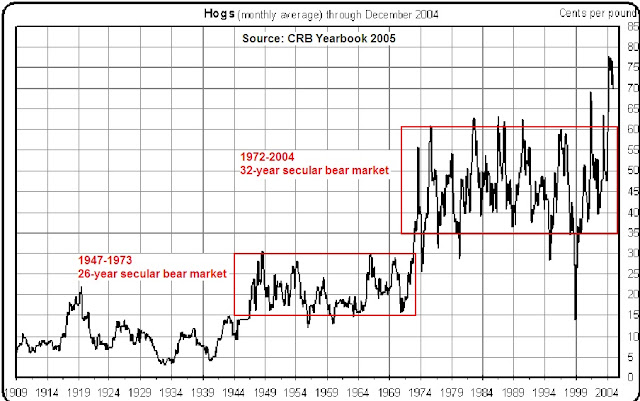
This counters the belief that during inflationary periods, all commodities do well or go up in value. It should be noted that the declines that were mentioned by Russell could have been the equivalent of a temporary pullback or secondary reaction. Interestingly, monthly hog prices traded in a wide range from 1972 to 2004 as indicated in the chart below. Suffice to say, anyone involved in commodity trading should be willing to accept even greater losses than the 50% that we expect for long positions in stocks before seeing any gains.
On the topic of interest rates Russell says the following:

“To the casual observer, it looked like a world embroiled in an interest rate war. And the fact is that rising inflation is being fought all over Europe and Japan- via an interest rate squeeze. The US is a frightened and reluctant follower.

“A few weeks ago Germany raised her bank rate. At the same time Britain boosted her borrowing rate a whopping 2%. Last week the US raised its discount rate an insufficient .5% to a record 10%. Canada immediately followed with a boost to 11.75% in her bank discount rate. The Japan jumped her lending fee to institutions a full 1%.” Page 5.
My thoughts on this passage are that it seems fascinating that the US wasn’t taking the lead in interest rate policy. Especially in comparison to the countries that were mention. It may have been a purposeful attempt to adjust rates when it was absolutely necessary. Could you imagine interest rates jumping 2% at a time?
Russell indicated that as the world’s leading power, the U.S. with its excessive printing of dollars cannot continue unabated. Russell said that foreign holders of dollars would become anxious and “move towards the exits.”
Russell mentions the Gold/Stock ratio; which divides the price of gold by the value of the NYSE Composite. Of the rising trend of the ratio, indicating strength in the price of gold, Russell says:

“Day after day the ratio climbs higher, and it is clear to me that shortly, SOMETHING IS GOING TO GIVE.” Page 5.

With hindsight being 20/20, my thought is that what “gives” in this situation is high inflation unless Russell was proposing that all governments are going the way of hyperinflation. My observation is that what tends to break, when two normally divergent indicators are going in the same direction, is the one that appears to be the “strongest.” In this case the stronger component of the Gold/Stock ratio was gold which had been in a multi-year rising trend while the NYSE had been in a wide trading range for an extended period of time.
I do have concerns about the sensibility of a gold/stock indicator since I have presented the view that gold and stocks usually follow each other rather than move counter to each other. For the most part, we have seen gold lag on declines and lead on rises in the stock market. One thing I’m certain of, if the price of gold rises then the stock market isn’t far behind. There may be an occasional divergence but the overall picture is that gold and stocks generally move in unison.
More:

Dow Theory

The challenge of the current stock market action based on Dow Theory is the fact that we’ve had many different signals to contend with. First, lets recap the major issues that have been throwing us for a loop so far.
  • Non-confirmation of the intermediate peak of May at point B1, which failed to retest the April peak from the March 9, 2009 low.
  • Failure of the Transports and Industrials to confirm the continuation of the long-term bull trend by giving a non-confirmation at point D in mid-June.
  • Transports not confirming the declining trend by staying above the Feb. 5th low on June 6th at point C1.
The most pressing matter before us right now is the fact that the Dow Industrial decline from the April 26th peak at 11,205.03 to July 2nd at 9,686.48 (point C2). This decline equaled 1,518.55 points, half of which equals 759.28. When adding 759.28 to the July 2nd low of 9,686.48 we get 10,445.76.
On June 18th, the Industrials closed at 10,450.63 and failed to maintain the level. As alarming as the first test was (June 18th), the fact that the retest of 10,445.76 resulted in a peak of 10,366.72 on July 14th at point D2. This demonstrates a large amount of weakness, and resistance, at the halfway point of a large intermediate decline. If the market cannot definitively breach the 10,445.76 level then my bias on the market is bearish. We will be in a bear market, from a Dow Theory standpoint, when, and if, the Industrials and the Transports go below their respective February 5th lows.

Email our team here.

Dow Theory and Richard Russell

In attempting to understand Dow Theory it is necessary to follow the best and the brightest on this topic. Over the last 52 years, the brightest person on Dow Theory has been Richard Russell. No single person has been more outspoken on their views on the market using Dow Theory, uninterrupted since 1958, than Richard Russell. So when Richard Russell does an about face on his interpretation of Dow Theory it is worth our time to examine the reasons.

First, it is necessary to provide context around the ideas on Russell’s most recent market call.

  • From November 12, 2007 to January 2, 2009, Russell indicated that we were in a bear market. The Dow went from 12,987.55 to 9,034.69, a decline of -30.44%.
  • From January 5, 2009 to January 12, 2009, Russell indicated that we were in a bull market. The Dow went from 8,952.89 to 6,926.49, a decline of –22.63%.
  • From March 11, 2009 to July 22, 2009, Russell indicated that we were in a bear market. The Dow went from 6,930.40 to 8,881.26, a gain of +28.15%.
  • From July 23, 2009 to May 19, 2010, Russell indicated that we were in a bull market. The Dow went from 9,069.29 to 10,444.37, a gain of +15.16%.
  • From May 20, 2010 to July 8, 2010, Russell indicated that we were in a bear market. The Dow went from 10,068.01 to 10,138.99, a slight gain was registered for the period (<1%).

On July 9, 2010, Richard Russell said:

“When the facts change, I change. To do otherwise would be idiotic. Something occurred yesterday that made me sit up and take notice. We had the non-confirmation by the D-J Transportation Average, a situation that I discussed on the July 5 site.”

“Following the Transport non-confirmation, yesterday the market surged higher, Dow up 274 and Transports up 152. But that’s not all. What I noticed was that yesterday was a 90% up day [up volume versus down volume] — the formula for a bottom.”

According to Russell, the Transports non-confirmation along with a 90% up volume/down volume ratio is what led to the conclusion that the market was indicating that a bottom was in. Russell goes on to recommend buying various ETFs with stop losses. Several problems arise when market action is viewed from Russell’s perspective.

First, Russell has ignored the fact that a trend is in place until a counter trend is signaled. So far, we haven’t had a bear market indication since the March 9, 2009 low. If the Transports were to confirm the Industrials by falling below the February 5, 2010 low, then we’d have our first bear market signal.

Second, when thinking in terms of Dow Theory, market participants have three variables to consider the Dow Jones Transportation index, Dow Jones Industrials and NYSE volume. Volume attributes are considered over a period of time. Single day action on volume should not be the determining factor for considering a bull or bear market. If this is the case, then most market signals could be very misleading. In my observations, market volume has increasingly become an addendum to Dow Theory.

Third, Russell has often disregarded the pure Dow Theory indications that have come along the way since the March 2009 low. It seems that Russell’s understanding of macro issues and his personal experience in the markets has led to his decision to err on the side of caution. However, Russell’s cautious streak has usurped the value of Dow Theory to act as a “…composite index of all the hopes, disappointments, and knowledge of everyone who knows anything of financial matters, and for that reason the effects of coming events (excluding acts of God) are always properly discounted in their movement. The averages quickly appraise such calamities as fires and earthquakes.” (Rhea, Robert, The Dow Theory, page 19).

Next, Russell has set himself up for the need to change his analysis by not thinking through Dow Theory to its conclusion. By calling a bottom at this juncture, Russell has left out the all-important confirmation that is required by the Industrials and Transports. 10,450.64 and 4,467.25 are the new levels that the Industrials and Transports need to surpass before any buying policy should be considered. In addition, after surpassing the referenced upside confirmation points, the next level of resistance is 8% away for both indexes. This means that we could go to the old high and then quickly reverse to the downside if a bull market confirmation isn’t signaled. However, given the most recent market action, our focus should be on the confirmation of the reversal pattern first, then the possible bull market indication.

Another matter of concern is that Richard Russell makes recommendations that don’t address the issue of investing in values. Values are a core tenet of Dow Theory. In fact, when you read Dow Theory Unplugged or Charles H. Dow: Economist, you will find that values, not technicals, are espoused. Russell points his readers to speculative opportunities instead of undervalued stocks which can be held for “the long term” if the bullish assessment happens to be incorrect. Our list of Dividend Achiever stocks at or near a new low addresses the prospect that if we’re wrong there is some recourse. In this case, you get the ability to compound your investment over time with the prospect of capital appreciation.

Finally, our stance on stop loss orders is widely known as indicated in the article “Automatic Orders Don’t Provide Protection” as well as our disclaimer at the end of each sell recommendation. Russell’s recommendation of buying ETFs is reckless at best especially in light of the May 6, 2010 “flash crash.” Adding fuel to the flames is the article titled “ETF ‘Circuit Breakers’ Needed to Stop Flash Crashes: Pros.” Our stance on ETFs is well founded and preceded any discussion of the true risks associated with them on May 6th (“ETF: Mediocrity With No Pretense of Value” and “ETF: Indiscriminant Risk”).

It is likely that perma-bulls will seize on the Russell commentary of July 9th as the heralding of a new-new era in investing. On the other hand, “contrarian investors” will suggest that when Richard Russell, perma-bear that he is, has entered the bull ring then the bull run is definitely over. It is our contention that while Richard Russell might be right about a reversal pattern being in place he is not using Dow Theory.

Our latest views on Dow Theory can be found at the following link (NLO on Dow Theory). Keep in mind that all trends are considered to remain in place until otherwise indicated. So far we are still in a cyclical bull market within a secular bear market

Dow Theory and Richard Russell

In attempting to understand Dow Theory it is necessary to follow the best and the brightest on this topic. Over the last 52 years, the brightest person on Dow Theory has been Richard Russell. No single person has been more outspoken on their views on the market using Dow Theory, uninterrupted since 1958, than Richard Russell. So when Richard Russell does an about face on his interpretation of Dow Theory it is worth our time to examine the reasons.
First, it is necessary to provide context around the ideas on Russell’s most recent market call.
  • From November 12, 2007 to January 2, 2009, Russell indicated that we were in a bear market. The Dow went from 12,987.55 to 9,034.69, a decline of -30.44%.
  • From January 5, 2009 to January 12, 2009, Russell indicated that we were in a bull market. The Dow went from 8,952.89 to 6,926.49, a decline of –22.63%.
  • From March 11, 2009 to July 22, 2009, Russell indicated that we were in a bear market. The Dow went from 6,930.40 to 8,881.26, a gain of +28.15%.
  • From July 23, 2009 to May 19, 2010, Russell indicated that we were in a bull market. The Dow went from 9,069.29 to 10,444.37, a gain of +15.16%.
  • From May 20, 2010 to July 8, 2010, Russell indicated that we were in a bear market. The Dow went from 10,068.01 to 10,138.99, a slight gain was registered for the period (<1%).
On July 9, 2010, Richard Russell said:


“When the facts change, I change. To do otherwise would be idiotic. Something occurred yesterday that made me sit up and take notice. We had the non-confirmation by the D-J Transportation Average, a situation that I discussed on the July 5 site.”
“Following the Transport non-confirmation, yesterday the market surged higher, Dow up 274 and Transports up 152. But that's not all. What I noticed was that yesterday was a 90% up day [up volume versus down volume] -- the formula for a bottom.”
According to Russell, the Transports non-confirmation along with a 90% up volume/down volume ratio is what led to the conclusion that the market was indicating that a bottom was in. Russell goes on to recommend buying various ETFs with stop losses. Several problems arise when market action is viewed from Russell’s perspective.
First, Russell has ignored the fact that a trend is in place until a counter trend is signaled. So far, we haven’t had a bear market indication since the March 9, 2009 low. If the Transports were to confirm the Industrials by falling below the February 5, 2010 low, then we’d have our first bear market signal.
Second, when thinking in terms of Dow Theory, market participants have three variables to consider the Dow Jones Transportation index, Dow Jones Industrials and NYSE volume. Volume attributes are considered over a period of time. Single day action on volume should not be the determining factor for considering a bull or bear market. If this is the case, then most market signals could be very misleading. In my observations, market volume has increasingly become an addendum to Dow Theory.
Third, Russell has often disregarded the pure Dow Theory indications that have come along the way since the March 2009 low. It seems that Russell’s understanding of macro issues and his personal experience in the markets has led to his decision to err on the side of caution. However, Russell’s cautious streak has usurped the value of Dow Theory to act as a “…composite index of all the hopes, disappointments, and knowledge of everyone who knows anything of financial matters, and for that reason the effects of coming events (excluding acts of God) are always properly discounted in their movement. The averages quickly appraise such calamities as fires and earthquakes.” (Rhea, Robert, The Dow Theory, page 19).
Next, Russell has set himself up for the need to change his analysis by not thinking through Dow Theory to its conclusion. By calling a bottom at this juncture, Russell has left out the all-important confirmation that is required by the Industrials and Transports. 10,450.64 and 4,467.25 are the new levels that the Industrials and Transports need to surpass before any buying policy should be considered. In addition, after surpassing the referenced upside confirmation points, the next level of resistance is 8% away for both indexes. This means that we could go to the old high and then quickly reverse to the downside if a bull market confirmation isn’t signaled. However, given the most recent market action, our focus should be on the confirmation of the reversal pattern first, then the possible bull market indication.
Another matter of concern is that Richard Russell makes recommendations that don’t address the issue of investing in values. Values are a core tenet of Dow Theory. In fact, when you read Dow Theory Unplugged or Charles H. Dow: Economist, you will find that values, not technicals, are espoused. Russell points his readers to speculative opportunities instead of undervalued stocks which can be held for “the long term” if the bullish assessment happens to be incorrect. Our list of Dividend Achiever stocks at or near a new low addresses the prospect that if we’re wrong there is some recourse. In this case, you get the ability to compound your investment over time with the prospect of capital appreciation.
Finally, our stance on stop loss orders is widely known as indicated in the article “Automatic Orders Don’t Provide Protection” as well as our disclaimer at the end of each sell recommendation. Russell's recommendation of buying ETFs is reckless at best especially in light of the May 6, 2010 “flash crash.” Adding fuel to the flames is the article titled “ETF ‘Circuit Breakers’ Needed to Stop Flash Crashes: Pros.” Our stance on ETFs is well founded and preceded any discussion of the true risks associated with them on May 6th (“ETF: Mediocrity With No Pretense of Value” and “ETF: Indiscriminant Risk”).
It is likely that perma-bulls will seize on the Russell commentary of July 9th as the heralding of a new-new era in investing. On the other hand, “contrarian investors” will suggest that when Richard Russell, perma-bear that he is, has entered the bull ring then the bull run is definitely over. It is our contention that while Richard Russell might be right about a reversal pattern being in place he is not using Dow Theory.
Our latest views on Dow Theory can be found at the following link (NLO on Dow Theory). Keep in mind that all trends are considered to remain in place until otherwise indicated. So far we are still in a cyclical bull market within a secular bear market.

Richard Russell Review: Letter 742

Dow Theory Letters issue 742 was published on November 1, 1978. At the time, the Dow Jones Industrial Average indicated was at the 806.05 level. In this issue, Richard Russell discusses several topics that are very important to every Dow Theorist.
First, Russell states that:
“…history shows that when bull (or bear) markets really begin, Dow Theory signals are generally greeted with derision, skepticism, and scorn-rather than wholesale agreement!” page 1
This comment is in response to the Dow Theory bull market signal that was given on August 2, 1978. In this case, Russell felt there wasn’t enough skepticism by market participants to warrant a need to trust the signal. I’m guessing that after 12 years of a secular bear market any good news about the market would appeal to the glass half-full crowd.
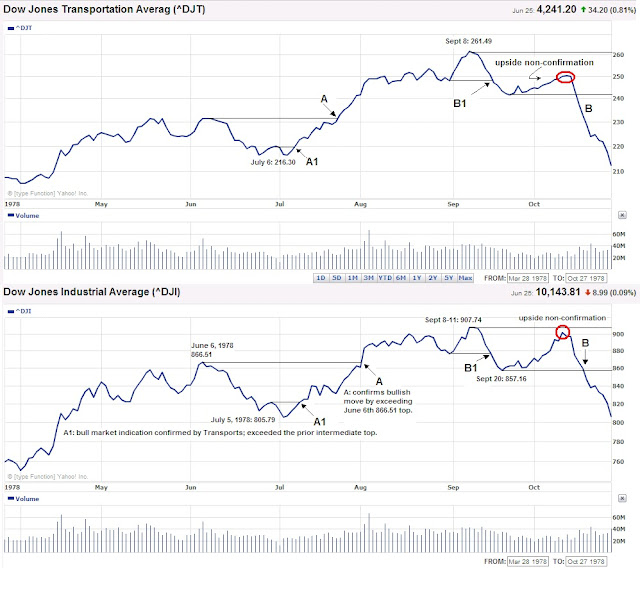
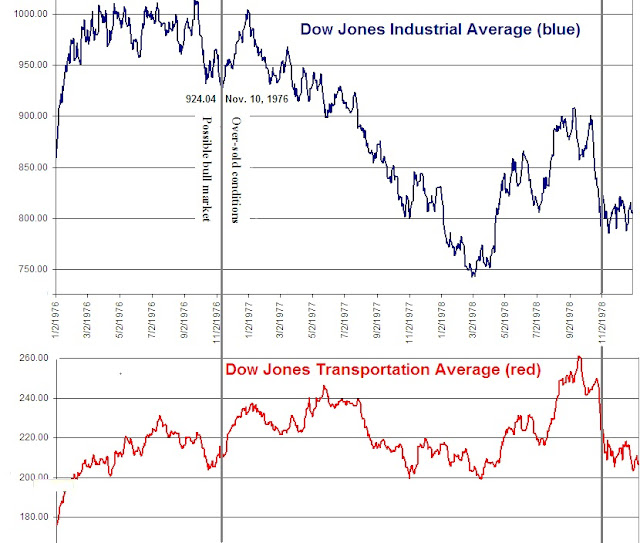
Letter 742 also has a chart (located here) of the Dow Jones Industrials, Transports, Utility Averages and NYSE volume. Upon closer inspection of the chart below, ranging from March 28, 1978 to October 27, 1978, you can find two confirmations of a bull market and one confirmed bear market indication as part of Dow Theory.

According to Russell, point A (August 2nd), on the Dow Industrials, was a false secondary peak or bull market indication. However, it should be noted that when the Industrials went above the June 29th peak of 821.64 (point A1) on July 21st it was a clear indication that the index was going to retest the previous high at point A.

After the bull market move upward a bear market indication was given when the Industrials and Transports fell below point B1 that corresponded to the August 31st low of 876.82 and 248.78 respectively. A bull market non-confirmation was indicated (red circles) in the fact that neither index could exceed the high of September 8, 1978.
Let’s do the math for a moment, point A1 gave a buy signal plus point A’s confirmation of the buy signal equaled a 9.62% rise by the time the market gave the bull market non-confirmation at Dow Industrials 900. The same timing applied to the Dow Transports would have equaled a gain of 13.64%. To my mind, this was in line with our view that any return close to 10% in less than a year is an acceptable amount to trigger a sell of any stock.
Russell also repeats a common attribute that he seeks in the market before considering going “all in.” Russell says:

“I noted that every bull market in history had started from an over-sold base, but that this market had not seen a over-sold condition since late-1976.” Page 1.

In this remark, I have two thoughts that immediately come to mind which is reflected in the chart below. The first is that even after the 1974 bottom there was another time (1976) that was “most ideal” to buy stocks at over-sold levels, according to Russell. However, even though late-1976 was experiencing oversold conditions, it certainly didn’t mean that further declines were out of the question. After the ’76 bottom, the Dow Industrials had a short rally and then fell as low as 742.12, a decline of 19.69% from the 1976 lows, by February 28, 1978. Finally, the view that an over-sold base is a condition necessary for a bull market may not be accurate.

On page 2 Russell said:

“Right now, I want all my subscribers to stay out as per my instructions in Letter after Letter.”

This suggests that after the January 1975 buy signal given by Russell, it was very difficult to keep a long-term position even though it was the absolute best time to “buy and hold” stocks.

“The violence and rapidity of this smash has few precedents in stock market history.” Page 2.

When calculated to the November 14, 1978 low, the decline from September 8, 1978 equaled a drop of 13.5%. To me this doesn’t seem like all the much of a decline.

“Somewhere in the period ahead, we are going to see the real ‘third phase bear market action’ in the Dow and most other stocks. True, during 1973-1974 the majority of stocks were pulverized in a slide that was comparable to 1929-32 in many ways. But the Dow lost less than 50% of its value at that time. My guess is that before the third or final phase of this bear market is over, we are going to see the Dow at drastic new lows, we’re going to see dividends cut across the board, we’re going to see very high interest rates, and we’re going to see something that this generation has never seen before-wholesale liquidation of debt in all sections of the economy, private, corporate and perhaps even government.” Page 2

“Each time it looks as if the ‘plug is going to be pulled,’ the bear market (with the help of huge infusions of monetary inflation from the Fed) pulls itself out of the hole.” Page 2

Russell was waiting for the third phase of the bear market. According to Russell, the Fed was holding the market up with the trade-off being higher inflation. My thinking is that a crash didn’t occur simply because the Fed was willing to accept higher inflation as a substitute for a crash. In addition, if the markets were to get a crash and record inflation at the same time it would be exceptional situation. The third phase decline that Russell expected never seemed to materialize on the scale of 1973-74 or greater.
Other Notes in Letter 742:
  • E. George Schaefer’s investment performance from 1949 to 1966.
  • James Dines book the “Invisible Crash”
  • MC Horsey’s chart of an inflation adjusted Dow since 1960
  • Benjamin and Herbert Stein’s book “On the Brink” with reference to, of all things, the Chinese cornering the gold market
More:

Richard Russell Review: Letter 745

Dow Theory Letters Issue 745 was written on December 6, 1978.  At the time, the Dow Jones Industrial Average was indicated to be at the 811.42 level.  What stood out the most to me was the fact that Richard Russell made very clear commentary on the price of gold and the direction of stocks.  Russell made the following commentary:

"It [gold/stock ratio] is telling us that for the foreseeable future (until the next signal), if we do anything we should do it in stocks." page 3.

Anyone familiar with the stock market in 1978 would know that if you had bought a handful of stocks and didn't sell them until 10 years later you would have had a compounded annual growth rate of 8.73% (this takes into consideration the crash of 1987).  Russell's comments on being in stocks would have seemed to be very much on target.  However, it is his aversion to gold at this time that seems to contradict his earlier comments on gold.
In Letter 742 dated November 1, 1978, Richard Russell said the following about gold:
"Slowly, very slowly, it's dawning on the world that we're witnessing one hell of a bull market-in gold. I've been writing pages and pages about gold in each Letter, trying to get new subscribers in the metal (or the coins), trying to get older subscribers to STAY in gold.  Happily, a large percentage of my subscribers are now sitting with large gold positions.  And the paper profits (in terms of dollars) are mounting." page 5.

This commentary seems odd because in Letter 745, Russell goes on to say:

"At any rate, it is a bearish omen when the [gold] open interest stays high in the face of a persistent decline, and that is what has occurred." page 6

Russell called himself to task by asking the following question:

"Question: Russell, you were so hot on gold a few months ago.  Gold was 'real money,' you said.  Gold 'would save the system,' you said.  How can you just "turn off" on gold?
"Answer: I haven't turned off on gold, I've turned off on gold at this time.  The market isn't like your wife or your daughter who you love through thick and thin.  We're dealing here with correct procedure and purchasing power.  The fact that I advocate gold-backed currency has nothing to do with the fact that I think gold is in a bear trend over the coming months.  In this business, you had better learn that the trend makes you the money, not the item.  I'd rather buy Cesspools, Inc. if that stock was going up than IBM if IBM is heading down." Page 7
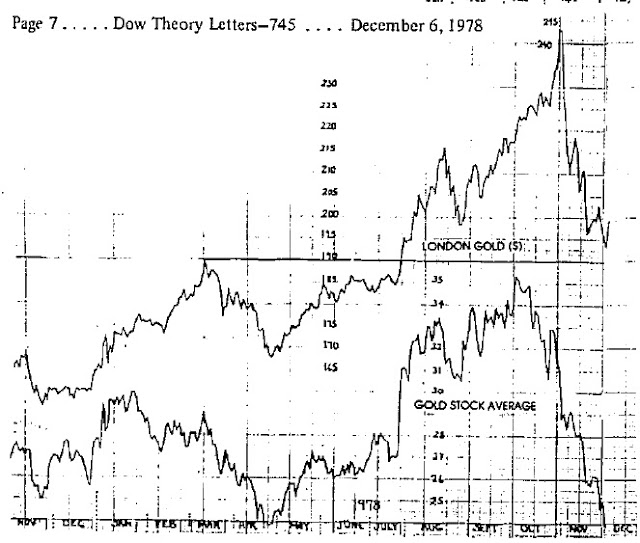
In retrospect, we know that gold went as high as $850 an ounce in January 1980.  However, it is interesting to me that Russell said that a bear trend was approaching "...over the coming months."  In Letter 745, Russell included a chart that compared the London Gold to the Gold Stock Average.


Russell's favorable comments of gold on November 1, 1978 were well off of the highs from the prior month.  However, since Russell was a practioner of Dow Theory and was using the London price of gold along with the equivalent of the XAU gold index to act as a confirming mechanism for the future price of gold, it should have been considered that because the London price didn't fall to the corresponding low set in April of 1978 that there must have been a non-confirmation of the downside trend.  Instead, Russell said the following:
"The GSA [Gold Stock Average] has collapsed, and is now down to its previous low for the year recorded last April.  Bullion has obviously held up better than the gold shares, but so far the downside non-confirmations by bullion have failed to halt the decline.  This kind of action is always indicative of a weak market, and it just seems that there are still too many optimistic gold-holders around." Page 6.
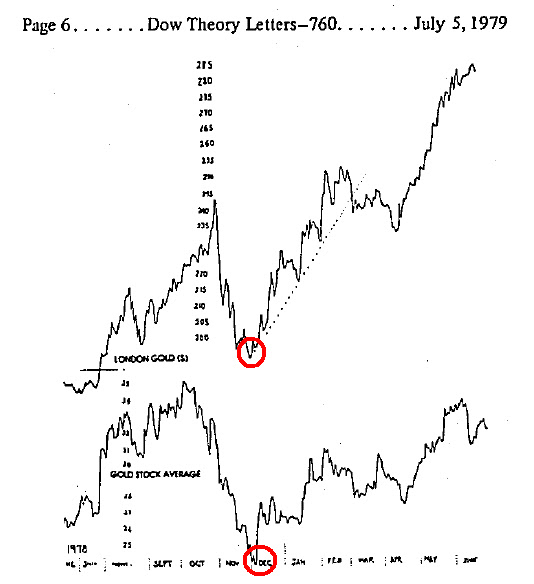
Is it possible that the gold shares are held by the public and speculators (weak hands) and the bullion is held by investors and "institutions" (strong hands)?    Somehow I think this relationship has some value.  I'm just not sure if Russell called this intermediate move correctly.  So I decided to search for an updated version of the London Gold and GSA comparison.  Below is what I found in the July 5, 1979 issue:


It should be noted that the exact bottom in the price of gold and gold stocks (red circles) coincided with the publishing of the December 6, 1978 Letter 745.
Also Worth Mentioning:
  • Russell said that "Greed and options don't mix."  My impression on this remark is that I always thought that the purpose of options is to get exaggerated gains with the trade-off being no equity.  Seems to me that greed and options go hand in hand.
  • Dow Theory Letters are available at http://www.dowtheoryletters.com/
More:

Dow Theory

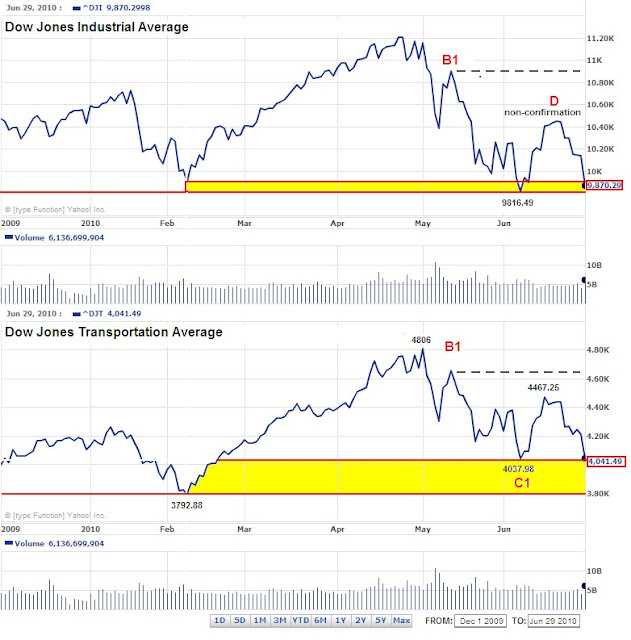
The markets are getting very close to giving us the Dow Theory indication that we need to exit a majority of our positions. Today (June 29, 2010), the Dow Jones Industrial Average closed at 9870.29 which is 53.80 points above the June 7, 2010 of 9816.49. Falling below 9816.49 would be one half of the bear market signal needed to indicate that the market will fall precipitously.

To make matters worse, the Dow Jones Transportation Index closed down today nearly twice as much as the Industrial Index. This indicates that there is significant selling interest. This doesn’t bode well for the Transports because in order to trigger the second half of the bear market signal the index would only have to fall 248.61 points. After today’s decline of 169.52 points in a single day, the remaining 79.09 points needed would not be all that difficult to come by.
The chart below displays a critical reason why I would be bearish on the market at this time. The dashed black line extending from B1 was supposed to be the upside target from point C1 in our last Dow Theory article. However, neither the Industrials nor the Transports were able to come close enough to be misinterpreted as an indication that the bull market run was likely to continue. The inability of the market to breach point B1 was a major non-confirmation according to Dow Theory.
Finally, any simultaneous declines of the Industrials and Transports below the yellow zones on a closing basis would tell us for certain that the bull market has run its course and that an additional correction of 15% on the Dow Jones Industrial Average is likely.

We’re being generous by not considering the June 7th lows for both indexes as the critical points for a bear market indication. For some Dow Theorists, waiting for the Transports low on February 5th is akin to playing with fire. However, we must adhere to the extremes to ensure quality buy and sell signals.

The only holdout is that either the Transportation Index or the Industrial Index gives us a downside non-confirmation by not going below the Feb. 5th or the June 7th lows, respectively. If we get a downside non-confirmation then we will consider selling a small portion of the portfolio on any strength.

Dow Theory

The decline from the intermediate high on May 12, 2010 is now putting in place the prospects for another classic secondary reaction of the Dow Industrials. According to Dow Theory, secondary reactions can range from 33% to 66% of the move upward from the previous low in the last secondary reaction.

In the chart below, you can see that the last secondary low took place at point C on February 5, 2010.

Depending on the point you choose (using the closing price or the intraday low), the Dow reached a low at 9822.83 on February 5th. From the low, the peak in the Dow occurred on April 26th at the intraday high of 11,308.95. Based on the difference of the low and the high, the next potential downside targets are as follows:
  • 10,565.89
  • 10,318.21
  • 9822.83
According to Charles H. Dow, analysis of market action needs to take in any periods that have similar characteristics. In this case, I believe that the Dow is tracing out exactly the same pattern as had happened from January 19th to February 5th. In the points A1, B1, and C1 we can see the pattern that might materialize according to Dow’s theory.
So far, we have already traced out the pattern from A1 to B1. The turn at B1 has laid the groundwork for what we can expect might happen next. The prospect is that we fall below 10,375 and possibly turn upward somewhere around 10,200. However, because of the extreme decline that occurred on May 6th, the Dow could fall as low as point C and still reverse back to the point B1.
If the Dow falls below the blue line at point C, then we can label the market trend as bearish. In addition, all of the moves in the Dow Industrials must be confirmed by the Transportation index. The ideal scenario is that the index goes back to B1 at the very least. However, with all the recent turmoil in the markets, I would not be surprised if we got a bear market signal below point Z.
It should be noted that although I have only discussed a bunch of lines going up and down, the ideas behind the concepts are rooted in fundamentals. The very same fundamentals that formed the basis for investors like Graham, Dodd and Buffett.