Category Archives: Dow Theory

Dow Theory

When it comes to Dow Theory, we have to carefully monitor the market to see if we get a clear sign of a non-confirmation of the trend. A non-confirmation of the trend can take place in many ways and is most prominent when one index goes up while the other goes down. Anyone interested in Dow Theory must be vigilant for signals that might indicate that a reversal of the primary or secondary trend is in the offing.

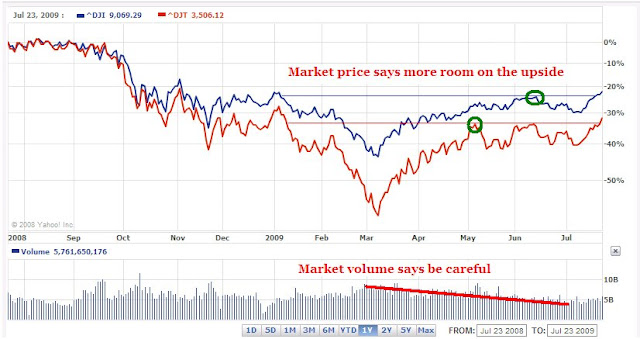
On Friday August 21, 2009, the Dow Jones Industrial Average (^DJI) exceeded the prior high of 9398.19 set on Wednesday August 12th. Unfortunately, the Dow Jones Transportation Index (^DJT) are lagging in the ability to exceed the high of 3774.12 set on Thursday August 13th. The only thing that favors the Transports in this instance is the fact that on a percentage basis the Transports rose 2.58% versus the Industrials 1.67% increase. This indicates that there is relatively strong interest in the Transports. Hopefully this enthusiasm will spill over into today's trading.

If the Transports do not break above the August 13th high then we might be on track for a non-confirmation. A non-confirmation means that the recent upward trend in the market will be coming to an end soon. Conversely, if the Transports break the indicated high while the Industrials move moderately higher then we could be in good shape for the short term.

Dow Theory Q & A

Q.When looking at a chart with weekly Dow prices, how is the weekly price calculated? Is it the Friday close or is it an average of the whole weeks close?

A. In all my readings of Dow Theory, I cannot remember anyone suggesting the use of weekly data for analysis. This doesn't mean that weekly data isn't useful, you might see a consistent pattern that I would otherwise overlook. Dow Theory is supposed to be calculated by using the closing price for both indices on a daily basis. I have bastardized Dow Theory by taking the high and low price of a given period as a way to get a sense of herd mentality or market psychology. This is in contrast to taking only the closing price.

Depending on the source, weekly data is calculated using the opening price from the open on Monday, the high and low price is from whichever days in the week that had either number and the closing price from the Friday close. An average of the week isn't how the weekly closing price is calculated. Touc.


Please revisit Dividend Inc. for editing and revisions to this post.

Dow Theory

The Dow Jones Industrials and the Dow Jones Transports both broke above previous highs on July 23rd. As shown below, the previous highs that were exceeded were the June 12th high of 8799.25 for the Industrials (blue line) and the May 6th high of 3404.11 for the Transports (red line.) Based on the fact that both indexes went to new highs on the same day would normally mean that we are in a new bull market. However, because Dow Theory considers trading volume as well as price, the fact that trading volume has been declining throughout the most recent price rise means that there isn't broad participation by either institutional or retail investors. Therefore, I would label this a cyclical bull market which can change direction to the downside without warning.

The following are the upside and downside targets for the Dow Industrials:

Upside:
  • 9,626
  • 10,302 (fair value)
  • 11,588
Downside:
  • 8192.89
  • 7754.68 (fair value)
  • 7316.49
At this point it becomes challenging to suggest buying any stocks that have already run up in price since the March 9th low. Direct exposure to the Dow Industrials or Transports might be the best way to take advantage of further moves upwards. I prefer the individual stocks with the largest weighting in the respective indexes. However, most investors probably would feel more comfortable with the exchange traded funds (ETF) DIA or IYT. ETFs aren't my cup of tea but they are alternatives to picking individual stocks.
If you've followed my blog for any amount of time then you'd know that I'm all for selling stocks that are relatively high (up from the March 9th low) and researching Dividend Achievers that are at or near a new lows. Right now there are only three Dividend Achievers within 10% of their 1 year low. The companies are Wal Mart (WMT), Bard Corp. (BCR), and Abbott Labs (ABT). I'm not comfortable with Wal Mart as explained in my June 18th posting. Additionally, I don't expect to be investing more than 50% of my portfolio during this period unless a company gets extremely underpriced. Good luck with your investing. Touc.
Please revisit Dividend Inc. for editing and revisions to this post.

Dow Theory

Today the Dow Jones Industrials reached an intraday high of 8927.13. This exceeds my prior Market Barometer target of 8774. For some reason the Industrials are able make higher highs. Unfortunately, the Dow Jones Transports continue to fail to breach the upside target. The Transports fell to 3360.14.

According to Dow's Theory, the action of the Transports is the most resounding evidence of the market's inability to go higher on a sustained basis. Each time the Transports get close to the 3405 level we get a pullback in the market. Additionally, the Transports fall by a greater percentage than the Industrials making it much harder to recover from any declines. We need full participation of the Transports to feel confident about the market direction being up.

I have changed the Market Barometer upside target for the Industrials to 8928. I don't see (showing my limitations) the Industrials going much farther than 8928 without the Transports exceeding the 3405 level. Touc.

Please revisit Dividend Inc. for editing and revisions to this post.