Below is a chart of Microsoft (MSFT) from 1990 to 2022, reflecting Price Momentum data. Continue reading
- Japan
- Market Indicator
- Price Momentum Indicators
- Richard Russell
- Silver
- Speed Resistance Lines
- U.S. Dividend Watch List

Below is a chart of Microsoft (MSFT) from 1990 to 2022, reflecting Price Momentum data. Continue reading
There is a lot of discussion regarding the possibility that the stock market is in a bubble. We have been steadfast in saying that the market is behaving normal.
In two prior articles, we have outlined the long term cycles averaging 16-17 years. The first article “Dow 130,000” dated January 3, 2018, quotes Warren Buffett’s 1999 comment stating:
“I think it's very hard to come up with a persuasive case that equities will over the next 17 years perform anything like--anything like--they've performed in the past 17.”
The second article titled “The Nasdaq Will Surprise Everyone” dated September 6, 2020, we make the following observation:
“Looking at the Nasdaq Composite from 2000 to 2016, we see a period of 16 years which the index did not exceed the prior peak.”
The points made by Buffett in 1999 and in our 2020 article is not based on hopes, in fact, these claims are derived from the history of market data.

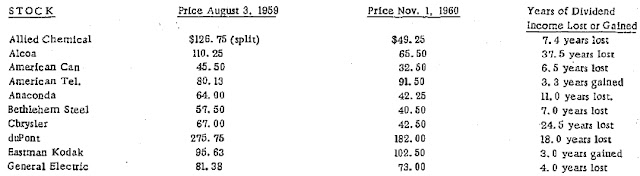
The data from 1802 to 1999, as cited in Richard Russell’s Dow Theory Letters dated January 31, 2001, makes it clear that markets are not acting especially unusual.
In addition to markets acting as they should, so too are the critics of the market’s rise. They are claiming that we are in a bubble that will result in a Great Depression. These critics are also claiming that the market rise is fueled by the Federal Reserve and other central banks.
Unfortunately, this claim of central bank intervention has little merit when viewed from the table of data above, in the period from 1836-1914, when there was no central bank in the United States. Our own work titled “Is the Fed Responsible for the Stock Market Rise Since 2009?” dated February 17, 2014 on the period from 1836-1914 highlights how much central banks had little to no impact on the direction of the stock market.
Recently there has been concern about the over-extended nature of tech stocks, since they have increases substantially in spite of the pandemic. To our mind, it is especially tech stocks that should benefit during the pandemic, since they now are in the best position to sell their software without the need for an actual brick-and-mortar outlet.
The increase in tech stocks has pushed the Nasdaq well above the year 2000 peak. However, as we’ve indicated in our September 6, 2020 article, a rangebound market like the Nasdaq from 2000-2016 should be expected to increase exceptionally.
One way to look at the outcome of rangebound market is to compare one of the top stocks in 2000 to a top stock in the similar stage in the previous cycle peak (1966). Below we have compared the price of IBM from 1967 to the S&P 500 to the performance of Microsoft from 2000 to 2021.
I967-1987: IBM v. S&P 500

Although we could not get the price data from the 1966 peak, the truncated view still represents the 21-year performance needed. Why did we choose IBM to compare to the S&P 500? Because the stock is noted as a “Go-Go” in the 1966-1973 period. This mean that IBM would get unwarranted investor attention in spite of being fundamentally overvalued. Worth pointing out is the fact that at the end of the 21-year (1966-1987) period was met with the stock market crash of 1987.
2000-2021: MSFT v. S&P 500

Microsoft (MSFT) has managed to replicate the “action” of the IBM example against the S&P 500 from 1967-1987. Microsoft didn’t achieve a breakeven in price until 2016 and did not accomplish parity with the S&P 500 until 2018. This is a significant period to go without exceeding the market, suggesting that a level of exceptional outperformance is expected. To top off the 21-year period, the crash in the market in 2020 matches the 1987 crash experienced by IBM after 20 to 21 years after peaking.
Thoughts
Eerily, the market returns for both periods under review are quite similar for both the stocks and the index. A good market analyst would say, “if you compare total return then the returns aren’t the same.” This is accurate. However, as with nominal rates, market participants respond to what they can readily see and not the factual changes seen relating to real rates and total returns.
When viewed from this perspective, it should be clear that what we are currently watching in the market is very much a repeat market cycles and does NOT YET reflect a bubble market.
See Also:
It should not go unnoticed that since the 2009 low, Alphabet (GOOG) and Microsoft (MSFT) have had essentially the same change in their stock price. However, unlike GOOG, Microsoft has paid a dividend the whole time that GOOG has been publicly traded. This means that Microsoft has been crushing it in the department of total returns.
Percentage change without dividends since March 9, 2009:
Percentage change with dividends since March 9, 2009:

Though they don’t directly compete on all levels, GOOG appears to be the superior more formidable upstart, by comparison. Which begs the question, what would the valuation levels for GOOG have been if they paid the same dividend as Microsoft since going public?
Below we explore the levels that GOOG would be considered undervalued or overvalued if it paid exactly the same dividend as Microsoft from 2004 to 2020.
Altimeter
The Altimeter is a calculation of price relative to dividends. It is very consistent over time although less so with high tech companies. For this reason, a tech stock can and does exceed the overvalued targets but is reined in with dramatic declines in short periods of time.

Undervalued and overvalued levels based on Altimeter since 2004 are reflected in the chart below.

According to the Altimeter, as devised by Edson Gould, GOOG is at or near the overvalued range and should not be acquired at the current prices.
Dividend Yield Profile
All dividend paying companies traded in a historical range from undervalued to overvalued and then back to undervalued.
If GOOG paid a dividend that was based on what MSFT had paid since 2004, then GOOG would have an overvalued dividend yield of 0.14% and an undervalued yield of 0.29%.
So far, GOOG is trading near the higher end of the presumed yield range. That doesn’t mean that GOOG is a sell, it just means that the stock isn’t a buy at the current price.

The question is, if GOOG isn’t undervalued, at what price would Alphabet be at if it were yielding a presumed 0.29%? Below we have the expected price targets for Google over the next ten years based on the Altimeter. We’ve chosen the Altimeter because it is so closely aligned with the dividend yield profile.

Conclusions
Alphabet has passed the phase of being the scrappy upstart ready to topple the Microsoft empire. Instead, it is a shared world of domination for both companies.
Eventually, GOOG is going to start paying a dividend. Initially, the dividend will be low on a yield basis but the rate of increases will be exceptional on a year-over-year basis. GOOG will be paying a dividend that is in line with the dividend that is currently paid by Microsoft.
For this reason, we don’t believe that the use of Microsoft’s dividend history applied to Google is such a far out concept. Especially when GOOG has had difficulty in beating the price performance of MSFT since the 2009 low.
see also:
Posted in Altimeter, GOOG, MSFT, relative yield, Yield Profile
Below are the Speed Resistance Lines for Microsoft (MSFT) from 1990 to 2002.

From 1993 to 2002, Microsoft experienced a similar parabolic peak to the 2009 to 2020 period. In that time, MSFT hit all of the downside targets that are generated by our Speed Resistance Lines.
Below we outline the Speed Resistance Lines for Microsoft from 2009 to 2020. Continue reading
The question has come up about whether or not Microsoft (MSFT) has overpaid for LinkedIn (LNKD). We’re going to apply Dow Theory to determine what would have been considered the fair value for LNKD based on the stock price. Next, we're going to see how much or how little MSFT paid for LNKD.
First, we need to establish what Dow Theory considers the fair value. According to S.A. Nelson, fair value is determined when…
"...stocks have recovered after artificial depression and relapsed after artificial advances to the middle point which represented value as it was understood by those who bought or held as investors."
The idea of “…bought or held as investors…” is very important as it reflects individual (or institutional) money that has decided to buy a stock with the expectation of holding for an extended period of time, usually 5 years or more.
Artificial Advance and Depression
When looking at the price movement of LinkedIn, it is easy to identify the artificial advances and depressions. However, to determine the fair value, a price which long-term holders of the stock have, on average, acquired the stock, we look to the middle point.
In order to determine the middle point (fair value), based on Dow Theory, we look at the previous major advance from the low to the high in the stock price. The previous low was $59.07 and the previous high was $276.18. The middle point (also know as the 50% principle) is $167.63.

LinkedIn Fair Value
If fair value for LinkedIn was actually $167.63 and Microsoft agrees to pay $196 per share, that would suggest a premium of 16.92%. How does this crude methodology stack up against institutional analyst assessments of fair value for LNKD? This from Morningstar.com:
“LinkedIn posted a better-than-expected start to 2016 as the firm beat both consensus estimates and management guidance for revenue and EBITDA, with strong performance across all three segments. We reaffirm the company's wide moat rating and our fair value estimate of $155. With shares trading just inside three-star territory in after-market trading, we would wait for a larger margin of safety before investing (source: Macker, Neil. “LinkedIn Starts 2016 By Beating Expectations, Management Remains Focused on Engagement”. Morningstar.com. 4/29/2016. accessed 6/14/2016.).”
Morningstar had $155 while Dow Theory assessed a $167.63 fair value. Although the Dow Theory method seems arbitrary, it is based in sound reasoning which we have covered before on the topic of the 50% Principle.
So, the question becomes not “did Microsoft overpay for LinkedIn?” instead it should be viewed by “how much did Microsoft overpay for LinkedIn?”. Based on Dow Theory, Microsoft didn’t pay much more than the company would have been worth to long term holders of the stock, in this case a premium of only 16.92%.
Posted in 50% principle, Dow Fair Value, LNKD, MSFT, values
Below are the Nasdaq 100 companies that are within 10% of their respective 52-week lows. Stocks that appear on our watch lists are not recommendations to buy. Instead, they are the starting point for doing your research and determining the best company to buy. Ideally, a stock that is purchased from this list is done after a considerable decline in the price and rigorous due diligence.
Below are the Nasdaq 100 companies that are within 10% of their respective 52-week lows. Stocks that appear on our watch lists are not recommendations to buy. Instead, they are the starting point for doing your research and determining the best company to buy. Ideally, a stock that is purchased from this list is done after a considerable decline in the price and rigorous due diligence.
Below are the Nasdaq 100 companies that are within 10% of their respective 52-week lows. Stocks that appear on our watch lists are not recommendations to buy. Instead, they are the starting point for doing your research and determining the best company to buy. Ideally, a stock that is purchased from this list is done after a considerable decline in the price and rigorous due diligence.
Below are the Nasdaq 100 companies that are within 10% of their respective 52-week lows. Stocks that appear on our watch lists are not recommendations to buy. Instead, they are the starting point for doing your research and determining the best company to buy. Ideally, a stock that is purchased from this list is done after a considerable decline in the price and rigorous due diligence.
Comments Off on Nasdaq 100 Watch List: January 11, 2013
Posted in BBBY, DLTR, MSFT, Nasdaq 100 Watch List, TEVA, Teva Pharmaceutical, VOD
Below are the Nasdaq 100 companies that are within 10% of their respective 52-week lows. Stocks that appear on our watch lists are not recommendations to buy. Instead, they are the starting point for doing your research and determining the best company to buy. Ideally, a stock that is purchased from this list is done after a considerable decline in the price and rigorous due diligence.
| Symbol | Name | Price | P/E | EPS | Yield | P/B | % from low |
| VOD | Vodafone Group Public Limited Company | 25.12 | - | -0.55 | 4.1 | 1.11 | 0.68% |
| TEVA | Teva Pharmaceutical Industries Limited | 37.79 | 15.4 | 2.45 | 2.1 | 1.44 | 1.04% |
| ATVI | Activision Blizzard, Inc. | 10.68 | 13.78 | 0.78 | 1.7 | 1.09 | 2.20% |
| BBBY | Bed Bath & Beyond Inc. | 55.66 | 12.71 | 4.38 | - | 3.13 | 2.45% |
| MSFT | Microsoft Corporation | 27.06 | 14.63 | 1.85 | 3.4 | 3.36 | 5.05% |
| SPLS | Staples, Inc. | 11.28 | - | -0.01 | 3.8 | 1.26 | 6.72% |
| INTC | Intel Corporation | 20.64 | 9 | 2.29 | 4.3 | 2.1 | 7.33% |
| DLTR | Dollar Tree, Inc. | 40.05 | 16.09 | 2.49 | - | 5.91 | 7.89% |
| PAYX | Paychex, Inc. | 31.5 | 20.45 | 1.54 | 4.2 | 6.73 | 8.17% |
| NVDA | NVIDIA Corporation | 12.25 | 15.29 | 0.8 | 2.4 | 1.63 | 9.87% |
| ^NDX | NASDAQ-100 | 2,658.05 | - | - | - | - | 17.50% |
Watch List Summary
The last time that Vodafone (VOD) was this close to the low and on our watch list was September 9, 2011 (found here). At the time, our data indicated that Vodafone had a dividend yield of 7.30% and a price to book ratio of 1.01. In two months VOD rose +12% and after two years, the highest VOD was able to rise was $30 or nearly 17% from the Sept 2011 low. For us, this is an indication to be mindful of the fact that high dividend yields are not necessarily the clearest path to exception gains, unless in some cases the investor has the willingness to accept the 10% achieved within 2 months.

Teva Pharmaceutical (TEVA) was on the watch list on September 23, 2011 (found here) when the stock was trading at $35.26. At its highest point in January 2012, TEVA increased +30% from the September 2011 low. However, since the January 2012 high, TEVA has fallen –18% to the current price of $37.79 or +7.18% above the price of September 23, 2011. On September 23, 2011, TEVA sported a dividend yield of 2.10% and a P/E ratio of 10.08. Now, TEVA has a P/E of 15.4 and a dividend yield of 2.10%.

Activision Blizzard (ATVI) was on the watch list on August 12, 2011 (found here) when the stock was trading at $10.71. No sooner than ATVI was on our list that it rose +30% to the November 8, 2011 high. ATVI is now selling at the same price as August 2011, however, the stock has a lower P/E ratio and a lower P/B ratio. If we suppose that the stock has not moved up at all in the last year, this could be considered an undervalued stock.

As is often the case with most stocks, early gains are offset with declines, at least in the first year, which explains why we’re so focused on the 52-week low. Most stocks seem to run in cycles of 1 to 2 years. Stocks that fall to a new low after one year should be at or below the price from the prior year. Stocks that fall to a new low after 2 years could be significantly above the low of two years prior but a 52-week low.
Watch List Performance Review
In our ongoing review of the Nasdaq 100 Watch List, we have taken the stocks from our list of December 16, 2011 (found here) and have checked their performance one year later. The companies on that list are provided below with the closing prices from December 16, 2011 to December 14, 2012.
|
Symbol
|
Name |
2011 | 2012 | % change |
| BMC | BMC Software, Inc. | 33.17 | 40.18 | 21.13% |
| VMED | Virgin Media Inc. | 20.95 | 36.07 | 72.17% |
| CTRP | Ctrip.com International, Ltd. | 23.1 | 21.15 | -8.44% |
| SYMC | Symantec Corporation | 15.46 | 18.68 | 20.83% |
| BRCM | Broadcom Corporation | 28.72 | 32.06 | 11.63% |
| Average | 23.46% | |||
| NDX | Nasdaq 100 | 2,238.18 | 2,658.05 | 18.76% |

The performance of the top five stocks from the December 16, 2011 watch list was reasonable. However, despite the outcome after a year, all five of the stocks achieved +20% gains within the first three months.
The question of retaining profits on quality dividend companies through the selling of a position seems to counter the whole point of dividend investing. After all, aren’t you supposed to allow the dividends to compound? In a small way, we described one approach and our rational for selling quality companies after small gains in yesterday’s article (Our Primary Concern: Retaining Profits).
However, there is another way to view the rationale behind selling a dividend stock after a “fair profit.” In the early years of the Dow Theory Letters, Richard Russell would often cite a Robert Rhea quote about the impact of a stock decline. Rhea said:
“’Buying in bear markets is merely gambling and not very good gambling at that. Why not have cash instead of investments in bear markets? Why insist that one cannot afford to forego investment income when one day’s price shrinkage may cancel several years’ dividends?’”
 |
| Source: Richard Russell, Dow Theory Letters, http://www.dowtheoryletters.com/ |
Because stocks are not required to return principal with a stated yield as with many bonds, there is no assurance that the price will recover to the level that a purchase was initiated. Therefore, receiving short-term income on a dividend stock, although a necessary source of income for retired individuals, the prospect exists that an investor could end up with only a portion of the principal instead of the intended income plus principal.
The lack of assurance of principal and income with dividend stocks is why we believe people have become disenfranchised with technology stocks like Microsoft (MSFT) and Cisco Systems (CSCO). If they’ve invested in the stocks with the belief that they’re in it forever, when the decline comes, absent any dividend, there is little recourse or hope of recovering lost funds or keeping up with inflation.
Even new investors to Microsoft and Cisco Systems, aware of their bold promises in 1999 and subsequent failure to deliver in 2011, are asking themselves, “is it really worth facing the prospect of no return?” These questions are being asked when in some instances, especially with Microsoft, the timing probably couldn’t be better (especially now that they’re paying a dividend). Our supplementary comments on Microsoft can be found here.
While we subscribe to the Graham/Buffett principles of investing (buying for the long-term, you’re buying a business, concentrate on values, etc.) we assume that since there are only a handful of billionaires hewn strictly from investing in stocks, we might do well to hedge our thinking and strategy.
Finally, further analysis of Robert Rhea’s claim on not being invested at all during bear markets is something that is at odds with Charles Dow and we’ve decided is not appropriate or necessary. From our experience, bear markets are no guarantee of losses in your portfolio. Charles H. Dow, founder of the Wall Street Journal, has said that:
"Even in a bear market, this method of trading will usually be found safe, although the profits taken should be less because of the liability of weak spots breaking out and checking the general rise."
Schultz, Harry D., A Treasury of Wall Street Wisdom, Investors' Press, (New Jersey, 1966). p. 12. Additional commentary here.
Evidence of the fact that bear markets don’t always equal destruction of wealth, while going long stocks, is demonstrated in our 2007, 2008 and 2009 performance review. Naturally, 2008 is not expected to be replicated (having gains, while going long only, during a market decline of 40% or more). However, we do know that being all in or timing the market to be all out during bear markets shouldn’t be the goal. The goal, from our perspective, should be the preservation of gains whenever possible.
Posted in CSCO, Dow Theory, Harry Schultz, MSFT, Richard Russell, Robert Rhea
| Symbol | Name | Price | P/E | EPS | Yield | P/B | % from Low |
| CSCO | Cisco Systems, Inc. | $18.85 | 14.26 | $1.32 | 0 | 2.26 | 1.56% |
| AMGN | Amgen Inc. | $52.24 | 10.91 | $4.79 | 0 | 2.04 | 3.94% |
| CEPH | Cephalon, Inc. | $58.63 | 11.13 | $5.27 | 0 | 1.68 | 6.60% |
| TEVA | Teva Pharma. | $51.89 | 14.16 | $3.66 | 1.70% | 2.13 | 10.43% |
| ATVI | Activision Blizzard, Inc | $11.07 | 33.55 | $0.33 | 1.50% | 1.3 | 10.81% |
| CELG | Celgene Corp. | $53.47 | 28.44 | $1.88 | 0 | 4.79 | 11.35% |
| EXPE | Expedia, Inc. | $20.96 | 14.36 | $1.46 | 1.30% | 2.15 | 14.54% |
| MSFT | Microsoft Corp. | $27.06 | 11.55 | $2.34 | 2.40% | 4.72 | 19.05% |
| MICC | Millicom Intl. Cellular | $90.27 | 5.92 | $15.24 | 2.60% | 3.06 | 19.86% |
Watch List Performance Review
| Symbol | Name | 2010 | 2011 | Change |
| APOL | Apollo Group | $56.92 | $45.82 | -19.50% |
| ERTS | Electronic Arts | $16.75 | $19.28 | 15.10% |
| FSLR | First Solar | $116.00 | $168.22 | 45.02% |
| ATVI | Activision | $10.79 | $11.07 | 2.59% |
| PPDI | Pharma Prod. | $21.20 | $27.97 | 31.93% |
| SRCL | Stericycle | $54.30 | $87.38 | 60.92% |
| GENZ | Genzyme | $55.97 | $75.38 | 34.68% |
| GILD | Gilead | $48.84 | $39.30 | -19.53% |
| Average | 18.90% | |||
| NDX | Nasdaq 100 | 1823.32 | 2392.47 | 31.22% |