
- Japan
- Market Indicator
- Price Momentum Indicators
- Richard Russell
- Silver
- Speed Resistance Lines
- U.S. Dividend Watch List
Category Archives: values
Dow, Hayek, and Graham: Price as Knowledge
Price conveys knowledge, that is the conclusion of Russ Roberts in an EconTalk podcast with Don Boudreaux dated October 28, 2013.
More specifically, Roberts was citing the work of F.A. Hayek’s “The Use of Knowledge in Society” dated 1945 and concluded that “price conveys knowledge” is the overall point of the paper.
Additionally, F.A. Hayek says:
“It is more than a metaphor to describe the price system as a kind of machinery for registering change...”
No reputable economist would want to associate their work with the actions or intentions of a speculator or investor. However, Charles H. Dow, co-founder of the Wall Street Journal and namesake of the Dow Jones Industrial Average, has said as much about price only 43 years before the work of F.A. Hayek.
On February 25, 1902, Dow said:
"The one sure thing in speculation is that values determine prices in the long run. Manipulation is effective temporarily, but the investor establishes price in the end. The object of all speculation is to foresee coming changes in values. Whoever knows that the value of a stock has run ahead of price and is likely to be sustained can buy that stock with confidence that as its value is recognized by investors, the price will rise (Dow, Charles H. Review and Outlook. Wall Street Journal. February 25, 1902.)."
This aligns with F.A. Hayek’s claim that:
“…the shipper who earns his living from using otherwise empty or half-filled journeys of tramp-steamers, or the estate agent whose whole knowledge is almost exclusively one of temporary opportunities, or the arbitrageur who gains from local differences of commodity prices, are all performing eminently useful functions based on special knowledge of circumstances of the fleeting moment not known to others.”
As Dow Theorist Richard Russell has repeatedly said, the only constant is change. The work of Charles H. Dow reminds investors that the “special knowledge of circumstances” around price helps to determine values, which are constantly changing. This explains why:
“…the major consideration for the investor is not when he buys or sells but at what price (Benjamin Graham, David L. Dodd, Sidney Cottle. Security Analysis, Fourth Edition. 1962. Page 70.).”
Graham would never tell an investor to time the market. However, a “special knowledge of circumstances” would compel an investor to determine a price (based on values) that is appropriate for consideration. This period for consideration is usually a “fleeting moment not known to [many] others.”
The work of Charles H. Dow covers almost all of the topics discussed by Hayek and Graham and thirty years beforehand.
More:
-
Stocks to Consider with specific levels of undervaluation
Posted in Charles H. Dow, Dow's Value Theory, Graham and Dodd, Hayek, values
Payout Ratio Studies: Procter & Gamble
It has been our observation that a company with a history of dividend increases over a full economic cycle (ideally more) will exhibit a characteristic of being especially undervalued when the stock has a high dividend payout ratio. In this posting, we’ll show how a well established company like Procter & Gamble (PG) can generate a high dividend payout ratio and exceptional total returns compared to low dividend payout ratios and mediocre investment returns.
Posted in PG, relative, relative yield, values
Dow Theory: Did Microsoft Overpay for LinkedIn?
The question has come up about whether or not Microsoft (MSFT) has overpaid for LinkedIn (LNKD). We’re going to apply Dow Theory to determine what would have been considered the fair value for LNKD based on the stock price. Next, we're going to see how much or how little MSFT paid for LNKD.
First, we need to establish what Dow Theory considers the fair value. According to S.A. Nelson, fair value is determined when…
"...stocks have recovered after artificial depression and relapsed after artificial advances to the middle point which represented value as it was understood by those who bought or held as investors."
The idea of “…bought or held as investors…” is very important as it reflects individual (or institutional) money that has decided to buy a stock with the expectation of holding for an extended period of time, usually 5 years or more.
Artificial Advance and Depression
When looking at the price movement of LinkedIn, it is easy to identify the artificial advances and depressions. However, to determine the fair value, a price which long-term holders of the stock have, on average, acquired the stock, we look to the middle point.
In order to determine the middle point (fair value), based on Dow Theory, we look at the previous major advance from the low to the high in the stock price. The previous low was $59.07 and the previous high was $276.18. The middle point (also know as the 50% principle) is $167.63.

LinkedIn Fair Value
If fair value for LinkedIn was actually $167.63 and Microsoft agrees to pay $196 per share, that would suggest a premium of 16.92%. How does this crude methodology stack up against institutional analyst assessments of fair value for LNKD? This from Morningstar.com:
“LinkedIn posted a better-than-expected start to 2016 as the firm beat both consensus estimates and management guidance for revenue and EBITDA, with strong performance across all three segments. We reaffirm the company's wide moat rating and our fair value estimate of $155. With shares trading just inside three-star territory in after-market trading, we would wait for a larger margin of safety before investing (source: Macker, Neil. “LinkedIn Starts 2016 By Beating Expectations, Management Remains Focused on Engagement”. Morningstar.com. 4/29/2016. accessed 6/14/2016.).”
Morningstar had $155 while Dow Theory assessed a $167.63 fair value. Although the Dow Theory method seems arbitrary, it is based in sound reasoning which we have covered before on the topic of the 50% Principle.
So, the question becomes not “did Microsoft overpay for LinkedIn?” instead it should be viewed by “how much did Microsoft overpay for LinkedIn?”. Based on Dow Theory, Microsoft didn’t pay much more than the company would have been worth to long term holders of the stock, in this case a premium of only 16.92%.
Posted in 50% principle, Dow Fair Value, LNKD, MSFT, values
Dow Theory: Buying in Scales
Reader J.P. asks:
“What is your recommendation for taking a position. All in, or 1/2 in and average up or down. I can't find anything on this on the website.”
Our Response:
Comments Off on Dow Theory: Buying in Scales
Posted in Dow Theory, Scales, Value Investing, values
Tagged members
Investing in Foreign & Emerging Stock Markets
Subscriber R.G. asks:
“If emerging markets possess such a gambit due to their lack of similar history in the past how can we analyze the markets in order to capitalize on their surges of demand which quickly taper[s] off?”
Our general view on foreign and emerging markets is similar to that of Warren Buffett’s when he said:
“'If I can't make money in the $4 trillion US market, I shouldn't be in this business. I get $150 million earnings pass-through from the operations of Gillette and Coca-Cola. That's my international portfolio’ (source: Ellis, Charles D. Wall Street People. page 56. link here.)”
There seems to be little need to invest in foreign or emerging markets. However, if there is a desire to invest in foreign markets then Dow Theory provides a reasonable template for how to approach investing in such a market. In a section titled “Dow's Theory True of Any Stock Market,” William Peter Hamilton says the following:
“The law which governs the movement of the stock market, formulated here, would be equally true of the London Stock Exchange, the Paris Bourse or even the Berlin Boerse. But we may go further. The principles underlying that law would be true if those Stock Exchanges and ours were wiped out of existence. They would come into operation again, automatically and inevitably, with the re-establishment of a free market in securities in any great capital. So far as, I know, there has not been a record corresponding to the Dow-Jones averages kept by any of the London financial publications. But the stock market there would have the same quality of forecast which the New York market has if similar data were available. (source: Hamilton, William Peter. Stock Market Barometer. Harper & Brothers Publishers, New York. page 14. link here.)”
When we speak of Dow Theory, we are referring to the emphasis of values, fundamentals in relation to price as they pertain to individual stocks and the stock market. We are putting less emphasis on the strict technical analysis of the equivalent industrial and transportation indexes.
To be clear, because we live in the United States we emphasize investing in the U.S. However, according to Hamilton, it does not matter which country that you’re in, investors should embrace the comparative advantage of living in a country other than the United States and should become experts of value opportunities in that region.
Posted in Dow Fair Value, Dow Theory, Value Investing, values
Virgin Media Gets An Offer and Other Important Lessons
On February 5, 2013, Virgin Media (VMED) was given a buyout offer at $47.87 per share by Liberty Global (LBTYA). Virgin Media is already a member of the Nasdaq 100 Index while Liberty Global was recently added to the same index on December 14, 2012 (see Nasdaq 100 re-rank here).
Virgin Media was featured in our Nasdaq 100 Watch List Summary section on December 16, 2011 (found here). Our worst case scenario for the stock was that it might trade as low as $13.28, it never came to be. In fact, VMED never traded lower and has subsequently gained as much as +117%.

There are a couple of important observations about fundamentals that need to be addressed. First, there weren’t any offers for VMED at the December 2011 low. This suggests that many corporations either cannot identify values at the low or that they are willing to pay nearly twice the price in the name of a “good values.”
According to Liberty Global’s President and CEO, “adding Virgin Media to our large and growing European operations is a natural extension of the value creation strategy we've been successfully using for over seven years.” As much as the CEO of LBTYA talks of the value that VMED will provide, the chart below suggests that this was an ill-timed purchase or could have taken place at a better point in time.

The chart above shows a time range from December 16, 2010 to the present. What the chart indicates is that the best time to buy out Virgin Media was on May 15, 2012. At that time, LBTYA shares were at their height compared to VMED, as LBTYA was trading at more than 2 times the price of VMED. Alternatively, LBTYA could have made a similar deal at multiple points before December 2011.
Today, Liberty Global is only buying VMED at 1 ½ times the February 5, 2013 closing price, which is no bargain. Making an offer for VMED on May 15, 2012 could have saved current shareholders of LBTYA a significant amount of dilution in the stock, as Liberty is going to issue at least 151 million shares to acquire Virgin Media.
Another issue that is worth pointing out is the all too popular valuation metric known as price-to-earnings ratio (definition here). When Virgin Media was on our Nasdaq 100 Watch List on December 16, 2011, the stock was trading at $20.95 with a P/E ratio of 67.58. Today, Virgin Media trades at a P/E ratio of 33, or exactly half of what the stock traded at when the stock was within 1% of the 1-year low. This epitomizes the mixed signal that P/E ratios generate for fundamental investors seeking to identify quality companies as indicated in our article titled “P-E Ratios: Lesson From Conflicting Indications”.
In light of the offer made by Liberty, we’d like to remind you to get your scorecards out because there are going to be at least two new additions to the Nasdaq 100 with the possible departure of Dell (DELL) and Virgin Media (VMED). Look for Netflix (NFLX) to be one of the two stocks added to the Nasdaq 100 index as the stock is twice the price that it was when it was booted from the Nasdaq 100 Index in December 2012, less than two months ago.
P-E Ratios: Lessons From Conflicting Indications
When discussion of market valuation comes up, the mention of price-to-earnings ratios (p/e ratio) is often brought up to possibly explain if the market is overvalued or undervalued. The arguments generally follow along the line of reasoning that when the stock market rises then so too will the p/e ratio which will indicated when the market is overvalued on a relative basis. Alternatively, when the stock market is in a declining trend, the p/e ratio will also decline to historical lows allowing for a good indication of when the market is undervalued. The point usually is that there is a correlating relationship between the rise and fall of the stock market and p/e ratios.
While the line of reasoning regarding p/e ratios and stock market valuation is logical and can easily be demonstrated over a majority of stock market history, there have been periods when an inverse relationship between the stock market and the p/e ratio suggests a shift in market direction. The periods of an inverse relationship should shed light on the challenges and limits of using p/e ratios for determining market valuation. The following are examples of periods where high p/e ratios represented a stock market that either has nearly bottomed or was about to take off and periods when a low p/e ratio indicated that the market was about to trade in a range or decline.
Starting with the first example of an inverse relationship between the S&P 500 and the p/e ratio (data compiled by Robert Schiller; S&P 500 index did not exist before 1957) was the period of 1905 as seen in the chart below.

The short period of time that this conflicting signal occurred was followed by both the inflation-adjusted S&P 500 and the unadjusted Dow Jones Industrial Average being mired in substantial underperformance in the period from 1905 until 1924-27 as seen in the charts below.


According to Robert Schiller’s work, on an inflation adjusted basis, the S&P 500 meaningfully broke above the 1905 level in 1927 while the Dow Jones Industrial Average achieved new heights after 1924. Within this extended period of time from 1905 to 1927, the inverse relationship between the real S&P 500 index and the p/e ratio occurred again during June 1913-November 1914 period, where the index declined while the p/e ratio increased. This was followed by an increase in the real S&P 500 from December 1914 to December 1915 before the overall decline continued to the 1921 low.
The low of the stock market in 1921 was punctuated with the stock market exceeding a p/e ratio of 50 times before going into deficit due to a lack of earnings. This happened to be the time when the Dow Jones Industrial Average was at 65 before going to the 1929 high of 381 and the real S&P 500 at 83 before the 1929 high of 416, as tabulated by Schiller-S&P.
Another significant period when the p/e ratio of the market declined in the face of a rising market was January 1929 to November 1929. During this period, The Dow Industrials increased from 296 to 381 and the real S&P 500 increased from 311 to 416, or 27% and +33%, respectively. The chart below shows the p/e ratio for ALL S&P Industrials in the period from January 1928 to November 1929 (source: Fisher, Kenneth. The Wall Street Waltz. Contemporary Books, Chicago. 1987. page 68-69).

This is an instance where the stock market still had plenty of room to run on the upside in 1928 and much less upside potential as 1929 was coming to an end. The performance of the S&P 500 after this mixed signal was –80%. In the January to November 1929 period, the Dow Industrials saw the p/e ratio decline from 19 to 14.
Punctuating the inverse relationship between p/e ratios and the market’s valuation was the period from 1932 where the p/e ratio for the Dow Jones Industrial Average rose well above 50 and ultimately went into deficit at a time when the stock market, despite the onset of the “Great” Depression, was to move higher and never look back.
The next period of a clear inverse relationship between the stock market and the p/e ratio was from 1934 to 1937 as indicated in the chart of the Dow Jones Industrial Average below.

The culmination of this inverse relationship was the 1937 peak in the Dow Jones Industrial Average which was followed by a -50% decline in the index to the 1942 low. As the market declined from the 1937 peak, the p/e ratio for the Dow Industrials began to rise to above 25 times in 1938. The Dow Industrials, with the p/e ratio catapulting from the low of nearly 14 times in 1937 to over 25 times in 1938, gained +50% from March 1938 to November 1938.
The next period of divergence between the stock market and its respective p/e ratio was from 1960 to 1973 when the Dow Industrials rose from 700 to 1,050 as the p/e ratio declined from 21 times to 11 times. The Dow Jones Industrial Average was not able to meaningfully exceed the 1,000 mark until 1982.

This same scenario has been played out in individual stocks, with the p/e ratio declining as the stock rises and the p/e ratio rising substantially as the stock declines. Our interpretation of these significant “outliers” is that they may render the use of p/e ratios, as a determining factor of market under/overvaluation, relatively challenging. This does not mean that such ratios cannot be useful for valuation metrics. Instead, it suggests that such a consideration should be put into proper perspective with the understanding that there is a limit to the value that price-to-earnings ratios can provide in determining market valuation.
To us, the most important element that needs to be incorporated when considering the p/e ratio is when it didn’t seem to work as expected for the respective stock or index. In the examples given above, the exceptions should prove to be instructive when deciding if a favorite stock or index is over-valued or under-valued.
Posted in Dow Industrials, P/E ratio, S&P 500, values
Our Primary Concern: Retaining Profits
We have frequently claimed that our goal was never to have trading strategy while dealing with dividend paying stocks. In fact, the whole purpose of mining the field of dividend stocks is to increase the odds that we can compound our investment income.
However, a recent example reminds us of the importance of being cognizant that “good” stock selecting isn’t enough. Adherence to Charles H. Dow’s concept of recognizing values and seeking fair profits is critical to long-term success in the stock market.
In the article titled “When Timing Meets Opportunity,” we’ve outlined the importance of timing when selecting stocks. That article demonstrated that a focus on stocks near a new one-year low was about as good as any time for starting investment research. Stocks at a new low represent the best marker for determining values. Keep in mind that our focus is on stocks that increase their dividend every year or members of the Nasdaq 100. Thereafter, an individual would need to run through whichever fundamental and technical analysis necessary to make a decision that seems appropriate. Our philosophy is to consider our portfolio allocation based on what Dow Theory indicates. If we’re in a bull market we have a higher concentration in a single stock. If we’re in a bear market then we have lower concentration in a single stock. In general, this addresses the “value” component according to Charles H. Dow.
The aspect regarding seeking fair profits, another Charles Dow tenet, was outlined in our article titled “Seeking Fair Profits in Investment Portfolios.” That article specifically references quotes by Charles Dow regarding when to take a profit on a stock. Strangely, Dow recommended taking “fair profits” of 5%. The New Low Observer Team is a little more adventurous since we seek 10% or more. However, the point remains that as investors we need to put our expectations in perspective before we commit our money. Not after we’re stuck with large gains or losses.
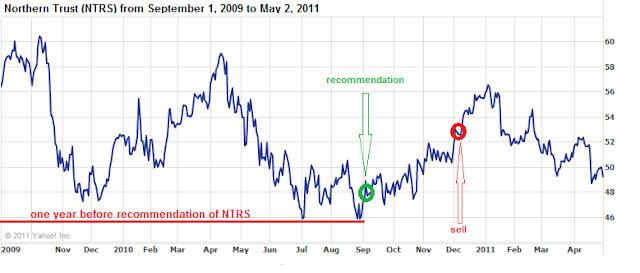
A recent example that we have come across is the case of Northern Trust (NTRS). Northern Trust (NTRS) typifies what usually happens to a well-timed play on values when the appreciation for “fair profits” isn’t understood. Northern Trust was recommended on September 1, 2010. This was almost literally at the one year low from the period of September 1, 2009 to September 1, 2010.
After receiving “only” 10.96% in a period of 64 days, we issued a Sell recommendation on Northern Trust (NTRS) feeling that an annualized gain of nearly 40% wasn’t worth quibbling about. In the sell recommendation, we indicated that we expected the upside target to be first $56 and thereafter $59. Almost as impossible as it seems, Northern Trust peaked at $56.86 and turned down from there. Nearly 7 months on, Northern Trust (NTRS) has ranged from a 19% gains to the current 4%. In addition, this represents a loss of nearly half of the gain that was generated at the time of our sell recommendation.
The situation with Northern Trust typifies our experience and observation when investing in dividend increasing stocks. Great companies with considerable qualitative elements rise for a moment and revert back to their prior low for inexplicable reasons. In regards to the general ebb and flow of individual stocks, we’re primarily concerned with accepting what is reasonable and fair rather than what we typically want which is usually for the stock to got back to the previous one-year high.
As rudimentary as it seems, we feel that an understanding of values and seeking fair profits, as espoused by Charles Dow, is essential to long-term success in the stock market.
- Another great example that illustrates our point more graphically is in the article titled “Gaining More by Limiting our Gains.”
Posted in Charles Dow, Charles H. Dow, Northern Trust, NTRS, seeking fair profit, values
Tagged members
H&R Block Rumors Fly, Attesting to Its Value
Today it was announced that H&R Block (HRB) was a potential buyout candidate by Liberty Tax Service. On the news, HRB stock jumped 4.50% on trading volume that was 2½ times the 3-month average.
In our opinion, it is no coincidence that the buyout offer, or talk of a buyout, from Liberty Tax Service would come in at or near the exact price that we initiated our research recommendation almost a year ago. Most recently, HRB has been on our Dividend Achiever Watch List since May 21, 2010. However, in a SeekingAlpha.com article on May 19, 2009, we suggested that HRB was an ideal research candidate at a price of $13.73.
Our observation has been that although we recommended selling (HRB) literally days after our initial recommendation, thereby missing the nearly 45% increase in the stock price, if we had held the stock as “long-term” investors we’d have little reason to celebrate at an announced buyout. However, our policy of “seeking fair profits” at the risk of potential tax consequences especially for non-deferred accounts is a sound policy when properly implemented.
An important point about our watch list is that companies may not be undervalued. However, we know for a fact that they are not overpriced. Some have accused the NLO team of “bottom fishing” rather than doing “real” analysis of stocks. However, our applied research and practical experience has demonstrated that when you choose to use fundamental analysis is almost as important as the stocks you us it on.
As we’ve duly noted, all the fundamental analysis in the world will do no good when a stock has reached a new high. In fact, using fundamental analysis to justify a stock purchase that has reached a new high or even in a rising trend undermines the credibility of fundamental analysis. In effect, the numbers begin to lie regardless of the question that is asked.
Based on the use of fundamental analysis, when a stock is rising, if the stock goes up in price then the buyer is convinced that their analysis was accurate. If the price falls then the buyer has to justify the reason why the stock should continue to be held typically on a basis that was may have been flawed from the beginning. If the stock falls out of proportion to all expectation then the buyer of the stock is left with the feeling that investing in stocks must be gambling and those who pursue this effort are fools. There are few valuable lessons to be learned when attempting to apply fundamental analysis to stocks in a rising trend.
Applying fundamental analysis to stocks when they’ve reached a new low however, will quickly tell the investor/analyst whether they are wrong or right in their analysis. Not only can the soundness of the analysis be determined very quickly, you can also determine exactly where the analysis is flawed. All theory about the soundness of fundamental analysis becomes “obvious” to anyone who is willing to observe. For us it also doesn’t hurt that we expect, and look forward to, any recommendation or purchase to fall at least 50% as pointed out by Warren Buffet’s right hand man Charlie Munger.
If the deal for H&R Block never goes through, we know that the company is under priced at the current level. It should be noted that our recommendation of HRB last year just happened to be at the lowest point since May 2001. In addition, our meager 11.50% gain in 18 days surpasses the absence of gains (saved for the annual dividend) since our May 19, 2009 recommendation.
We think H&B Block is at fair valuation when it sells for $18.34. HRB would need to rise by 25% in order to reach fair valuation from today's closing price of $14.61. Any price above $18.34 would be considered a premium in our view.
Values According To S.A. Nelson
S.A. Nelson is credited with coining the term "Dow's Theory." In fact, Nelson tried to convince Charles Dow to write a book about his articles in the Wall Street Journal but did not succeed. After failing to get Dow to write a book, Nelson wrote his own based on Dow's writing. The book titled ABC of Stock Speculation neatly lays the groundwork for Dow's Theory to be recognized and interpreted throughout history.
In one excerpt from the book A Treasury of Wall Street Wisdom, Nelson says:
"...stocks have recovered after artificial depression and relapsed after artificial advances to the middle point which represented value as it was understood by those who bought or held as investors."
This means that if an index or stock that has fallen below the halfway point of the previous advance or risen above the halfway point of a previous decline, then the index/stock is either undervalued or overvalued. If the index/stock has fallen close to the prior level of where the advance started and the index/stock is still fundamentally sound then the index/stock could be considered extremely undervalued. Likewise, if the index/stock has risen far above the prior high then it is considered overvalued.
When I start to consider investing in an individual stock, I only want to know if the price of the stock has reached a new 1-year low. From this vantage point, I can determine if the stock is trading at an extreme relative to the halfway point of the previous advance and decline. Again, this approach can only work if the company is generally in fair condition. This means that earnings exist, the dividend payout ratio isn't too high and management has a track record of rewarding the shareholders and etc.
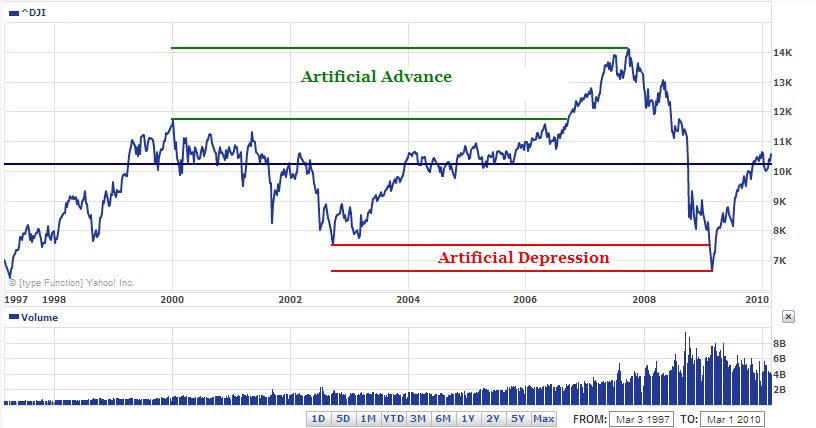
The halfway point of the previous advance or decline is the point at which "long-term" investors would consider the stock or index fairly valued. Traders can take advantage of this fact and use it to their benefit. In the chart below, I show the Dow Jones Industrial Average since 1997.
What is important to notice is that the artificial advance and artificial depression meet at the halfway point of 10,302.31 (dark blue horizontal line.) If drawn backwards to the point when the Dow first went above 10,000, we can see an enormous amount of time spent at or around 10,302.31 (as is currently the case.) This indicates that, for now, "long-term" investors fairly value the market at around the 10.3K level.
Take note of the fact that the Dow volume has fallen as the index has risen since the March 2009 bottom. This is in stark contrast to the bottom in 2003 which had volume more or less in a flat to higher range. As it stands, we have the upside limit to this market at the 11,722 level. Basically, we're still in a bull market rally, or cyclical bull, within the context of a secular bear market.
-Touc
This article was originally published in May 2009 on our former site Dividend Inc.