As the U.S. experiences record low interest rates, it becomes seemingly obvious that inevitably the next major move is up. What isn’t so obvious is what the impact would be on stocks. Some analysts can definitely see the forest from the trees on this matter. However, having this skill doesn’t automatically mean that navigating that forest is all that easy.
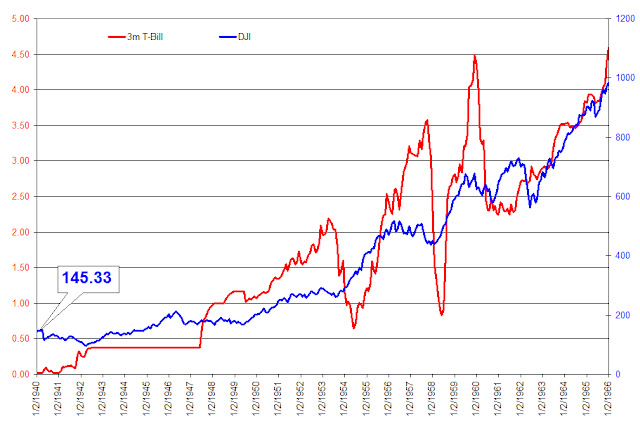
There are two important issues that must be brought to your attention about the forest and the trees in our current investing environment. The first matter (regarding the forest) about rising interest rates is that the bull market in stocks from 1940 to 1966 occurred while rates on 3-month T-bills went from 0.01% in January 1940 to 4.59% in January 1966. The chart below does a side-by-side comparison of rising rates and the Dow Jones Industrial Average. We’re certain that the pervasive thinking is that “this time is different.” However, we wouldn’t want this important fact to remain ignored or glossed over.
The second point (regarding the trees) is that even though inflation is most often represented in the rise of commodity prices, the best investment opportunities may not be in commodity related stocks. To demonstrate this point, we have selected six stocks to compare during a popularly known period of high inflation.
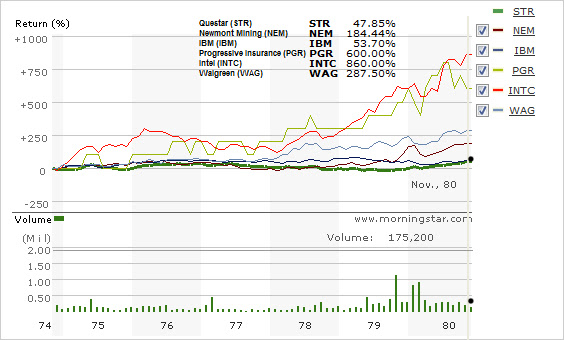
The stocks that we have selected for this comparison are Questar (STR), Newmont Mining (NEM), IBM (IBM), Progressive Insurance (PGR), Intel (INTC), and Walgreen’s (WAG). Two of the stocks are synonymously known as inflation hedges, Questar in the natural gas industry and Newmont Mining in the gold mining industry. The remaining four stocks are a cross-section of almost any economy with insurance, retail, microprocessors and computers being represented.
Unfortunately, our bias towards non-traditional inflation hedges is easily shown when we selected the period from November 1974 to November 1980. However, we wanted to show the performance of stocks, in general, at their lowest point so that there is little confusion about the outcome.
The chart below depicts the total return of all six stocks over the given period in time. Not surprisingly, the stocks most associated with being the best inflation hedge turned out to be among the worst performing. The best performing stock was Intel (INTC) with a gain of 860%. Not far behind Intel was Progressive Insurance (PRG) with a gain of 600%. Walgreen’s came in third with a gain of 287.5% followed by Newmont Mining (NEM) at 184.44% and IBM with 53.7%. Last among the stocks was Questar (STR) with a gain of 47.85%.
While some could rightfully contend that our approach is biased and our conclusions are flawed, we highly recommend that anyone who does their homework and compares the performance of almost any stock with a history of consecutive annual dividend increases to any commodity stock that existed back in the 1970 to 1980 period (on a total return basis), then you’ll be able to arrive at the same conclusions that we did in distinguishing the forest from the trees.
By the way, IBM does not have a long term history of consecutive annual dividend increases which might explain why it couldn’t keep pace in the 1970s.


