
- Japan
- Market Indicator
- Price Momentum Indicators
- Richard Russell
- Silver
- Speed Resistance Lines
- U.S. Dividend Watch List
Category Archives: S.A Nelson
Energy Sector Q&A #OOTT $WTI
A reader asks:
“What could trigger this downside? Just a technical ‘reversion to the mean’?”
Our response:
We are not sure of the catalysts that could trigger the move to the downside. As an example, this from September 7, 2015 on the prospects of where the price of oil would go:
"...lurking in the background is the extreme downside target of 575.41. Since our experience has been that the extreme downside target is commonly achieved, we hazard to guess what would happen globally to the oil market in order to decline to such a low point."
At the time, we had no clue that a pandemic was on the horizon. The only thing we had was the price and the potential for the downside bases on the work of Edson Gould. We can’t dispute the reversion to the mean reality. However, Gould's work on PRICE points to situations that are far beyond just mean reversion.
Another example was our April 26, 2012 posting titled “A Warning for Chesapeake Energy Stockholders.” Based on the work of Edson Gould, the indication was that:
“If CHK falls significantly below the $4.94 level, then the stock has a high likelihood of going all the way $0.67.”
At the time, Chesapeake Energy was trading at $18.10 and ultimately filed for bankruptcy on June 29, 2020.
Gould’s work on price highlights what S.A. Nelson (coined the term Dow’s Theory) has alluded to in the work of Charles H. Dow regarding the tendency for prices to not only mean revert but go to an extreme after achieving the mean. Nelson called it artificial advance and artificial depression. Our 2009 examination of this concept, which has developed greatly since, can be found here.
Thanks for the great question. We really appreciate the feedback.
see also:
-
XOI Index Review September 7, 2015
-
A Warning for Chesapeake Energy Stockholders April 26, 2012
-
Values According to S.A. Nelson November 28, 2012
Posted in Charles H. Dow, CHK, Crude Oil, Edson Gould, S.A Nelson
Dow Theory: Waiting for Confirmation
Today the Dow Jones Transportation Averaged (DJT) closed at a new all-time high.
Posted in Charles H. Dow, Dow Theory, Dow Theory Bull Market indication, S.A Nelson, William Peter Hamilton
Tagged members
Values According To S.A. Nelson
S.A. Nelson is credited with coining the term "Dow's Theory." In fact, Nelson tried to convince Charles Dow to write a book about his articles in the Wall Street Journal but did not succeed. After failing to get Dow to write a book, Nelson wrote his own based on Dow's writing. The book titled ABC of Stock Speculation neatly lays the groundwork for Dow's Theory to be recognized and interpreted throughout history.
In one excerpt from the book A Treasury of Wall Street Wisdom, Nelson says:
"...stocks have recovered after artificial depression and relapsed after artificial advances to the middle point which represented value as it was understood by those who bought or held as investors."
This means that if an index or stock that has fallen below the halfway point of the previous advance or risen above the halfway point of a previous decline, then the index/stock is either undervalued or overvalued. If the index/stock has fallen close to the prior level of where the advance started and the index/stock is still fundamentally sound then the index/stock could be considered extremely undervalued. Likewise, if the index/stock has risen far above the prior high then it is considered overvalued.
When I start to consider investing in an individual stock, I only want to know if the price of the stock has reached a new 1-year low. From this vantage point, I can determine if the stock is trading at an extreme relative to the halfway point of the previous advance and decline. Again, this approach can only work if the company is generally in fair condition. This means that earnings exist, the dividend payout ratio isn't too high and management has a track record of rewarding the shareholders and etc.
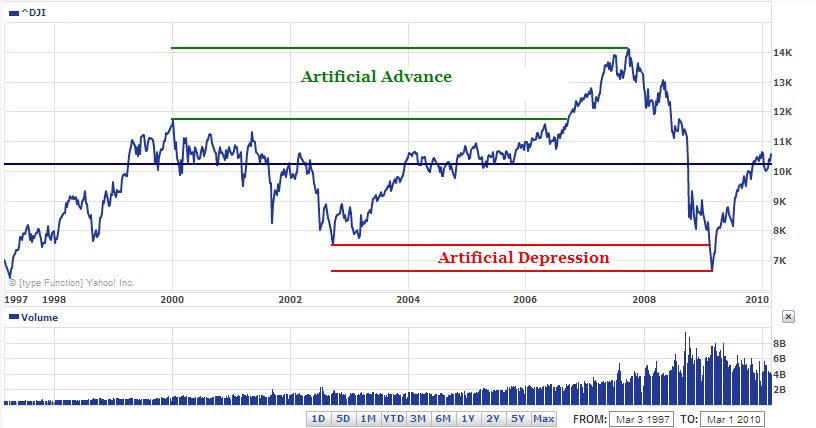
The halfway point of the previous advance or decline is the point at which "long-term" investors would consider the stock or index fairly valued. Traders can take advantage of this fact and use it to their benefit. In the chart below, I show the Dow Jones Industrial Average since 1997.
What is important to notice is that the artificial advance and artificial depression meet at the halfway point of 10,302.31 (dark blue horizontal line.) If drawn backwards to the point when the Dow first went above 10,000, we can see an enormous amount of time spent at or around 10,302.31 (as is currently the case.) This indicates that, for now, "long-term" investors fairly value the market at around the 10.3K level.
Take note of the fact that the Dow volume has fallen as the index has risen since the March 2009 bottom. This is in stark contrast to the bottom in 2003 which had volume more or less in a flat to higher range. As it stands, we have the upside limit to this market at the 11,722 level. Basically, we're still in a bull market rally, or cyclical bull, within the context of a secular bear market.
-Touc
This article was originally published in May 2009 on our former site Dividend Inc.