
- Japan
- Market Indicator
- Price Momentum Indicators
- Richard Russell
- Silver
- Speed Resistance Lines
- U.S. Dividend Watch List
Category Archives: Silver
Gould’s Silver Upside Targets #Silver
In this posting, we update our prior Upside Targets for Silver: Continue reading
Silver: India and China as a Catalyst
In a September 28, 1929 BusinessWeek article titled, “Silver Is Cheap” is the following commentary:
“The price of silver fell to $0.50375 U. S. cents per fine Troy ounce, the lowest price touched since Sept. 18, 1915.”
“India and China are the markets for the silver of the world and, as they prosper or keep the peace, silver rise[s]…”

The argument for India and China as a catalyst for the potential rise in the price of precious metals has been around for a long time. However, the reality is very different from what is hoped for.
see also:
Posted in iShares Silver Trust, Silver
Silver: August 2020
On August 25, 2019, we presented upside resistance targets for the price of silver. In that posting, we said the following:
“The above levels are where the price of silver should experience a reversal of the rising trend. The more dramatic the rise the greater chance that silver will decline -66% of the current rise.”
At two of the three target ranges, the price of silver experienced reversals. In the first instance falling from $19.81 to $11.81, approximately -40%.

The second reversal seems to be playing out from the $29.26 level.
We can’t emphasize enough the fact that Silver isn’t the topic here, it is price. If it trades with a price attached to it on a regular basis then there are reasonable levels at which to expect reversals on the way up or down. The work of Charles H. Dow and Edson Gould inform us on what to focus on when observing price.
Above is an inset chart of the price of Silver with the upside resistance targets. Below, we provide a full chart of the price of Silver with the upside resistance target prices. Also, we review the downside targets based on the run-up from the March 18, 2020 low to the $29.26 high. These targets will assist in managing risk. Continue reading
Rising Secular Trend in Interest Rates
As we have long advocated, the declining trend in interest rates is coming to an end and the secular trend in rates is up. To provide a decent level of analysis on what might happen going forward, we have a comparison of the Dow Jones Industrial Average to the 3-month Treasury from 1934 to the peak in May 1981.

Conventional wisdom says that as interest rates rise then stocks should underperform. However, when contrasted to the interest rate sensitive Dow Jones Utility Average, we see that the index increased +1,321% from the April 1942 low to the March 1965 peak.
We contrast the change in the Dow Jones Utility Average to the 3-month Treasury to highlight what happened to the price of Silver in the same secular trend.

Historically, it is understood that rising interest rates mean rising commodity prices. In the last secular trend, the price of silver increased modestly until, in the late stage of the cycle, all commodity prices go wild. We believe that such a trend is likely to occur again.
Our general conclusion on the secular trend in rising interest rates is that the best alternative in the initial stages is stocks and commodities in late stage of the same trend.
“For the past 25 years the commodity market and the stock market have moved almost exactly together. The index number representing many commodities rose from 88 in 1878 to 120 in 1881. It dropped back to 90 in 1885, rose to 95 in 1891, dropped back to 73 in 1896, and recovered to 90 in 1900. Furthermore, index numbers kept in Europe and applied to quite different commodities had almost exactly the same movement in the same time. It is not necessary to say to anyone familiar with the course of the stock market that this has been exactly the course of stocks in the same period ( source: Dow, Charles H. Review and Outlook. Wall Street Journal.February 21, 1901.)”
Silver Review
On August 25, 2019, we said the following of silver:
“The trend is up, what remains are the buying opportunities (based on the upside targets above) and a lot of patience.”
Since that time, silver has had the following price action.

Clear buying opportunities have opened up in the intervening period from August 2019 to the July 2020 period. In addition, our point that precious metals prices decline during stock market declines has continued to hold up as highlighted in our articles published on November 8, 2008 and September 14, 2014. The mistaken belief that precious metals are the place to be if the stock market “crashes” because they act as a hedge, meaning generally increase, is mistaken.
Our next update on the price of silver will review the upside resistance targets so that those interested in the precious metal can be more selective of where they plan to initiate positions. We hope to continue the tradition of providing the least expensive lesson on the behavior of precious metals.
Posted in Silver
Silver: August 2019
Review
On May 5, 2011, when the iShares Silver Trust (SLV) was trading at $34.39, we said the following:
“What remains is a high level of uncertainty for (SLV) going forward. However, in general, we should see SLV tread water for a brief period of time before falling back to the prior low which began with the current run back in November 2008. Dow Theory suggests that a reasonable buying opportunity would exist at below line B (blue line B). However, we wouldn’t jump in at the slightest move below line B. Instead, we’d like to see the price decline to the dashed blue line at $15.41 or below.”
The chart below highlights the points of interest on the iShares Silver Trust (SLV) based on the peak price, the date we gave downside targets and the first date that the price of SLV closed below our target of $15.41.

Since our May 5, 2011 posting, SLV has not exceeded the prior peak of $47.26. Additionally, SLV has reached the $15.41 level and has outlined a significant basing pattern at that price point. Using the price of silver, we will outline the upside resistance targets based on the December 2015 low. Continue reading
Silver Update: March 2018
On May 5, 2011, when the iShares Silver Trust (SLV) was trading at $33.72, we said the following:
“…we’d like to see the price decline to the dashed blue line at $15.41 or below.”
On March 12, 2017, we said:
“From what we can tell, there are only two remaining downside targets. The first is the January 2016 low at $13.74 or –19.31% from the March 10, 2017 closing price. The final low is at $9.02 or –47.03% from the March 10, 2017 close.”
The closest that the price of silver has come to $13.74 is the July 7, 2017 low of $15.34. Below is the revised update on the price of silver and our expectations going forward.
The Hidden Story of Gold
Gold is currently languishing in a trading range between $1,366 to $1,049. This trading range is thought by many to be a pause before the eventual increase above the previous high at $1,895. After all, the price of gold had managed to decline from $1,895 to the low of $1,049.40, a drop of –44.62%. Part of the thinking of a new high in gold is predicated on the idea that we are entering a phase of rising inflation after years of decreasing inflation from the 1980 peak.
Introduction
If the thinking is that gold is on the cusp of new highs, there is one question that we need to answer. The question is, “What happens with the price of gold in the early stages of an inflation cycle?” What is amazing about this question is that in the early stages of the last inflation cycle from 1939 to 1942, gold was fixed at $35 until 1971.
Never in the history of the United States have investors seen the reaction of the price of gold to the early stages of rising interest rates. In this posting, we’ll attempt to show a reasonable benchmark for gauging what would happen if there weren’t restriction on the price of gold.
How are we going to explore the price of gold in a period when there was not a free floating price for the metal? By examining what the price of silver has done in the period when interest rates rise in response to increasing inflation.
Silver is the perfect means to convey the message of what would have happened to the price of gold if it were allowed to navigate the whims of Mr. Market. While silver is more volatile than gold and prone to extremes it still tells the story of gold when gold did not have a voice.
Interest Rate and Inflation Cycle
We start with the price of silver from the peak in 1925 because, according to Dewey and Dakin's in their 1947 book Cycles: The Science of Prediction, the last peak in wholesale prices, which generally corresponds to interest rates. If you have a beat on interest rates, you can get a better sense of where we are and where we might be going as it relates to precious metals.

Remember, you don’t have to be a fan of cycle theory to appreciate the quality of analysis that reflects what has already happened from a book written in 1947. Calling the peak in 1979 and the trough at 2006, while not exact, is the best way to learn from the past. Looking at the 3-month Treasury, we can see the fulfillment of an entire cycle in rates from 1940 to 2009.

Just think, there is no official data that extends from prior to 1934 to the present. Without this important continuous information, it is difficult to find data that we can compare like-for-like stages in the cycle. However, we do have data from the price of silver in the previous cycle top to the low that corresponds to the low in interest rates and silver. This will be our introduction to the secret history of gold.
Posted in BGMI, Dakin, Dewey, gold, Interest Rate Monitor, interest rates, Silver
Silver: December 2017
Below is a comparison chart showing the price of silver since 2012 and our view on the direction of the “poor man’s gold.”
Silver Update
On May 5, 2011, when the iShares Silver Trust (SLV) was trading at $33.72, we said the following:
“…we’d like to see the price decline to the dashed blue line at $15.41 or below.”
Silver: Downside Targets Met
As early as May 5, 2011, when silver was trading at $35 an ounce, we’ve maintained the view that the prospect of silver, in the form of the exchange traded fund iShares Silver Trust (SLV), falling below $20 was well within the realm of possibility (article here). At the time, we said the following: Continue reading
Posted in Charles H. Dow, Dow Theory, Edson Gould, iShares Silver Trust, Silver, SLV, speed resistance line
Tagged members
Precious Metals Follow-Up
Silver
On February 11, 2012, we wrote a piece on Silver and SLV titled “Correction of Errors on iShares Silver Trust (SLV) Interpretation” (found here). In that article, we said the following:
“The current indications suggest that SLV will fall as [low as] the $22.14 support level. Because silver easily fell to the third support level in the period from 2001 to 2008 (within the context of a precious metal bull market), we expect that the $21.02 is a realistic worst case scenario to watch for. We will consider buying silver and related derivatives at $22.25 and below.
“We view the most recent rise from the December 2011 low as running out of steam.Therefore, the rising resistance level established at $28.70 appears to be firmly in place…for now.”
As seen in the chart below, Silver has declined to the rising support level of $21.02 in many instances but broke through to the downside on February 18, 2013.
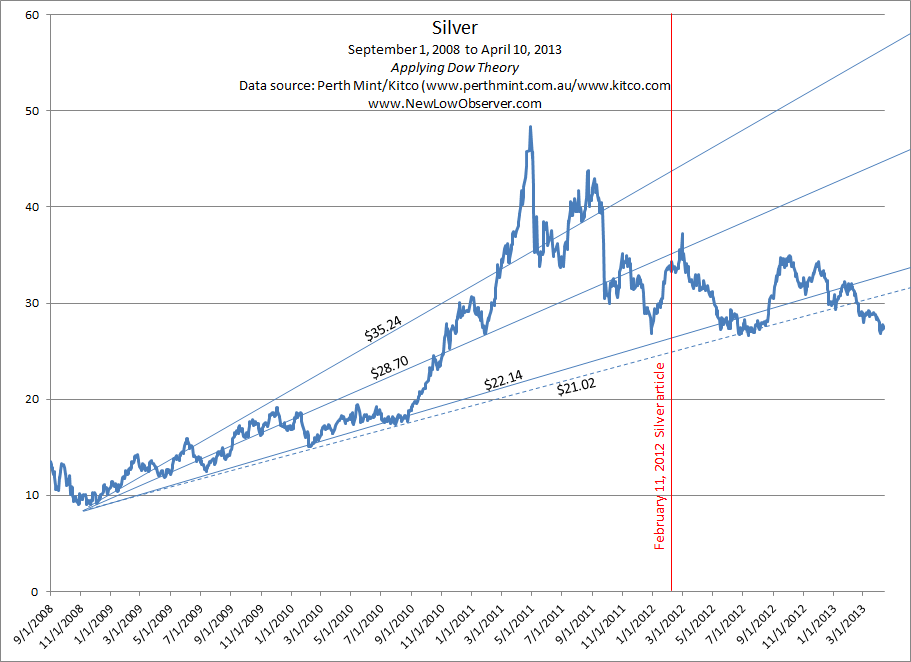
From a technical standpoint, the next downside target for silver may be to the $20 level if the current levels don’t hold. However, under typical circumstances, any point below the $21.02 level is considered undervalued. While it is possible that Silver could fall further we don’t play the short side since we’re in the position to accumulate good values. Values at this point trump the guesswork of when to enter and exit the short. We believe that anyone interested in the upside potential to silver should thoughtfully accept the potential loss of –50% or more and purchase in two stages, once at a predetermine price at or below the current level and a second time at or below the first purchase.
Agnico-Eagle Mines (AEM)
On April 6, 2012, we recommended the consideration of Agnico-Eagle Mines (AEM) (found here). On September 25, 2012, we recommended selling of AEM (found here). While we got a lot of heat from readers of the SELL recommendation, from the less than brilliant to the reasonably rational, our work has proven that precious metal bull markets are vicious and should not be taken lightly.
After our recommendation of AEM on April 6, 2012, the stock rose nearly +40%. When we gave the sell recommendation of AEM on September 25, 2012, the stock increased an additional +11%. However, as of April 12, 2013, AEM is down –27% from our sell recommendation and down –37% from the November 2012 high at $57.33.

Never under-estimate the power of a gold bull market. We hope that our work on this topic has been instructive.
Gold Stock Indicator
Based on our preliminary work, we believe that gold stocks, as represented by the Philadelphia Gold and Silver Stock Index, will reach our long-term gold stock sell indication between July 15, 2013 and November 25, 2013.

This is our best estimate based on the current trajectory of our Gold Stock Indicator. As we get closer to the dates, we will be better able to project the gold stock long-term sell indication with what we believe to be a certain level of accuracy.
This estimate is subject to change if the short-term gold stock buy indication (green diagonal line) is broken to the downside which would bring us back to the long-term gold stock buy indication. The scenario that could easily break the downside trendline is a general stock market decline. Although Dow Theory indicates that this is a possibility, we're waiting for the appropriate confirmation either up or down.
The best example of where the stock market is right now is reflected in the chart below, from our September 21, 2012 Dow Altimeter:

Royal Gold (RGLD) Speed Resistance Lines
In the chart below we’ve provided Edson Gould’s Speed Resistance Lines (SRL).

What is interesting about the above chart is the following:
-
Point A1 to point A2 declined –60%
-
Point B1 to point B2 declined –40%
-
Point C1 to point C2 is a projected decline of –55%
The SRL for Royal Gold at $44.62 doesn’t seem outlandish given what has already occurred in the previous declines from prior peaks. The X marks the first decline after a “minor” parabolic move that was later exceeded on a larger scale to point A1, B1 and C1. Additionally, the X reflects the minimum retracement from the top and has provided consistent support for the price for RGLD.
We’d consider buying RGLD if it declines to either of the support levels of X3 or C2. The movement of RGLD has been consistent with the price of gold (GLD) which is in stark contrast with gold stocks as represented by the Philadelphia Gold and Silver Stock Index (^XAU), as indicated in the chart below.

Posted in Edson Gould, gold, Gold Stock Indicator, RGLD, Silver, SRL