On April 14, 2011, we provided what we believed to be the downside target for the Philadelphia Gold and Silver Index (XAU) in anticipation of the current decline that is taking place using Edson Gould’s speed resistance lines (article here). Although appearing to be very similar, there is a distinct difference between Gould’s resistance lines and Charles Dow’s 1/3 support levels. Gould’s lines have support levels based on 1/3 of high while Dow’s support levels are based on 1/3 the difference between the prior bottom and the most recent high.
In this review we’re going to tackle the trading pattern of the very controversial iShares Silver Trust (SLV). In the chart below we have drawn the Dow Theory support levels where the price of iShares Silver Trust (SLV) is likely to revert to as part of a normal reaction. As a point of clarification, according to Dow Theory, a bear market does not begin until the index or stock falls by at least 1/3 of the prior rise. In the case of (SLV), today’s closing price at $33.72 heralds what is sufficiently below the first support $34.52 and should be considered to be a bear market.
Although this could be considered a bear market based on Dow Theory, we only need to look back to 2008 to know how quickly and viciously a bear market in precious metals can begin and end. The precious metals bear market of 2008 crushed the XAU gold and silver stock index with a 68% decline in eight months. During the same time, the iShares Silver Trust (SLV) declined slightly more that 55%.
Bear market or not, some observations are worth considering. First, in the chart below, the overall pattern of the price decline in (SLV) for the Dow Theory indication numbered 1 (in green) is very similar to the current decline represented with the Dow Theory indication numbered 2 (in blue). Since Dow Theory works on a relative basis, once initiated at a major low, the signals provided are not confused through the distortions of large or small numbers. Headlines about SLV having declines of historic proportions are grossly exaggerated if there is no comparison on a percentage basis and compared to prior declines.
Second, at the beginning of each run at point 1 and 2, the price of SLV bounced off of the middle line B (also known as the 2/3 support line) before going parabolic.
Finally, the decline from each peak was rapid and vicious. One-third of the prior rise was wiped out in a matter of days after the peak.
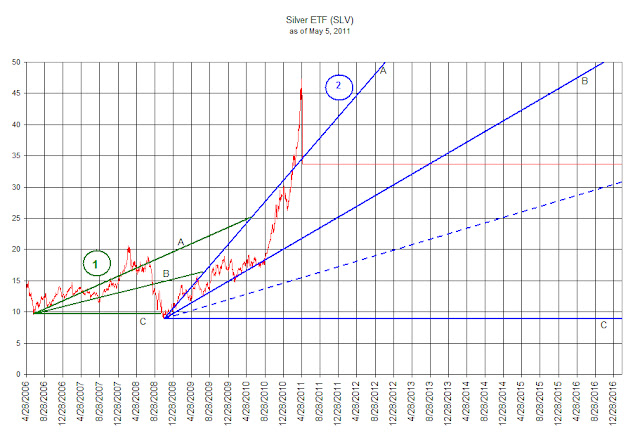
What remains is a high level of uncertainty for (SLV) going forward. However, in general, we should see SLV tread water for a brief period of time before falling back to the prior low which began with the current run back in November 2008. Dow Theory suggests that a reasonable buying opportunity would exist at below line B (blue line B). However, we wouldn’t jump in at the slightest move below line B. Instead, we’d like to see the price decline to the dashed blue line at $15.41 or below.

