Performance Review: Dividend Achiever Watch List of September 25, 2009

We’ve decided to revisit our watch list from one year ago to see if we can extract any valuable lessons from our "research of quality stocks at a new low" approach. The table below shows our watch list from 9/25/09 against 9/21/10.


September 25, 2009
September 21, 2010


Symbol Name Price Div/Shr Yield Price Div/Shr Yield % Gain w/o Dividend % Gain w/ Dividend
WMT WAL MART STORES 49.47 1.09 2.20%
53.57 1.18 2.20%
8.3% 10.5%
CAH CARDINAL HEALTH 27.32 0.70 2.56%
33.11 0.72 2.17%
21.2% 23.8%
WEYS Weyco Group, Inc. 22.51 0.60 2.67%
23.97 0.62 2.59%
6.5% 9.2%
BCR BARD C R INC 78.06 0.68 0.87%
80.48 0.69 0.86%
3.1% 4.0%
NWN NORTHWEST NAT 41.91 1.58 3.77%
46.44 1.66 3.57%
10.8% 14.6%
ABT ABBOTT LAB 47.33 1.60 3.38%
52.15 1.68 3.22%
10.2% 13.6%
PNY PIEDMONT NAT GAS 23.84 1.08 4.53%
28.20 1.38 4.89%
18.3% 22.8%
BDX BECTON DICKINSON 68.50 1.32 1.93%
73.71 1.48 2.01%
7.6% 9.5%
LLY ELI LILLY 32.68 1.96 6.00%
36.33 1.96 5.39%
11.2% 17.2%

Watch List Avg.


10.8% 13.9%


S&P 500 1,044.38 21.58 2.07%
1,139.78 21.84 1.92%
9.1% 11.2%

Dow 30 9,665.19 281.71 2.91%
10,761.03 282.03 2.62%
11.3% 14.3%

As you can see, none of the companies on this list experienced any loss. However, not all high quality dividend-paying stocks are created equal. The gains ranged from 4% to 23.8% with dividend included. Overall, the average gain was 10.8% without dividends and 13.9% with dividends, which is a little better than the S&P 500 but lagged the Dow Jones Industrial average.
There are several interesting things we found. The first thing is that some companies on the list have virtually gone nowhere based on valuation. Wal-mart was and is yielding 2.2% and Bard still yields 0.86%. On one extreme of the spectrum, two companies are now cheaper than they were a year ago, on valuation basis. For example, Piedmont Natural Gas (PNY) is now yielding 4.89% compared to 4.53% a year ago. Yet, the shares of PNY have risen 22.8%. Also in the category is Becton Dickinson (BDX) which is yielding more today than it did last year.
The second finding is that, on average, these companies raised dividend by 7%. This should come as no surprise to those who know the Dividend Achiever list.
Another observation that can be made is the sectors that were at a new lows at the time. From this list, we can assume that the medical/pharmaceutical sectors were out of favor. Of the companies on the list, 5 of 9 belonged to that sector.
The next thing we noticed is that high dividend yields didn't necessarily mean higher returns. Although Eli Lilly (LLY) sported the highest dividend yield, which pushed LLY’s total return from 11% to 17%, it didn't out perform Cardinal Health’s (CAH) total return of 23.8% and Piedmont Natural Gas’ (PNY) total return of 22.8%. As we’ve indicated in our articles and commentary, among high quality dividend paying stocks, the yield isn’t as important quality of the company. Furthermore, what you lack in yield is often made up for in capital appreciation.
The final point is that, although BCR returned just 4% over one year, the shares had risen as high as $90, or 15.30%, in late April 2010. Conservative investors would do well to consider such performance exceptional since the historical return of the market over an extended period of time seldom exceeds 12% especially in less than a year. Similar intra-period performance can be demonstrated in many of the stocks on our list. This is the reason the New Low team is so focused on "seeking fair profits" as described by Charles H. Dow.
In summary, our watch list from one year ago beat the S&P by 270-basis points but fell short against the Dow Industrials by 40-basis points. Naturally, the spread widened without the dividend.
Going forward, as our watch list expands, we expect to show example of only the top five or ten on our list to simplify the examination process. It is our expectation that only 1/3 of the companies that are part of our list will outperform the market over a one year period. However, when the market of 5,000 investment options is winnowed down to what we believe are the best starting points, we think that selecting three out of ten high quality dividend stocks at a new low is reasonable approach.

Email our team here.
The Anatomy of a Bear Market Trade

One Investment Observation that we made is worth reviewing because it encompasses many fundamental techniques necessary for accounting for risk in bear markets. Our recommendation of Bank of Hawaii (BOH) on January 12, 2009 at the price of $37.76 is a prime example of risk adjusted investing. We’d like to think that this was among the boldest and well-planned recommendations that we’ve done. In this analysis, we’ll point out the specific elements that made this Investment Observation so unique.

First and foremost, the recommendation of a bank would seem to be completely out of left field for us since we have always intentionally shied away from the banking sector. Making our recommendation more usual was the fact that we were in the midst of a literal and figurative collapse in the banking industry. In January of 2009, it was hard to tell where the fire wasn’t going to spread next. After all, if you’d seen Fannie Mae, Freddie Mac, AIG, Merrill Lynch, Bear Stearns, Washington Mutual, and Lehman go off the deep end, who is to say that other regional banks weren’t next? However, to see such a well-run institution like BOH closing in on a new low was very hard to resist.

A favorite default reaction for a stock that is near a new low is to look at Value Line Investment Survey for a specific piece of information. In the legend box provided by Value Line, it indicates the most reliable measure of historical mean price that the stock trades at. Sometimes that measure is based on cash flow, earnings, earnings divided by interest rate, book value etc. Regardless of the measure, Value Line’s estimated mean value is quite reliable. If the stock is above or below the mean figure it helps provide a target that we can expect the price to revert to at some point in the future. The quality of the mean figure hinges on the quality of the stock. If for some reason there doesn’t seem to be any consistency in the Value Line estimate then we discard it outright and only use Dow Theory’s fair value as the substitute mean. However, we have found the Value Line estimate to be reasonably reliable for the majority of stocks that we track.

In our assessment of Bank of Hawaii, Value Line indicated that the mean price for BOH was 14 times earnings. At the time, full year 2008 trailing earnings were at $4.06. We only use full year trailing earnings; estimates of the future are not accepted unless they are lower than the previous full year’s data. The figures provided by Value Line gave us a mean price of $56.84 for where we could expect the price of Bank of Hawaii to eventually revert to. Depending on the quality of the company, our dreams are fulfilled if the stock in question goes back to the mean. This is also in accordance with Dow’s Theory that all stocks tend to gravitate to their fair value.

In terms of Dow Theory, we indicated that there were three downside targets. From our analysis of previous Dow Theory moves, we indicated that Bank of Hawaii demonstrated the capacity to retrace “…from the peak to between the 2nd and 3rd retracement levels…” This led us to believe that a purchase of the stock might be required “…between $30.70 and $20.87.” The actual lowest point reached on a closing basis for Bank of Hawaii on March 9, 2009 was $25.70. This was $0.08 less than the exact middle of $30.70 and $20.87.

Our next point of reference was if we were forced to hold the stock for “the long term.” Using this perspective, we surmised that Bank of Hawaii would have to be held for 15 years “...to recoup all [or some] that you have initially invested if you reinvest the dividends.” This is a big leap of faith considering that the dividend could be cut at any time. However, because BOH had demonstrated a consistent history of increasing dividends for over 30 years, it warranted the benefit of the doubt on this matter.

Since the stock price of Bank of Hawaii had been in a rising trend for an extended period of time it was difficult to gain new insight from looking at the chart. However, what we did notice was the surge in volume of shares traded when the stock was nearing a low. Given this pattern, we said:

“All we need now is a good collapse in the price to reassure us of the opportunity to buy. That opportunity might come in the wake of BOH falling below the 52-week low of $36.32 reached on November 21, 2008.”

Shortly afterwards, the stock price experienced an even greater surge in the volume which was accompanied by a steep decline. As mentioned before, Bank of Hawaii (BOH) had a closing low price of $25.70. Being tepid on the idea of holding a stock longer than necessary, we issued a sell recommendation on August 6, 2009.

Under the following scenarios, investor gains would have varied greatly if:

  • bought at the observed price of $37.76 and sold on the recommended sell date, the gain would have been 19.47% on an annualized basis.
  • bought at the low of $25.70 and sold at the top, the annualized gain would be 54%
  • bought at the observed price of $37.76 and held to the present, the approximate gain would be 10.40% on an annualized basis.

Although we outlined exactly what eventually happened, we could never take credit for actually buying at the bottom and selling at the exact top. However, we can show that our ballpark estimates for Bank of Hawaii (BOH) reaching the mean price was fairly accurate. The peak in the price at $53.53 was within 6.18% of our price target of $56.84. Our estimated time to buy the stock between $30.70 and $20.87 was met with a closing low of $25.70 or $0.08 off of the exact middle of the two price points. Finally, we were able to usurp the 4.80% dividend yield by selling the stock with an annualized gain of 19%. We didn’t have to hold the stock “for the long term” to realize such opportunities.

Naturally, there are some critics who suggest that hiding behind “quality” stocks is only a ruse to speculate rather than invest. We understand and grapple with this consideration constantly. We know that most market commentators in the media lionize “The Warren Buffett Way” and vilify traders. Other critics might argue that if we “knew” so much then why didn’t we recommend Citigroup (C) or Bank of America (BAC)? However, our goal was, and always will be, to determine the lowest risk way to invest in the stock market with the widest margin for error with an annualized gain of 10% on each investment.

New Low Team Beats NBER to the Punch

 The New Low Observer (NLO) team has done it again on the economy, stock market and our “guess” of when the National Bureau of Economic Research (NBER) would declare the end of the recession that began in October of 2007.


First and foremost, the NLO team announced on July 24, 2009 (the initiation of the NLO site) that Dow Theory had indicated that we were definitely in a cyclical bull market. This ignores our article on February 11, 2009 titled “Convergence of Extraordinary Forces” that indicated that there would be a bottom in the market around June 2009. According to Dow Theory, a bottom in the stock market implies a trough in the economy as well.


Second, on August 22, 2009, the NLO team indicated that based on the Industrial Production Index (IPI) and the Dow Theory bull market indication the stock market and the economy were headed high.


Finally, along with our call to the end of the recession on August 22, 2009, we predicted that the NBER would “…proclaim June 2009 as the official end to the recession.” The headline out of the NBER today, September 20, 2010, is that “…a trough in business activity occurred in the U.S. economy in June 2009.”


Some of the articles can be verified with the postings on Seeking Alpha.com; which we cannot alter once published. Just look at the approximate date that the article was published since Seeking Alpha does not publish exactly when submitted.


Seeking Alpha Articles:


Subscribers to our site have received all indicated articles with any revisions of our view as appropriate. Anyone interested in subscribing by email can use the following link.

Nasdaq 100 Watch List

Watch List Summary

At the end of the week for September 17, 2010, the top performing stocks from our Nasdaq 100 list for August 15, 2010 are Oracle (ORCL) with a gain of 21.27%, Qualcomm (QCOM) with a gain of 12.07% and Computer Associates (CA) with a gain of 11.57%.
The worst performing stocks from our August 15th watch list are Intel (INTC) down –1.78%, Applied Materials (AMAT) down –1.34% and Activision (ATVI) down –0.46%.
The average gain for the watch list was 6.33%. Of the two stocks that we pointed out as being standouts from August 15th, Garmin (GRMN) exceeded the average return by climbing 9.57% while Paychex (PAYX) underperformed the average gain by rising 3.92%.
A distinction that needs to be made between this week’s list and our August 15th list is that we’ve ranking the companies on this list by those stocks nearest their 52-week low. Our previous list was ranked by those stocks that had the highest dividend yield and within 20% of their respective 52-week low.

Performance Review

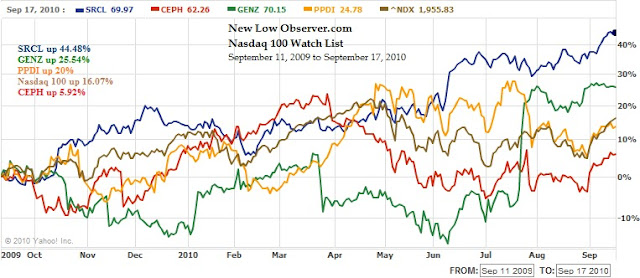
The following is a total return (appreciation plus dividends) performance review of our Nasdaq 100 Watch List from September 11, 2009:
  • Stericycle (SRCL) up 44.48%
  • Genzyme (GENZ) up 25.54%
  • Pharmaceutical Product Development (PPDI) up 20%
  • Cephalon (CEPH) up 5.92%
As a group, the average gain for the stocks mentioned was 23.99%. This is contrasted by the Nasdaq 100 gain of 16.07% in the same period of time.

*chart does not reflect dividend reinvestment for PPDI


Nasdaq 100 Watch List

Below are the Nasdaq 100 companies that are within 20% of their respective 52-week lows. Stocks that appear on our watch lists are not recommendations to buy. Instead, they are the starting point for doing your research and determining the best company to buy. Ideally, a stock that is purchased from this list is done after a considerable decline in the price and rigorous due diligence.

Symbol Name Price P/E EPS Yield P/B % from Low
PAYX Paychex, Inc. 25.95 19.67 1.32 4.80% 6.67 5.27%
INTC Intel Corporation 18.81 11.26 1.67 3.40% 2.3 6.87%
AMAT Applied Materials, Inc. 11.02 24.44 0.45 2.50% 2.03 7.33%
YHOO Yahoo! Inc. 13.89 22.77 0.61 N/A 1.59 7.34%
MXIM Maxim Integrated Products, Inc. 16.91 41.86 0.4 5.00% 2.15 7.91%
GILD Gilead Sciences, Inc. 34.56 10.47 3.3 N/A 4.58 8.93%
ATVI Activision Blizzard, Inc 10.82 41.94 0.26 1.30% 1.21 8.96%
DELL Dell Inc. 12.45 15.74 0.79 N/A 3.92 9.80%
RIMM Research In Motion Limited 46.72 10.24 4.56 N/A 3.2 9.85%
AMGN Amgen Inc. 55.22 11.73 4.71 N/A 2.28 9.87%
DISH DISH Network Corporation 18.77 11.26 1.67 N/A N/A 10.02%
CSCO Cisco Systems, Inc. 21.86 16.46 1.33 N/A 2.82 10.31%
XRAY DENTSPLY International Inc. 30.66 16.55 1.85 0.70% 2.6 10.45%
MSFT Microsoft Corporation 25.22 12 2.1 2.10% 4.76 10.95%
SPLS Staples, Inc. 19.49 17.26 1.13 1.80% 2.2 11.69%
PDCO Patterson Companies Inc. 27.15 14.67 1.85 1.50% 2.3 12.52%
SHLD Sears Holdings Corporation 66.83 27.38 2.44 N/A 0.9 12.87%
GOOG Google Inc. 490.15 21.29 23.03 N/A 3.77 13.03%
LIFE Life Technologies Corporation 46.51 29.91 1.56 N/A 1.97 13.16%
STX Seagate Technology. 11.16 3.55 3.14 N/A 1.95 13.41%
FLIR FLIR Systems, Inc. 27.24 18.52 1.47 N/A 3.25 13.50%
GRMN Garmin Ltd. 29.64 8.95 3.31 5.10% 2.21 13.52%
TEVA Teva Pharmaceutical Industries 53.48 19 2.82 1.20% 2.48 13.81%
FLEX Flextronics International Ltd. 5.55 15.72 0.35 N/A 2.26 14.20%
COST Costco Wholesale Corporation 61.29 21.93 2.8 1.30% 2.43 14.75%
HSIC Henry Schein, Inc. 56.35 15.82 3.56 N/A 2.31 14.77%
CERN Cerner Corporation 79.18 31.31 2.53 N/A 3.83 14.85%
CELG Celgene Corporation 55.25 29.99 1.84 N/A 5.11 15.06%
CA CA Inc. 20.44 13.43 1.52 0.80% 2.02 15.48%
ERTS Electronic Arts Inc. 16.26 N/A -1.06 N/A 1.96 15.63%
VRTX Vertex Pharmaceuticals Incorpor 36.25 N/A -3.53 N/A 9.01 16.00%
KLAC KLA-Tencor Corporation 31.05 25.31 1.23 3.30% 2.32 16.34%
STLD Steel Dynamics, Inc. 15.01 15.73 0.95 2.00% 1.58 16.45%
WCRX Warner Chilcott plc 22.75 11.2 2.03 N/A 2.82 16.55%
LOGI Logitech International S.A. 15.39 22.57 0.68 N/A 2.68 16.86%
CEPH Cephalon, Inc. 62.26 12.48 4.99 N/A 2.09 17.36%
URBN Urban Outfitters, Inc. 34.11 22.19 1.54 N/A 4.26 18.85%
FWLT Foster Wheeler AG. 24.19 10.8 2.24 N/A 3.46 18.99%
FISV Fiserv, Inc. 53.56 17.16 3.12 N/A 2.57 19.55%
JBHT J.B. Hunt Transport Services, I 35.26 26.73 1.32 1.40% 7.56 19.73%
CTAS Cintas Corporation 27.71 19.64 1.41 1.70% 1.67 19.96%

Beckman Coulter (BEC): Pondering the Imponderable

A reader asks:
Will Beckman Coulter (BEC) stock bounce back to $70 in a few months?
Our Response:
To attempt to respond to this question, for the sheer joy of pondering the thought, we first need to define the parameters. First, we need to refine the question by asking, “Will Beckman Coulter (BEC) get to $70 by December 13, 2010?”
Addressing the issue of whether Beckman Coulter (BEC) will get to $70 by December 13th requires an acceptance of the probability this will occur. The last time BEC was at a similar stock price of $45.24 (prior to reaching the $70 level) was on March 17, 2009. From that time, it took 125 trading days to reach $70.03 by September 11, 2009. This means that the stock of Beckman Coulter could reach $70 by March 9, 2011. If the stock were to match the previous trajectory from March 17, 2009 to September 11, 2009, by December 13, 2010, BEC would be at the $57.51 level in the stock price.
However, to put Beckman Coulter’s 2009 rise in perspective, we must remember that the period from March 17, 2009 to September 11, 2009 was the most rampant stock market reaction to the prior 2007 to 2009 collapse. This means that extraordinary forces that were behind the rise in all stocks. It is highly unlikely we’ll have the same forces at play this time around for both the stock market in general and BEC in particular.
According to Dow Theory, BEC is considered to be at fair value when the price is at $56.99. The upside targets are as follows:
  • $52.64
  • $61.33
  • $70.03
At each indicated level, the price of Beckman Coulter would experience major resistance to the upside. This means that the price could just as easily revert to the prior support level.
The great Dow Theorist Richard Russell has indicated on many occasions that a stock’s decline typically lasts 1/3 of the rise. Being selective in our analysis, the peak in BEC on August 18, 2008 at $75 was reconciled on December 12, 2008 when the stock closed at $39.44. This transition from $75 to $39.44 took 83 days. The subsequent peak in BEC took place on or near September 14, 2009; which was a full 270 days from the previous peak on August 18, 2008. In this example, selective as it is, the decline lasted 31%, or 1/3, of the complete cycle.
Now, if we apply the same flawed logic to Beckman Coulter (BEC) going forward, we arrive at a date of September 13, 2011 for the time when the stock reaches the next peak. This does not necessarily mean that the price will be at the same level it once was. In fact, it could be much lower or much higher. The point is, the next peak in the price, whatever it may be, would occur somewhere around September 13, 2011. We’ll throw in the possibility that BEC revisits $70 at the same time next year.
As shareholders of Beckman Coulter (BEC), we expect that the stock should fall at least 50% from the level the stock was purchased at. Naturally, we have the expectation that the stock price will fall between now and December 13, 2010. If the stock price rises to $52.64 then we would be pleasantly surprise. If the stock price rises to $56.99 by the proposed date then we’d be shocked beyond belief. The mere suggestion that the stock could reach $70 in such a short period of time is almost out of our capacity to fathom. We don’t think BEC will reach $70 by December 13, 2010.
Our Summary on Beckman Coulter reaching $70:
  • $70 by March 11, 2011 based on previous $45-$70 cycle(rosy scenario)
  • $57 by December 13, 2010 using $45-$70 trajectory (rosy scenario)
  • Price accomplishes $70 by September 13, 2011 (plausible scenario)
  • Price falls further (likely scenario)

Dividend Watch List

Watch List Summary

On this week's list, the best performing stock from the previous list was a steel and iron supplier, Harsco (HSC) which rose 13.6%. The worst performing stock was H&R Block (HRB) which fell 5%.

Johnson & Johnson (JNJ) is slowly moving away from the top of the list.  Taking JNJ's place is Intel (INTC) which fell 2% since our last update. Intel is trading at just 10x trailing earnings, 9x next year's estimated earnings. The reduction in price was triggered when INTC lowered its guidance and UBS downgraded the stock due to weak PC demand.  This might be a good time to start looking at Intel which currently yields 3.5%. With a target return of 10% annually, Intel only needs to increase 6.5% for investors to obtain the historical average market return. Intel's current valuation is also very close to the 2008-2009 market bottom. Read more about Intel's low valuation here.

Several notable companies on the list are Toosie Roll (TR), Colgate-Palmolive (CL), Beckman Coulter (BEC), Paychex (PAYX), and Norther Trust (NTRS).

September 10, 2010 Watch List

Symbol Name Price % Yr Low P/E EPS (ttm) Div/Shr Yield Payout Ratio
INTC Intel Corp.  17.97 2.10% 10.76 1.67 0.63 3.51% 38%
WST West Pharmaceutical Services 33.65 2.75% 14.69 2.29 0.64 1.90% 28%
TR Tootsie Roll Industries Inc  23.87 2.89% 26.23 0.91 0.32 1.34% 35%
OMI Owens & Minor, Inc. 26.44 3.61% 13.42 1.97 0.71 2.69% 36%
BEC Beckman Coulter, Inc. 45.71 4.00% 21.77 2.10 0.72 1.58% 34%
BCR CR Bard, Inc. 77.31 4.49% 15.75 4.91 0.72 0.93% 15%
CL Colgate-Palmolive Co. 75.18 4.50% 17.94 4.19 2.12 2.82% 51%
DNB Dun & Bradstreet Corp. 68.45 4.76% 14.72 4.65 1.40 2.05% 30%
PAYX Paychex, Inc.  25.85 4.87% 19.58 1.32 1.24 4.80% 94%
NTRS Northern Trust Corp.  47.70 5.30% 15.64 3.05 1.12 2.35% 37%
PBI Pitney Bowes Inc   20.10 5.46% 12.18 1.65 1.46 7.26% 88%
JNJ Johnson & Johnson   59.98 5.49% 12.39 4.84 2.16 3.60% 45%
NFG National Fuel Gas Co. 45.21 5.56% 17.32 2.61 1.38 3.05% 53%
FFIN First Financial Bankshares, Inc.  45.97 5.56% 17.61 2.61 1.36 2.96% 52%
CWT California Water Service Group 35.80 5.89% 19.35 1.85 1.19 3.32% 64%
LANC Lancaster Colony Corp.  45.86 5.96% 11.27 4.07 1.20 2.62% 29%
MSA Mine Safety Appliances Co 23.74 5.98% 21.20 1.12 1.00 4.21% 89%
RNST Renasant Corp.  13.58 6.01% 18.35 0.74 0.68 5.01% 92%
UVV Universal Corp. 37.57 6.25% 7.40 5.08 1.88 5.00% 37%
SBSI Southside Bancshares, Inc.  18.53 6.55% 7.02 2.64 0.68 3.67% 26%
CSL Carlisle Companies Inc. 29.81 6.58% 12.79 2.33 0.68 2.28% 29%
CAG ConAgra Foods, Inc. 21.95 6.81% 13.55 1.62 0.80 3.64% 49%
AWR American States Water Co. 33.35 6.89% 20.46 1.63 1.04 3.12% 64%
UMBF UMB Financial Corp.  33.97 6.92% 14.15 2.40 0.74 2.18% 31%
WFSL Washington Federal, Inc.  15.01 7.44% 14.30 1.05 0.20 1.33% 19%
XRAY DENTSPLY International Inc.  29.87 7.60% 16.15 1.85 0.20 0.67% 11%
HGIC Harleysville Group Inc.  32.34 7.62% 12.20 2.65 1.44 4.45% 54%
BDX Becton, Dickinson and Co. 71.27 7.66% 13.95 5.11 1.48 2.08% 29%
UFPI Universal Forest Products, Inc.  27.78 7.84% 22.59 1.23 0.40 1.44% 33%
HRB H&R Block, Inc. 12.93 7.93% 8.86 1.46 0.60 4.64% 41%
MLM Martin Marietta Materials, Inc. 77.35 8.18% 42.97 1.80 1.60 2.07% 89%
MDT Medtronic, Inc. 33.34 8.25% 10.55 3.16 0.90 2.70% 28%
FRS Frisch's Restaurants, Inc 19.65 8.62% 10.18 1.93 0.52 2.65% 27%
BANF BancFirst Corp.  37.89 8.66% 14.98 2.53 1.00 2.64% 40%
FFIC Flushing Financial Corp.  11.06 8.75% 11.40 0.97 0.52 4.70% 54%
WMT Wal-Mart Stores, Inc. 51.97 8.79% 13.36 3.89 1.21 2.33% 31%
AROW Arrow Financial Corp.  23.86 8.80% 12.30 1.94 1.00 4.19% 52%
HCC HCC Insurance Holdings, Inc. 25.95 8.81% 8.92 2.91 0.58 2.24% 20%
BBT BB&T Corp. 23.65 8.89% 22.31 1.06 0.60 2.54% 57%
SYK Stryker Corp. 46.67 9.20% 15.87 2.94 0.60 1.29% 20%
MSEX Middlesex Water Company  16.12 9.36% 19.19 0.84 0.72 4.47% 86%
XOM Exxon Mobil Corp.   61.20 9.40% 11.81 5.18 1.76 2.88% 34%
CBSH Commerce Bancshares, Inc.  37.52 9.74% 15.25 2.46 0.94 2.51% 38%
SVU SUPERVALU INC 10.63 9.93% 6.52 1.63 0.35 3.29% 21%
VFC VF Corp. 75.51 10.07% 15.07 5.01 2.40 3.18% 48%
GD General Dynamics Corp. 61.13 10.22% 9.78 6.25 1.68 2.75% 27%
BRC Brady Corp. 26.70 10.24% 17.68 1.51 0.70 2.62% 46%
WAG Walgreen Co. 28.96 10.28% 13.92 2.08 0.70 2.42% 34%
TRH Transatlantic Holdings, Inc. 48.62 10.30% 7.74 6.28 0.84 1.73% 13%
IBM International Business Machines 127.99 10.34% 12.10 10.58 2.60 2.03% 25%
RLI RLI Corp. 54.47 10.42% 9.69 5.62 1.16 2.13% 21%
51 Companies


We excluded companies that have no earnings and payout ratios in excess of 100%. Stocks that appear on our watch lists are not recommendations to buy. Instead, they are the starting point for doing your research and determining the best company to buy. Ideally, a stock that is purchased from this list is done after a considerable decline in the price and extensive due diligence.

Because our list has many great companies, we urged investors to filter for companies with less than 50% payout ratio. This should minimized the risk of dividend reductions if earnings are to fall by half. If you understand the companies' history and their ability to pay the dividend, then payout ratios in excess of 50% may be considered. We suggest readers use the March 2009 low (or companies' most distressed level in the last 2 years) as the downside projection for investing. Our view is to embrace the worse case scenario prior to investing. The November 2008 to March 2009 time frame fits that description. It is important to place these companies in your own watch list so that when the opportunity arises, you can purchase them with a greater margin of safety.

Related Article
10-for-the-Money... Really?

Email our team here.

Dow Theory: The Formation of a Line

According to Dow Theory, the formation of a line, the stock market trading in a narrow range, typically portends a major movement in the market once the range is broken through on the upper or lower end of the channel it has traded in. To be specific, Dow Theory indicates that a line is created when both the Dow Jones Transportation and Industrial Averages are in a range of 5% over a period for 8 weeks or more.
 
In the charts below, neither index has exhibited a narrow range of 5% or less. In addition, from a strictly technical basis, it would be difficult to say that a range has not been broken on the upside in March and April of 2010 for the Dow Jones Industrial Average or the downside in July 2010 for both indexes. However, it is challenging to ignore the general range of 10,700 to 9,750 that the Dow Industrials has traded in since late September 2009. Likewise, the Transportation index has traded in a fairly tight range since mid-May 2010.
Saved for the exactitudes of Dow Theory, I believe that we’re witnessing an over-extended “line” as defined by William Peter Hamilton. Hamilton said of lines:
 
Such a narrow fluctuation, to the experienced student of the averages, may be as significant as a sharp movement in either direction.
Rhea, Robert. The Dow Theory. Barron’s (1932). page 82.
This suggests that a range bound market is the equivalent to a stock market crash. It is hard to quantify what the extent of the crash would look like if it took place instead of trading in a range. However, we could compare the range to the crash from October 2007 to March 2009 with the current market in terms of time. In the period from 2007 to 2009, it took approximately 17 months to flush out the weakness. The current market is bordering on 12 months of relative inaction.
 
If this is a correct assessment, then the price of the market must have approached some sort of alignment with the values of the market. Therefore, a rise above the upper end of the line could represent a “sudden” realization that the current market is ridiculously undervalued.
 
Conversely, if the weakness of the market hasn’t been wiped out of the market over the last 12 months then a slump to the downside could be devastating since a verdict indicating that we’re still overvalued would awaken investor’s worst fears about all the headlines of an economy that is getting by on dwindling government (i.e. Federal Reserve) life support.
 
If the pattern of a line formation is not correct then the alternative view could be that we’re witness to a classic head-and-shoulder formation in the Dow Jones Industrial Average with the head being April 2010 and the shoulders being January and August 2010. My suspicion is that, like the pendulum on a clock, the areas in red are only reactions to the prior extremes and therefore offset the otherwise technical relevance of each extreme. Basically, the April-May extremes were counteracted by the July extremes rendering the significance of each period null and void.
 
The further the markets continue in this range the greater the impact it will have once that range-bound action is broken. However, the length of time that has been spent in such a range seems to indicate that we’re due for a breakdown or an explosion if the markets cross below or above the range.
 
This is one instance where the outcome of a 50/50 proposition could have a dramatic effect on the short-term economic decisions of our nation. Politicians vying for re-election will fight tooth-and-nail against outcomes that don’t “appear” positive. With this in mind, it is possible that the only option is to the upside. We say this with a note of grudging acquiescence since we would rather opt for what is restoring and regenerative instead of what is expedient.
 
Related Articles:

Investment Policy Q&A

A Reader Asks:
In reading "lessons learned from our worse picks", the key 'lesson' was 'not adhering to our rules', mainly "one rule is to side-step stocks that have had recent cuts or no annual increase in the dividend."
Yet, Northern [Trust] has had no increases in 3 years (so even before the crash).
I realize that one should not be totally dogmatic in an investment approach. Perhaps a large % of the "good" picks also showed similar dividend lags...but then why would it be "a rule"?
Our Response:
Thanks for the great observation. This site tracks current and former Dividend Achievers. This means that stocks that had a history of dividend increases will likely be included in our investment decisions at some point in the future, even if they don’t have a current history of dividend increases. We track companies that did have a history of dividend increases because cutting the dividend may have been done for strategic purposes.
One matter about the article titled “Lessons Learned From Our Worst Picks” is that we probably didn’t put enough emphasis on how recent a dividend policy has changed. We don’t mind if there isn’t an increase nor does it matter that there is a cut. What matters most is how recent such action took place and for what reason.
In the article mentioned above, we did say the following about cuts that occurred in stocks that we selected:
What we should have done is wait one full year after the cut, or lack of an increase, to determine the viability of the company. Keep in mind that a cut in the dividend isn’t a death sentence. In fact, cutting the dividend might be the best management move to make. However, current shareholders of the company might abandon the stock if they have a policy to hold stocks with a steady dividend (as we advise investors to do.)
Northern Trust (NTRS) happens to be the perfect example of our investment approach in action. Based on the history of dividend increases, Northern Trust was expected to increase the dividend on December 8, 2008. However, the economic environment, as uncertain as it was, did not warrant such actions from the board. The most prudent action was to conserve as much cash as possible.
It is interesting to note that according to Value Line Investment Survey, Northern Trust earned $3.24 per share in 2007 and $3.47 in 2008. Although the cash was available, NTRS made a prudent and accurate decision to maintain, rather than increase the dividend since 2009 earnings came in at $3.16. Despite a drop in earnings in 2009 and the economic turmoil of 2007 to 2009, the book value of NTRS has climbed from $20.44 in 2007 to $26.50 in 2009. A decision on the dividend that was made in 2008 anticipated the decrease in earnings in 2009 is what we should expect for a “well” run organization.
The management at Northern Trust (NTRS) continues to demonstrate a high level of competency that rewards the shareholders and account holders equally. First, by not overreaching as the bubble grew, NTRS avoided jeopardizing the well being of their clients. Second, by taking appropriate actions in response to the “crisis” that swirled around them by not increasing the dividend in order to conserve cash, NTRS positioned themselves to fight another day; which ultimately benefits the shareholders.
Historically, we have been reticent to make any recommendations of companies in the financial services industry, especially banks. However, the last three recommendations of Transatlantic Holdings (TRH), Wesco Financial (WSC) and Northern Trust (NTRS) have demonstrated an exceptional ability to weather the most recent storm.  These characteristics, not increasing or cutting the dividend before a crash, were demonstrated by some of the best corporations with similar dividend increasing histories before the crash of 1929.  This explains why we wouldn't rule out a company that has embarked on a new dividend policy.
Thank you for a great question and for carefully reading our material.

Canadian Dividend Achievers

This list of Canadian Dividend Achievers, published by Mergent's, includes current and former Canadian Dividend Achievers and then ranking the companies based on those closest to the 52-week low as of September 3, 2010. We've updated the stock symbol to connect to the Financial Post, one of Canada's top business publications. You'll find the most complete fundamental information on these companies at the FP website. However, Yahoo!Finance probably has the better long-term charts and historical dividend data. Enjoy.
 
FP Symbol Yahoo Symbol Name Price % from Low
ESI ESI.TO ENSIGN ENERGY SERVICES INC. $11.70 2.81%
IMO IMO.TO IMPERIAL OIL $39.56 4.79%
RBA RBA.TO RITCHIE BROS AUCTIONEERS INC. $19.80 9.39%
GWO GWO.TO GREAT-WEST LIFECO INC $25.35 10.17%
IGM IGM.TO IGM FINANCIAL INC. $40.54 10.43%
POW POW.TO POWER CORP CDA $27.59 10.45%
TLM TLM.TO TALISMAN ENERGY INC. $17.45 11.08%
PWF PWF.TO POWER FINANCIAL CORP. $29.79 11.36%
CTC.A CTC-A.TO CANADIAN TIRE CORP LTD CL A NV $56.83 11.74%
CNQ CNQ.TO CDN NATURAL RES $35.42 13.34%

Watch List Summary 

This week, the Canadian Dividend Achievers, as a group, gained an average of 3.41% since our last review of the same list on August 20, 2010. Among the top three performers were SNC-Lavalin Group up over 9%, Methanex Inc. up 8.18% and Canadian Pacific Railway up 7.91%. SNC-Lavalin has increased 23.35% since early July. Methanex Inc. is up 12.84% since August 26th. Finally, Canadian Pacific Railway is up 15.35% since July 5th.
 
The worst performing Canadian Dividend Achievers since our August 20, 2010 posting were Ensign Energy Services with a loss of –1.71% and Transcontinental Class A shares were down –0.24%.
 
Of the top three stocks nearest the low, Ensign Energy and Imperial Oil are the best investment candidates. From a technical perspective, Ensign and Imperial are within 23% and 20.98%, respectively, of their lowest all time lows. Both companies have unblemished dividend payment histories and are in critical industries.

Robert Rodriguez Review: March 1994

In the Letter to Shareholders dated March 31, 1994, Robert Rodriguez mentions several concepts that are worth reiterating. The first concept addresses the idea of portfolio turnover. In this regard, Rodriguez has the following to say:
The Fund’s annual turnover ratio has generally averaged less than 25%, implying an average hold period of slightly greater than four years for an investment. This has led to a disproportionately high level of long-term versus short-term capital gains distributions, a tax benefit for you.
It is well worth considering the tax implications of every investment. Stocks held for a year or less are taxed at a higher rate than stocks held for longer than a year. In addition, the tax rate for dividends can be higher or lower depending on the level of distaste of fat cat dividend investors. Our perspective on the matter of taxation of stock investments and dividends is that the goal of the New Low Observer is to demonstrate strategies that are specifically suited for tax deferred accounts.
We do indicate that the same investment recommendations can be utilized for non-deferred accounts however it is necessary to be aware of the tax consequences and the requisite documentation and filing that goes along with it. Tax filing and documentation is very challenging for the investment approach that we use which is why we prefer our strategy applied to tax-deferred accounts.
Getting into the mind of a fund manager is great when the manager has an unrivaled record for selecting small(er) companies. In this next excerpt, Rodriguez gives a little background for selling stocks.
The [fund’s] asset sales reflected any one of the following: the current price level was ahead of the stock’s fundamentals, a better investment was available, or the particular holding was becoming too large a percentage of the portfolio. We eliminated two holdings, Quanex Corporation and Oregon Steel Mills, Inc."
The first two reasons for the sale of a stock are definitely approaches that we subscribe to. The idea that a stock’s price could get ahead of the fundamentals is something that we see all too often. This explains why we consider selling a stock that has increased in value by 10% in less than a year. Additionally, we are always cognizant of the fact that there may be investment opportunities that are better than what we currently hold. The issue of a stock occupying too large of a portion of a portfolio seldom applies to our investment style since we attempt to take the largest position possible. However, for individuals who try to accomplish diversified portfolios, the selling of stock that become too large of a portion in the portfolio makes perfect sense.
In the next piece from the Shareholder Letter, Rodriguez covers some of the reason to buy stocks.
Countrywide Credit Corporation, Ross Stores, Inc. and Rouge Steel Company were added. Countrywide is the largest U.S. mortgage banker. Its share price had fallen sharply due to investor fears of the effect that rising interest rates and price competition would have on its profitability. Because these risks were widely known, we believe the stock price had already substantially discounted them.”
In retrospect, it would appear that the purchase of Countrywide (CFC) wasn’t the best choice. However, at the time, Countrywide (CFC) was in the early stages of a major ascent, which culminated in the price going as high as $45 a share in 2007. More important to the transaction is the fact that the purchase took place when it was believed that all the bad news was reflected in the stock’s price. Of course, there is no way to be sure that the bottom is in for any stock. However, a look at the numbers, at the time, may have justified such a purchase. Regardless of my defense of the Countrywide purchase, Rodriguez sold his position in the company as noted in the September 30, 2003 Letter to Shareholders (p. 2).
The next purchased mentioned by Rodriguez is Ross Stores. Rodriguez points out an interesting characteristic about the company that I consider to be very important. Rodriguez says:
Ross Stores is a leading discount clothing retailer with almost 50% of its stores located in California. Its heavy California exposure, good profitability and low valuation characteristics were attractive to us.”
As a person who lives in California, I’m certain that my perspective is clouded. However, I have noted that California is a state with an abundance of wealth. From the agriculture to high technology and direct access shipping to South American and Asia with critical social and political connections representing all of the Pacific Rim nations, there is something to be said for accessing the Californian markets. This is said despite the political and fiscal foibles that keep us entertained.
Robert Rodriguez closes his Letter to Shareholders by giving insight into viewing investment opportunities on an absolute basis rather than on a relative basis. The distinction between the two approaches will be detailed in further reviews of Rodriguez’s work.

Investment Observation: Northern Trust (NTRS) at $47.26

Today’s Investment Observation is Northern Trust (NTRS). Although Northern Trust has not increased the dividend in the last couple of years, the company has an exceptional dividend history given the turmoil that has transpired in the financial services industry for the last 3 years. According to Value Line Investment Survey, “Northern Trust is a leading provider of investment management, asset and fund administration, fiduciary and banking solutions for institutions and affluent individuals worldwide.”
Based on Value Line’s June 18, 2010 issue, Northern Trust (NTRS) has a fair value of $63. The stock has had an increase in the number of shares outstanding by 7% since 1999. However, the book value for NTRS has increased by slightly less than 3 times (286%) since 1999. Although Value Line has NTRS with a timeliness rating at the lowest end of the scale, NTRS is expected to increase in value to $70 by 2013, which is an annualized total return of 11%.
According to Dow Theory, Northern Trust (NTRS) has the following downside targets:
  • $44.48
  • $38.84
  • $33.20
At the current price, the worst-case scenario of NTRS falling to $33.20 is 27.17%. In our investment strategy, declines of 25% would initiate the second of 3 purchases for either short-term speculators or long-term investors. The upside targets for this stock are:
  • $58.58 (fair value)
  • $70.71
  • $83.95
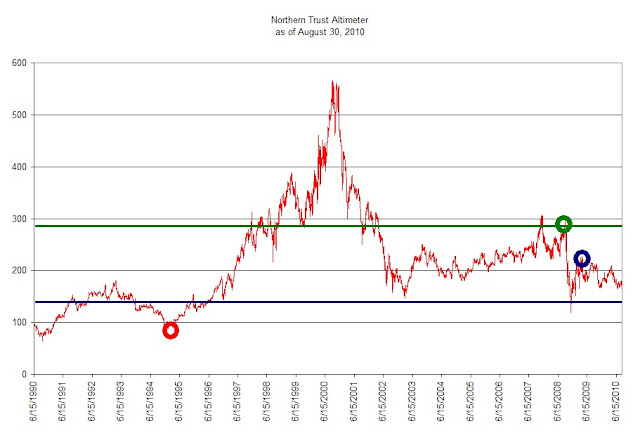
Edson Gould’s Altimeter indicates that while Northern Trust (NTRS) isn’t at the all time low, it may be forming a base in the stock’s price. At the current price of $41.47, NTRS hit a critical base (blue line) in March 2003 and December 2008. The short-term upside target is $62 as represented by the blue circle. The $62 mark coincides with Value Line’s $63 fair value price and Dow Theory’s fair value of $58.58. The most optimistic outlook for NTRS is for the stock price to rise to $83.85 as indicated by the green circle.
As a side bar, if NTRS were to rise as high as the September 2000 peak the stock would be priced at $156. However, we cannot, at this time, take the position that NTRS would rise to such a level of overvaluation unless and until the stock exceeds the $83.85 level.
Our worst-case scenario is that NTRS declines to the $28 level as represented by the red circle. We are adamantly against investors ruling out the prospect of losing at least 50% of their position. For this reason, NTRS falling to $28 is just as real in our minds as the prospect of rising to the $62 level.
As a potential sign of things to come, it was announced on Tuesday August 31, 2010 that Northern Trust was granted a Beijing branch license. Although the prospects of China have been a topic of much debate since Columbus tried to do an end run around Marco Polo’s silk road, we believe that Northern Trust is methodically positioning itself to reap rewards regardless of the rumors of China’s opportunities.

Congrats to Regan

The winner of our reader appreciation day book giveaway is Regan Cheng of Cupertino, California. The book Dow Theory Unplugged: Charles Dow's Original Editorials and Their Relevance Today has been receive in a town most famous for its largest company Apple Inc. Thanks to everyone who continues to read our site. We hope to entertain and possibly enlighten on matters related to the economy and the stock market.

Best Regards,

Touc and Art

Dividend Watch List

Watch List Summary
The best performing stock from the previous list was Harleysville (HGIC) which rose 4% The worst performing stock was Medtronic (MDT) which fell 14%.

Topping the list this week is Johnson & Johnson (JNJ). Based on IQTrends (http://www.iqtrends.com/), JNJ is undervalued at or near 3.5% yield. The current yield is 3.7%. Trailing P/E of 12 is 25% below its average 5 years P/E of 16. We suggest readers adding JNJ to your investment watch list.

Second on the list is Intel (INTC). After cutting their sales and margin forecast down on Friday, stock rose 1%. Could the negative news be priced in? Only time will tell. Intel is trading at 11x trailing earnings. Compared that to its 5 years average of 21x, it could be a bargain. Analyst will have a weekend full of downward revision so we expect little more pressure next week. But given the stock is yielding 3.4% compared to the 5 years average yield of 2.3%, the risk/reward is more attractive now. Both JNJ and INTC have payout ratio below 50%.

Our Investment Observation of Wesco Financial (WSC) on Tuesday August 24th was quickly verifed as being undervalued by Warren Buffett's offer to buy the remaining portion that he didn't already own on Thursday August 26th. We were able to provide a new Investment Observation of Transatlantic Holdings (TRH). With Transatlantic Holdings selling below book value, median price-to-earnings and dividend increases every year since going public, we believe TRH is a great alternative to Wesco Financial. In addition to TRH, we are working on a company which we believe will be able to retain its value far into the future.

August 27, 2010 Watch List

Symbol Name Price % Yr Low P/E EPS (ttm) Div/Shr Yield Payout Ratio
JNJ Johnson & Johnson   57.60 1.30% 11.90 4.84 2.16 3.75% 45%
INTC Intel Corp.  18.37 1.38% 11.00 1.67 0.63 3.43% 38%
GD General Dynamics Corp. 57.37 1.95% 9.18 6.25 1.68 2.93% 27%
PBI Pitney Bowes Inc   19.61 2.14% 11.88 1.65 1.46 7.45% 88%
SVU SUPERVALU INC 10.19 2.31% 6.25 1.63 0.35 3.43% 21%
HRB H&R Block, Inc. 13.59 2.64% 9.50 1.43 0.60 4.42% 42%
CSL Carlisle Companies Inc. 29.50 2.68% 12.66 2.33 0.68 2.31% 29%
UVV Universal Corp. 36.47 2.70% 7.18 5.08 1.88 5.15% 37%
XRAY DENTSPLY International Inc.  28.86 2.70% 15.60 1.85 0.20 0.69% 11%
WFSL Washington Federal, Inc.  14.43 2.78% 13.74 1.05 0.20 1.39% 19%
DNB Dun & Bradstreet Corp. 67.37 2.85% 14.49 4.65 1.40 2.08% 30%
UMBF UMB Financial Corp.  33.48 2.86% 13.95 2.40 0.74 2.21% 31%
PAYX Paychex, Inc.  25.37 2.92% 19.22 1.32 1.24 4.89% 94%
BEC Beckman Coulter, Inc. 45.84 3.24% 21.83 2.10 0.72 1.57% 34%
HSC Harsco Corp. 20.74 3.49% 17.14 1.21 0.82 3.95% 68%
ALL Allstate Corp.   27.99 3.51% 15.13 1.85 0.80 2.86% 43%
NTRS Northern Trust Corp.  47.05 3.52% 15.43 3.05 1.12 2.38% 37%
EV Eaton Vance Corp. 26.93 3.74% 19.24 1.40 0.64 2.38% 46%
ITW Illinois Tool Works, Inc. 41.85 3.77% 13.86 3.02 1.36 3.25% 45%
NFG National Fuel Gas Co. 44.46 3.81% 17.03 2.61 1.38 3.10% 53%
WAG Walgreen Co. 27.32 4.04% 13.13 2.08 0.70 2.56% 34%
WFC Wells Fargo & Co. 24.00 4.26% 14.46 1.66 0.20 0.83% 12%
BBT BB&T Corp. 22.72 4.51% 21.43 1.06 0.60 2.64% 57%
OMI Owens & Minor, Inc. 26.68 4.55% 13.54 1.97 0.71 2.66% 36%
FRS Frisch's Restaurants, Inc 18.92 4.59% 9.80 1.93 0.52 2.75% 27%
CWT California Water Service Group 35.42 4.76% 19.15 1.85 1.19 3.36% 64%
WST West Pharmaceutical Services, Inc. 34.33 4.82% 14.99 2.29 0.64 1.86% 28%
MLM Martin Marietta Materials, Inc. 75.16 5.12% 41.76 1.80 1.60 2.13% 89%
USB U.S. BanCorp. 21.66 5.15% 15.58 1.39 0.20 0.92% 14%
MSA Mine Safety Appliances Co 23.57 5.22% 21.04 1.12 1.00 4.24% 89%
BANF BancFirst Corp.  36.49 5.28% 14.42 2.53 0.92 2.52% 36%
FFIN First Financial Bankshares, Inc.  45.85 5.28% 17.57 2.61 1.36 2.97% 52%
BDX Becton, Dickinson and Co. 69.72 5.32% 13.64 5.11 1.48 2.12% 29%
BCR CR Bard, Inc. 77.98 5.39% 15.88 4.91 0.72 0.92% 15%
CL Colgate-Palmolive Co. 74.25 5.39% 17.72 4.19 2.12 2.86% 51%
MDT Medtronic, Inc. 32.52 5.58% 11.66 2.79 0.90 2.77% 32%
FII Federated Investors Inc 21.13 5.60% 11.06 1.91 0.96 4.54% 50%
FUL HB Fuller Company 19.61 6.17% 10.77 1.82 0.28 1.43% 15%
TROW T. Rowe Price Group, Inc.  45.24 6.37% 20.20 2.24 1.08 2.39% 48%
TR Tootsie Roll Industries Inc  23.97 3.45% 26.34 0.91 0.32 1.34% 35%
WMT Wal-Mart Stores, Inc. 51.00 6.76% 13.11 3.89 1.21 2.37% 31%
LLY Eli Lilly & Co. 34.20 6.81% 8.47 4.04 1.96 5.73% 49%
XOM Exxon Mobil Corp.   59.80 6.90% 11.54 5.18 1.76 2.94% 34%
HGIC Harleysville Group Inc.  32.13 6.92% 12.12 2.65 1.44 4.48% 54%
UFPI Universal Forest Products, Inc.  28.18 7.15% 22.91 1.23 0.40 1.42% 33%
SBSI Southside Bancshares, Inc.  18.65 7.24% 7.06 2.64 0.68 3.65% 26%
HCC HCC Insurance Holdings, Inc. 25.59 7.30% 8.79 2.91 0.54 2.11% 19%
SEIC SEI Investments Company  18.02 7.52% 16.38 1.10 0.20 1.11% 18%
LM Legg Mason, Inc.  25.84 7.67% 20.35 1.27 0.16 0.62% 13%
HIG Hartford Financial Services Group  20.32 7.74% 70.07 0.29 0.20 0.98% 69%
RLI RLI Corp. 53.21 7.87% 9.47 5.62 1.16 2.18% 21%
SYK Stryker Corp. 44.00 7.90% 14.97 2.94 0.60 1.36% 20%
GS Goldman Sachs Group, Inc.   139.75 7.92% 7.05 19.82 1.40 1.00% 7%
AROW Arrow Financial Corp.  23.70 8.07% 12.22 1.94 1.00 4.22% 52%
CBSH Commerce Bancshares, Inc.  36.56 8.20% 14.86 2.46 0.94 2.57% 38%
IBM International Business Machines 124.73 8.32% 11.79 10.58 2.60 2.08% 25%
SFNC Simmons First National Corp.  26.29 8.73% 15.37 1.71 0.76 2.89% 44%
BRC Brady Corp. 26.34 8.75% 17.44 1.51 0.70 2.66% 46%
AWR American States Water Co. 33.94 8.78% 20.82 1.63 1.04 3.06% 64%
LEG Leggett & Platt, Inc. 19.48 8.89% 16.23 1.20 1.08 5.54% 90%
VFC VF Corp. 73.88 9.02% 14.75 5.01 2.40 3.25% 48%
TRMK Trustmark Corp.  19.74 9.24% 14.10 1.40 0.92 4.66% 66%
EGN Energen Corp. 43.97 9.24% 11.39 3.86 0.52 1.18% 13%
LANC Lancaster Colony Corp.  47.35 9.40% 11.61 4.08 1.20 2.53% 29%
TMP Tompkins Financial Corp. 37.94 9.51% 12.01 3.16 1.36 3.58% 43%
RNST Renasant Corp.  14.07 9.84% 19.01 0.74 0.68 4.83% 92%
TRH Transatlantic Holdings, Inc. 48.52 10.07% 7.73 6.28 0.84 1.73% 13%
CAG ConAgra Foods, Inc. 21.74 10.13% 13.42 1.62 0.80 3.68% 49%
MDU MDU Resources Group Inc. 18.85 10.17% 13.86 1.36 0.63 3.34% 46%
LOW Lowe's Companies Inc 21.10 10.18% 16.48 1.28 0.44 2.09% 34%
FFIC Flushing Financial Corp.  11.21 10.23% 11.56 0.97 0.52 4.64% 54%
RPM RPM International Inc. 17.25 10.15% 12.41 1.39 0.82 4.75% 59%
72 Companies


We excluded companies that has no earning and payout ratio in excess of 100%. Stocks that appear on our watch lists are not recommendations to buy. Instead, they are the starting point for doing your research and determining the best company to buy. Ideally, a stock that is purchased from this list is done after a considerable decline in the price and extensive due diligence.

Because our list has many great companies, we urged investors to filter for companies with less than 50% payout ratio. This should minimized the risk of dividend reductions if earnings are to fall by half. If you understand the companies' history and their ability to pay the dividend, then payout ratios in excess of 50% may be considered.  We suggest readers to use the March 2009 low (or companies' most distressed level in the last 2 years) as the downside projection for investing. Our view is to embrace the worse case scenario prior to investing. The November 2008 to March 2009 time frame fits that description. It is important to place these companies in your own watch list so that when the opportunity arises, you can purchase them with a greater margin of safety.

Email our team here.

September Ex-Dividend Dates for Watch List Companies

Below are the ex-dividend dates for the month of September for companies that appear on our Dividend Achiever, Nasdaq 100, Dow Jones Transportation Index and International Dividend Achiever Watch Lists. All companies are ranked by ex-dividend dates.  This is a full update of the same list from July 31, 2010.

Companies that show up on our Watch Lists could be considered the equivalent of the bargain bin of high quality blue chip stocks. Because these companies have increased their dividends every year for at least 10 years in a row or are part of the Nasdaq 100 and within 20% of their respective 52-week low, you know that you’re not overpaying for a company that has demonstrated profitability and the ability to rebound from challenging times.

Symbol Company Price % above low Yield Ex-date
MYE Myers Industries, Inc. $6.40 1.59% 3.90% 9/1/2010
ANAT American National Insurance $77.00 1.77% 4.00% 9/1/2010
BAC Bank of America Corp $12.64 1.85% 0.30% 9/1/2010
IMO Imperial Oil Limited $37.25 6.28% 1.10% 9/1/2010
TRH Transatlantic Holdings $48.52 10.07% 1.70% 9/1/2010
SU Suncor Energy $31.10 12.48% 1.20% 9/1/2010
PEP Pepsico, Inc. $64.12 15.14% 3.00% 9/1/2010
CCBG Capital City Bank Group $11.43 6.23% 3.60% 9/1/2010
WRI Weingarten Realty Investors $20.31 15.07% 5.20% 9/3/2010
BDX Becton, Dickinson $69.72 5.32% 2.10% 9/7/2010
CBSH Commerce Bancshares $36.56 8.20% 2.60% 9/7/2010
MDU MDU Resources Group $18.85 10.17% 3.40% 9/7/2010
FFIC Flushing Financial $11.21 10.23% 4.60% 9/7/2010
UVSP Univest Corporation of Penn $16.78 10.83% 4.90% 9/7/2010
UMBF UMB Financial Corp $33.48 2.86% 2.20% 9/8/2010
HRB H&R Block, Inc. $13.59 3.03% 4.50% 9/8/2010
NTRS Northern Trust Corp $47.05 3.52% 2.40% 9/8/2010
VFC V.F. Corp $73.88 9.02% 3.20% 9/8/2010
LANC Lancaster Colony Corp $47.35 9.40% 2.60% 9/8/2010
KMB Kimberly-Clark Corp $64.46 12.89% 4.10% 9/8/2010
JCI Johnson Controls, Inc $27.24 15.47% 1.90% 9/8/2010
STFC State Auto Financial Corp $14.05 4.85% 4.30% 9/8/2010
TROW T. Rowe Price Group, Inc. $45.24 6.37% 2.40% 9/8/2010
SUBK Suffolk Bancorp $24.34 3.00% 3.60% 9/9/2010
IRET Investors Real Estate Trust $8.24 3.39% 8.30% 9/9/2010
FFIN First Financial Bankshares, Inc $45.85 5.28% 3.00% 9/9/2010
SFNC Simmons First National Corp $26.29 8.73% 3.00% 9/9/2010
THFF First Financial Corp $28.21 12.30% 3.30% 9/9/2010
FSS Federal Signal Corp $5.13 4.48% 4.70% 9/10/2010
UHT Universal Health Realty Income $32.25 9.25% 7.60% 9/12/2010
HI Hillenbrand Inc $19.99 12.30% 3.70% 9/12/2010
TDS Telephone and Data Systems $30.77 19.68% 1.50% 9/12/2010
BXS BancorpSouth, Inc. $12.86 3.63% 6.90% 9/13/2010
OMI Owens & Minor, Inc. $26.68 4.55% 2.70% 9/13/2010
HGIC Harleysville Group Inc. $32.13 6.92% 4.60% 9/13/2010
GMT GATX Corp $27.39 7.83% 4.20% 9/13/2010
LEG Leggett & Platt, Inc $19.48 8.89% 5.60% 9/13/2010
NJR NewJersey Resources Corp $38.00 13.47% 3.70% 9/13/2010
RNR RenaissanceRe Holdings Ltd. $57.52 13.99% 1.70% 9/13/2010
KO Coca-Cola Co $56.16 16.08% 3.20% 9/13/2010
MRK Merck & Company, Inc. $35.00 16.90% 4.40% 9/13/2010
UGI UGI Corp $27.53 18.77% 3.60% 9/13/2010
CTBI Community Trust Bancorp $26.46 19.46% 4.70% 9/13/2010
TSS Total System Services $14.55 8.50% 2.00% 9/13/2010
RNST Renasant Corp $14.07 9.84% 5.00% 9/13/2010
NGG National Grid Transco $42.89 16.80% 8.50% 9/13/2010
FDX FedEx Corp $80.46 18.22% 0.60% 9/13/2010
MCY Mercury General Corp $39.27 10.84% 6.10% 9/14/2010
FNF Fidelity National Financial $14.70 16.67% 4.90% 9/14/2010
EGP EastGroup Properties, Inc. $35.07 5.92% 5.90% 9/14/2010
FRS Frisch's Restaurants, Inc. $18.92 4.59% 2.70% 9/15/2010
GE General Electric $14.71 12.89% 3.30% 9/16/2010
ECL Ecolab Inc. $47.62 17.12% 1.30% 9/17/2010
SEIC SEI Investments $18.02 7.52% 1.10% 9/19/2010
TMX Telefonos de Mexico $14.06 8.15% 5.50% 9/20/2010
CINF Cincinnati Financial $27.22 11.06% 5.90% 9/20/2010
TR Tootsie Roll Industries $23.97 3.45% 1.30% 9/20/2010
SPLS Staples, Inc. $18.04 2.21% 2.00% 9/21/2010
OSBC Old Second Bancorp, Inc. $0.89 8.59% 4.30% 9/21/2010
CB Chubb Corporation $54.48 15.67% 2.70% 9/21/2010
CCH COCA COLA HELLENIC $23.02 16.56% 1.50% 9/21/2010
NFG National Fuel Gas Co $44.46 3.81% 3.20% 9/26/2010
CVBF CVB Financial Corp $6.88 4.08% 4.70% 9/26/2010
NUE Nucor Corp $37.25 4.31% 3.90% 9/26/2010
USB U.S. Bancorp $21.66 5.15% 0.90% 9/26/2010
BANF BancFirst Corp $36.49 5.28% 2.60% 9/26/2010
STLD Steel Dynamics, Inc. $13.83 7.31% 2.20% 9/26/2010
SYK Stryker Corp $44.00 7.90% 1.40% 9/26/2010
FBNC First Bancorp $12.94 8.38% 2.50% 9/26/2010
AXS Axis Capital Holdings Limited $31.28 14.92% 2.70% 9/26/2010
OFC Corporate Office Properties $36.54 15.01% 4.30% 9/26/2010
WPC W.P. Carey  Co. LLC $28.42 15.11% 7.10% 9/26/2010
BEN Franklin Resources, Inc. $98.32 17.05% 0.90% 9/26/2010
XRAY DENTSPLY Intl Inc. $28.86 2.70% 0.70% 9/27/2010
SRE Sempra Energy $51.97 18.36% 3.00% 9/27/2010
CWCO Consolidated Water Co. Ltd. $9.71 4.75% 3.10% 9/27/2010
HCC HCC Insurance Holdings, Inc. Co $25.59 7.30% 2.10% 9/27/2010
STT State Street Corp $35.85 10.41% 0.10% 9/27/2010
LRY Liberty Property Trust $30.29 11.44% 6.40% 9/27/2010
ABM ABM Industries Inc $20.24 12.82% 2.80% 9/27/2010
APD Air Products and Chemicals, Inc $74.42 16.05% 2.70% 9/27/2010
ITW Illinois Tool Works Inc. $41.85 3.77% 3.30% 9/28/2010
RLI RLI Corp $53.21 7.87% 2.20% 9/28/2010
AJG Arthur J. Gallagher & Co $25.33 15.77% 5.20% 9/28/2010
WSH Willis Group Holdings $29.39 17.70% 3.60% 9/28/2010
CCJ Cameco Corp $24.69 19.28% 1.10% 9/28/2010
SYY Sysco Corp $28.05 15.72% 3.50% 9/28/2010
WWW Wolverine World Wide $26.22 11.53% 1.70% 9/29/2010
ACE Ace Limited $54.34 15.40% 2.50% 9/29/2010
SUP Superior Industries Intl $14.95 19.12% 4.30% 9/29/2010

If you happen to be researching these companies for potential investment, it would be advisable to consider the ex-dividend date prior to possible purchases. Owning the shares of the company that you're interested in before the ex-dividend date entitles you to the upcoming dividend payment.
Owning the shares on or after the ex-dividend date means that you would have to wait at least three months before receipt of the next dividend payment. Please verify the ex-dividend date and payout ratio before committing funds to these stocks. Additionally, do not base your next long or short-term purchase on the dividend payment or yield. Instead, get as much research in as you possibly can before the ex-dividend date "just in case" you're actually interested in buying the stock.

Next Weekend:

  • Canadian Dividend Achievers near a New Low

Investment Observation: Transatlantic Holdings (TRH) at $48.52

Today’s Investment Observation is Transatlantic Holdings (TRH). According to Yahoo!Finance, “Transatlantic Holdings, Inc., through its subsidiaries, offers reinsurance capacity for a range of property and casualty products, directly and through brokers, to insurance and reinsurance companies, in domestic and international markets.” Transatlantic Holdings (TRH) has increased the dividend every year for 20 years in a row. According to TRH’s May 20, 2010 press release, the company plans to increase the dividend by 5% on September 17, 2010 for shareholders of record on September 3, 2010.
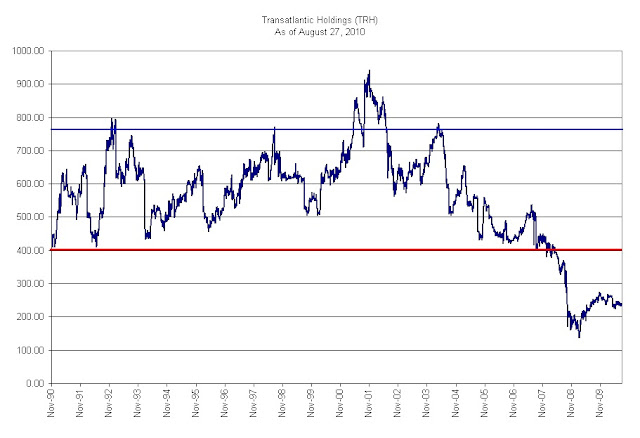
In our analysis of Transatlantic Holdings (TRH), we’ll first address the technical pattern of Edson Gould’s Altimeter. The altimeter suggests to us that TRH is severely undervalued in relation to the dividend. The red horizontal line is the indicated level where TRH would normally be considered undervalued at $84 per share. On the extreme end of the overvalued range, TRH would trade at approximately $162 as indicated by the blue horizontal line.
Value Line Investment Survey has estimated that TRH would be around the $75 range by 2013. We opt to err on the side of caution on this matter and have taken the view that from the current price of $48.52, we could reasonably expect that TRH could rise to $67 or 38% over the next 2-3 years. However, our investment strategy requires that if we get a 10% gain in less than a year in a tax-deferred account then we’re considering the next best investment alternative.
According to Value Line Investment Survey, Transatlantic Holdings (TRH) is fairly valued at 10x earnings. Using the more conservative (lower) estimated earnings figure for 2010 by Value Line, TRH should return to the fair value of $65.50. Again, this is far above the current price by 35%. Value Line also indicates that TRH has a (2009) book value of $60.77 per share. Based on the current market price, TRH is selling 25.25% below book value. Dow Theory ascribes a fair value of $51.15 based on the peak of July 6, 2007 and the trough on March 9, 2009. Because the book value is higher than the Dow Theory fair value figure, I suspect that TRH will far exceed my upside targets.
When speaking of the risks to our investment view of Transatlantic Holdings (TRH), we cannot avoid the question of the black hole of AIG. The close relationship between AIG and TRH, through AIG’s prior majority ownership (59%) of TRH and funneling of business to the reinsurer, probably is the reason that TRH started moving towards the undervalued level from December 4, 2001 to March 9, 2009. According to Value Line, now that the AIG holdings of TRH stock have been sold off completely, there is one less issue to deal with in that that regard. This concern was confirmed with the following statement from TRH’s 10-Q:

As a result of its reduced ownership percentage, the AIG Group is no longer considered a related party after March 15, 2010

Transatlantic Holdings, 10-Q August 6, 2010 (PDF link), page 25, Accessed August 27, 2010.

There still is the matter of how TRH will do if AIG isn’t around to provide a “guaranteed” stream of business. I’m of the mindset that TRH had some really nice training wheels with AIG but the company has been more than ready and able to go it alone. Obviously we can see that the failure of AIG affected TRH but it didn’t put TRH out of business. So far, as corporate transitions go, TRH seems to have weathered the storm. Going forward, the primary concern for TRH should be catastrophic events which seem to increase, in magnitude, year after year.