Sell Wesco Financial (WSC) at the Market

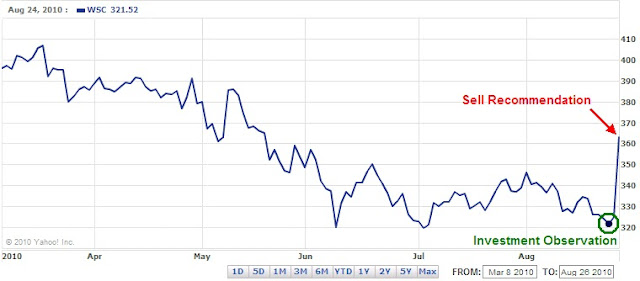
Almost as abruptly as it was initiated, we are forced to issue a SELL recommendation for Wesco Financial Corp. (WSC). The stock has performed beyond our expectations since the Investment Observation was issued on August 24, 2010. Naturally, the rate of change in WSC couldn’t possibly continue at the same trajectory and for this reason we must issue a sell recommendation.

Warren Buffett has offered to buy the shares that he doesn’t already own of Wesco (WSC) for close to the book value of $352 per share. As we indicated in our Investment Observation, WSC is currently priced at the equivalent level of $244.55 based on the dividend increases in relation to the book value. Buffett is literally stealing the company right under our noses. There just may not be much more upside to this stock other than what the management of Berkshire Hathaway brings to the table. This is no slight to Buffett and Co. However, it would be next to impossible to obtain the same returns in such a short period of time.
WSC was recommended when it was trading at $321.24. As of the close of Thursday August 26, 2010, WSC was quoted at $363 (or $0.35 away from our estimated Dow Theory fair value level). This equals a return of 12.99% in 3 days. Conservatively, on an annualized basis this would equal approximately 1,185% return (we apologize for putting such a ridiculous number in this section but it has been our format and no one has complained about it so far.) Selling this stock now generates a return 259 times the amount of the dividend yield if the stock was held for a whole year. We will not give the run down on how the stock performed compared to treasuries.
This is not the first time that we’ve been ensnared in a recommendation that was later pursued by Warren Buffett. On the record, our May 4, 2009 recommendation of Becton Dickson (BDX) was followed up with an August 14 SEC filings by Buffett indicating that BDX was bought on June 30, 2009. At the time that the news came out, we had issued a research recommendation and a sell recommendation with a gain of 11%.
Another transaction that got caught up in the euphoria of Mr. Buffett was our Wal-Mart analysis in the article titled “Values Biding Time” published on June 18, 2009. It was not long after that article (December 23, 2009) that it was revealed that Buffett had increased his stake in Wal-Mart.  We're certain that the our selection process and the tastes of Warren Buffett are merely coincidental.  However, it is nice to know that we are possibly on the right track with the timing and quality of companies that we select.
We're working on two companies from our watch list that should be added to the Investment Observation List soon.  It is hoped that the next two companies that we profile will be just as profitable and equally as alluring from a value standpoint. 

Seth Klarman Review: Margin of Safety-Introduction

The following is a line for line analysis of Seth Klarman's book Margin of Safety.  we're providing the concept or idea that we think is being conveyed followed by the quote and page where you can find the citation.  Additionally, we follow-up with our thoughts on the concept.  We hope to review the complete book one chapter at a time.

According to GuruFocus.com, "Seth Klarman is a value investor and Portfolio Manager of the investment partnership The Baupost Group. Founded in 1983, The Baupost Group now manages $7 billion, and has averaged returns of nearly 20% annually since their inception. Seth Klarman is the author of the book "Margin of Safety" which sells for over $1000."

Introduction
  • Where investors go wrong
    • "Avoiding where others go wrong is an important step in achieving investment success. In fact, it almost ensures it.” p. xiii
        • In order to know where investors go wrong a person must first determine where and when the biggest mistakes have been made. Examining history and market tops, along with subsequent declines, help an investor to see the errors that were made right before the errors were fully revealed. In addition, the best assessments of a market decline are done afterwards as well. Hence, books like Security Analysis that followed the Crash and Depression of 1929.
  • Risk/Reward
    • Before you can focus on the remote possibility of rewards the market has to offer, you must first focus on the probability of risk of loss. p.xiii
        • No amount of stock market analysis is worth pursing if an assessment of loss, with the expectation of at least 50% loss, is not part of the equation.
  • Margin of Safety
    • Value investors should always allow “…room for imprecision, bad luck, or analytical error in order to avoid sizable losses over time.” p.xiv
        • Margin of safety means that the stock analyst expects to be wrong about their assessment and wouldn’t panic when the company that they’ve “invested” in doesn’t perform as planned.
  • The Ignorance of Indexing
    • …Indexing strategies [are] designed to avoid significant underperformance at the cost of assured mediocrity.” p. xv
        • Being categorically against indexing of all sorts, either through ETFs, Index Funds or mutual funds, it is quite apropos that Klarman would say this.
  • Know the Rationale of the Rules
    • …observing a few rules isn’t enough. Too many things change too quickly in the investment world for that approach to work [following some simple rules]. It is necessary instead to understand the rationale behind the rule in order to appreciate why they work when they do and don’t when they don’t.” Understanding the rationale behind the rules ensures success. p. xv
        • In order to really understand the rule and the premise behind them an appreciation of history is required. Such an appreciation is not for the purpose of linking disparate events together. Instead, the purpose is to learn the underlying actions and reactions that create the market rules we’re forced to adhere to today.
  • Buy Low and a lot, Sell High and buy very little
    • When prices are high risk very little capital, when prices are low risk a large amount of capital. p. xvi
        • Our allocation model states that we only buy, at the most, 5 companies when fully invested. We only buy after reviewing stocks that have reached a new low and have been thoroughly assessed. We only target the companies that have increased their dividend every year for a minimum 10 years in a row or are quality companies that are a part of required mutual fund purchases, like Nasdaq 100 stocks.
  • Avoid Market Fads (i.e. investment products)
    • The important point is not merely that junk bonds were flawed (although they certainly were) but that investors must learn from this very avoidable debacle to escape the next enticing market fad that will inevitably come along." Avoid market fads and fashions. p. xvii
        • Yield chasing and investing out of convenience ultimately doesn’t end nicely. Right now the current fad is towards stocks and funds that pay high yields. Inevitably, Wall Street will provide or create products that meet the highest demand. This will result in exceptional yields with exceptional risk. Another market fad that has existed for a long time is the belief in mutual funds and related products (ETFs, index funds, etc). These are instruments of convenience that takes the investor away from learning as they invest. The cumulative effect is that those who participate in instruments of convenience don’t accrue the “true” knowledge necessary to succeed in investing which makes them ripe for falling for the latest fad.
  • Speculation equals Opportunities
    • Speculators “…actions often inadvertently result in the creation of opportunities for value investors.” p. xvii
        • Speculators are often seen as the scrouges of the financial markets who create mayhem on whatever product they touch. However, successful speculators, of which there are few, usually quit while they’re ahead. Unsuccessful speculators, of which there are many, overreach and lose big or lose small frequently enough that the result is the same either way. The loses incurred by speculators ultimately result in the sale or disposition of assets at or below value. Value investors should be alarmed when they hear politicians clamoring for blood at the hands of speculators because many investment opportunities are created at the hands of willing sellers, typically speculators.
  • Rapid Rise and Fall
    • The rapid rise and fall of prices on a daily basis cannot possibly reflect the change in earnings on a quarterly basis. p. xviii
      • What seems most interesting is that some stocks fall in price as though there was a loss in quarterly earnings. A loss in earnings isn’t the same as earning less than expected. Some amusement is garnered from watching “investors” sell a stock simply because the company didn’t earn as much as expected. In certain instances, the rapid decline of a stock may present an opportunity to buy a stock at a reasonable price.

 Margin of Safety-Chapter 1

Email our team here.

Investment Observation: Wesco Financial Corp. (WSC) at $321.24

Today’s Investment Observation is on Wesco Financial (WSC). According to Value Line, Wesco Financial is a diversified company engaged “…in the insurance, furniture rental, and steel service center businesses in the United States.” Charles T. Munger heads Wesco Financial (WSC) and is 80% owned by Berkshire Hathaway (BRK-A). Wesco Financial (WSC) has increased its dividend for 38 years in a row.
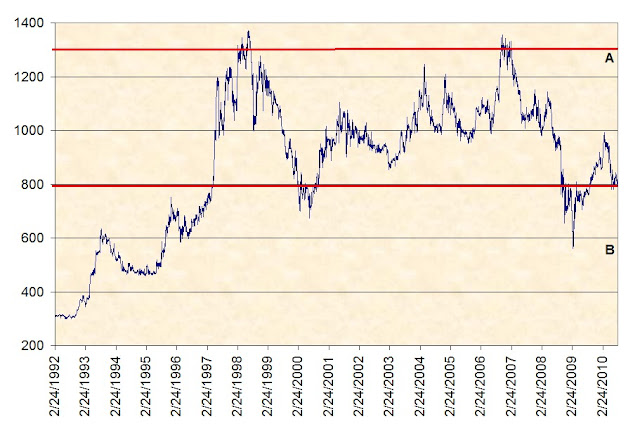
Our initial interest in WSC is drawn directly from Edson Gould’s Altimeter, which puts the dividend payment in relative terms compared to the stock price. This is important since the continuous increase of the dividend is never reflected in the stock charts available. As seen in the chart below, WSC is now selling at a support level that was first established (on a relative basis) on May 12, 1997.
If we use the Altimeter’s peaks and troughs, we arrive at an upside target of $533 (point A). We expect that our upside target is too optimistic and therefore set our sights for the most realistic target of $410. Our downside target, based on the Altimeter, is $246 (point B) or 24% below the closing price of August 23, 2010. However, we would advise investors to build in the expectation that the stock could decline as much as 50% from the current level. The way the New Low Observer team deals with this issue is by buying 50% (of the intended amount to be invested) now and holding the remaining amount for the prospect of the decline.
Our previous experience investing in WSC was back in late 2007 to early 2008 (2008 transaction history). At the time, WSC had all the redeeming attributes that we see today. However, we sold the stock for a –4% loss just before the price jumped 13%. Although we were quick to pull the trigger on selling WSC with a –4% loss the subsequent 42% decline was worth avoiding.
Dow Theory indicates that WSC is assumed to be at fair value when the stock has reached $363.35 based on the peak from March 18, 2010 to the closing price of July 2, 2010. However, to be as conservative as possible, we would take the high of 2010 and the low of 2009 and determine a worst-case scenario of fair value and arrived at $314.22. This indicates that as long as WSC can hold above the worst-case scenario of fair value, the gains in this stock are almost assured.
There are a few other features that are of particular interest regarding WSC. According to Valueline, there has been absolutely no change in the number of shares outstanding since 2002. In addition, WSC has long-term debt that is negligible and falling since 2002 while the book value has increased by 30.26% over the same period of time. Speaking of book value, based on the dividend increases since May 1997, WSC is selling at the equivalent of $224.55, a discount of 31.25% of the current indicated book value of $352. It should be noted that the current price of WSC is the same as back in 2002.
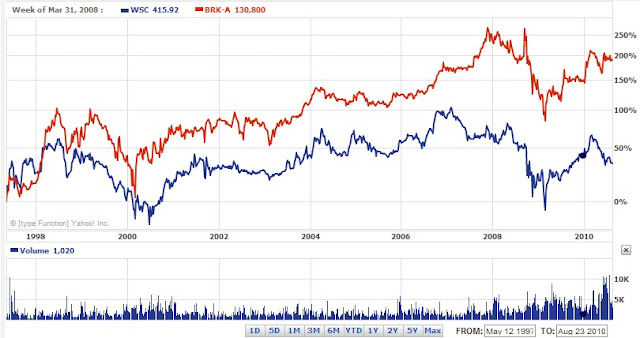
For some strange reason, we’d like to believe that WSC should mirror the performance of BRK-A even though we know this is not true. Both companies are very different not to mention the fact that BRK-A is diversified with a triple A rating. However, we couldn’t resist the temptation to include a comparison chart of WSC (blue line) and BRK-A (red line) since 1997.
In closing, we make our greatest case against WSC with the words of its CEO Charlie Munger:
Business and human quality in place at Wesco continues to be not nearly as good, all factors considered, as that in place at Berkshire Hathaway. Wesco is not an equally-good but smaller version of Berkshire Hathaway, better because its small size makes growth easier. Instead, each dollar of book value at Wesco continues plainly to provide much less intrinsic value than a similar dollar of book value at Berkshire Hathaway. Moreover, the 7 quality disparity in book value’s intrinsic merits has, in recent years, continued to widen in favor of Berkshire Hathaway. All that said, we make no attempt to appraise relative attractiveness for investment of Wesco versus Berkshire Hathaway stock at present stock-market quotations.
Munger, Charles T. Wesco Financial Corporation, Letter to Shareholders. February 25, 2009. Page 7. http://www.wescofinancial.com/cm2008.pdf (PDF). Accessed August 23, 2010.
I’m reluctant to accept that Mr. Munger isn’t just under-promising for the sole purpose of over-performing down the road. At the time that Munger made the above statement WSC was trading at $249.24. Since February 25, 2009, WSC has climbed 30% while BRK-A has climbed 45%. I guess Munger was right. However, I’ll take the 30% increase any day of the week.
There is so much in favor of this company, from a fundamental and technical standpoint, that we recommend doing some cursory research on WSC. Despite the coming global financial collapse caused by hemorrhaging U.S. deficits, Wesco Financial will be around to match the current Dividend Achievers with continuous increases for 55 years in a row.

Canadian Dividend Achievers

This list of Canadian Dividend Achievers, published by Mergent's, includes current and former Canadian Dividend Achievers and then ranking the companies based on those closest to the 52-week low as of August 20, 2010. We've updated the stock symbol to connect to the Financial Post, one of Canada's top business publications. You'll find the most complete fundamental information on these companies at the FP website. However, Yahoo!Finance probably has the better long-term charts and historical dividend data. Enjoy.

FP Symbol Yahoo Symbol Name Price Pct from Yr Low
ESI ESI.TO ENSIGN ENERGY SERVICES INC. $11.90 1.45%
IMO IMO.TO IMPERIAL OIL $38.88 2.99%
POW POW.TO POWER CORP CDA $26.03 3.50%
RBA RBA.TO RITCHIE BROS AUCTIONEERS INC. $18.94 4.64%
PWF PWF.TO POWER FINANCIAL CORP. $28.07 4.93%
GWO GWO.TO GREAT-WEST LIFECO INC $24.50 6.48%
IGM IGM.TO IGM FINANCIAL INC. $39.15 6.65%
CTC.A CTC-A.TO CANADIAN TIRE CORP $54.81 7.77%
SU SU.TO SUNCOR ENERGY INC. $32.68 9.26%
TLM TLM.TO TALISMAN ENERGY INC. $17.25 9.80%
CNQ CNQ.TO CDN NATURAL RES $33.75 11.29%
IAG IAG.TO INDUSTRIAL ALLIANCE $30.40 11.85%
SNC SNC.TO SNC-LAVALIN SV $46.65 12.17%
TRI TRI.TO THOMSON REUTERS $36.80 12.47%
TD TD.TO TORONTO-DOMINION BANK $70.52 15.29%
BNS BNS.TO BANK OF NOVA SCOTIA $50.85 18.37%
Watch List Summary
Below are the best and worst performing Canadian Dividend Achievers in the period from August 6, 2010 to August 20, 2010.
    Leaders:
    • Toromont (TIH.TO) rose 8.52%.
    • Pason Systems (PSI.TO) rose 7.43%.
    • Ag Growth International (AFN.TO) rose 6.73%.
    Laggards:
    • Transcontinental Inc. (TCL-A.TO) fell -12.30%.
    • Methanex Corp. (MX.TO) fell -8.07%.
    • Canadian Natural Resources (CNQ) fell -7.38% 

    Robert Rodriguez Review: September 1994

    One person that the New Low Observer team truly admires in the world of investing is Robert Rodriguez. Mr. Rodriguez had an investment strategy that is very close to the approach that we have employed by examining quality stocks near a new low. The beauty of Rodriguez’s work is that he has an unparalleled investment record in the realm of small and mid-cap companies. From my perspective, there are so many challenges working against companies with a market capitalization of $1 billion or less. However, Rodriguez made it look easy even though we’re certain that it wasn’t. According to GuruFocus, during his time as the manager of the FPA Capital funds, Rodriguez “…has achieved an annualized return of 16.91% as of 9/30/2007. In the same period S&P 500 has returned 13.17% annually.”  (related FPA performance data)

    In the Letter to Shareholders dated September 30, 1994 (PDF), Rodriguez says a couple of things that I feel are worth repeating. In the first excerpt, Rodriguez compares the market declines of 1987, 1990 and 1994. Rodriguez speculates as to the reasons why 1994 was different from 1987 and 1990. He mentioned that in 1987 the stock market crash was due to computer selling while in 1990 the prospect of war became a reality.
    In 1987, Rodriguez thought that the ability to make the decision to sell stocks was easy. The unfamiliarity of computer selling made the choice to sell academic. Likewise, the prospect of war in 1990 was clearly bad so selling stocks wasn’t an issue for average investors.

    According to Rodriguez, 1994 was different because of the following:
    The Fed has shifted to a tighter monetary policy. Interest rates are rising while inflation fears are growing. Will these factors lead to a possible recession in 1995? All are situations that most investors have faced before; therefore, they have created a longer period of investor uncertainty.
    This leads Rodriguez to conclude:
    In this type of an environment, an individual stock’s characteristics tend to play a greater role than any one single event. Stock picking has a potentially higher probability of being a successful strategy and this is where we feel our strength lies.
    My thoughts are that when compared to a market crash or a war, the prospect of a recession is a 50/50 proposition. This causes investors to waver as to whether they should buy or sell stocks. Undecided investors cause the market to become range bound allowing for companies to collect earnings that, in turn, builds value into the price of the stock creating unique value opportunities. This is not unlike the current investment environment where there market has fluctuated in a range due to the agonizing over the threat of a “double dip” recession. Whether a recession materializes, occurring shortly after a small uptick, is a topic for another day.

    Rodriguez ends the September 1994 Letter to Shareholders with a quote that can’t be beat:

    Thank goodness we focus on individual stocks rather than trying to forecast the stock market. The former is far more rewarding and predictable.
    This last quote by Rodriguez explains why the New Low Observer team places so much emphasis on individual stocks rather than mutual funds, index funds and ETFs. With all of the aforementioned products, if a selling spree ensues, the fund can decline despite the quality of the holdings.
    • Hand wringing over the threat of recessions helps to create value in the market.
    • Individual stocks, not funds, have a greater probability of generating higher investment returns.

    Intel Buys McAfee, New Low Gets it Right…Again

    Today it was announced that Intel (INTC) agreed to buy McAfee (MFE) for $7.68 billion.  In a series of articles that started on March 20, 2010 (article link), the New Low Observer team bubbled with excitement over the fact that the chip sector, as broad as it is, was severely undervalued.  On March 20th we said:
    "...it is noted that the majority of the companies that pay a dividend are related to the chip sector. Clustering of companies in a specific industry may indicate that the entire sector is undervalued."
    On March 22, 2010 (article link), the New Low team answered a reader question about Applied Material (AMAT).  In that article, titled "Applied Materials and the Chip Sector Should Be on Your Radar," we said:
    "Our opinion is that the chip sector is ripe for mergers and acquisitions."
     Finally, on March 22, 2010 (article link), the New Low team, prompted by the purchase of Techwell Corp. (TWLL) by Intersil Corp. (ISIL), pointed out specific reasons why we thought that the chip sector was ripe for mergers, acquisitions and/or extremely undervalued in the following quote:
    "...the fact that the purchase was done with cash is a testament to the fact that the chip manufacturers have abundant cash or are under priced and undervalued."
    We closed our March 22, 2010 (article link) article with a quote that we hope ever reader of our website will put to the test.
    "Once it can be verified that companies in a specific industry are undervalued, you can rest assured that the mergers and acquisitions will begin. The fact that cash is being used to buy up companies is the final nail in the coffin on the theory of an undervalued sector."
    Since we started the New Low Observer, we have been able to identify the water sector, the biotech/pharma sector, the medical device sector and now the chip sector as undervalued before acquisitions or substantial price gains occurred. It should be noted that we don't have any special skills, just the willingness to carefully observe and sometimes buy companies that have fallen to a new low. Get the research going for the companies that are part of the chip sector, and never chase a stock that has a rising price.

    Richard Russell Review: China in the ’60s

    The genius of Richard Russell can be found in his ability to observe.  At least 30 years before China was on the lips of yet to be born hedge fund managers and venture capitalists,  Richard Russell was providing clarity on the future of China while it was in the throes of Communist power.  The following are excerpts of Russell's commentary on China during the 1960's.  Russell himself never touts his record on his prescient views specifically on China, consider this among the first.

    July 25, 1962. Issue Number 188. page 4.
    In this issue, Russell compares the conventional wisdom with what ultimately became the outcome which tended to be counter, or opposite, to the prevailing view. One comparison that was made was from the period of 1958-1961.  Russell said: “Russia [was] way ahead of U.S. in space. Communists taking over the world and apparently unstoppable. Everything [was] going Russia’s way.” The final reality was that by 1962 “Russian space progress greatly exaggerated. Russia runs into economic trouble. The rise of China as the possible great threat.”
    May 25, 1965. Issue Number 289. page 4.
    “A fascinating aside on the gold picture is the news that Red China has now joined Russia as an interested accumulator of gold. According to the New York Times, China has recently purchased over $60 million of gold through the London Gold pool.”
    December 21, 1965. Issue Number 309. page 2.
    “A strong, competitive, aggressive country tend to accumulate gold, while a country which is plagued by inflation, rising costs, ineffective budget control and political ineptitudes tends to lose gold.”
    December 21, 1965. Issue Number 309. page 4.
    “China obviously wants to prolong the war [with Viet Nam], and it is this writer’s opinion that China sees the war as part of her economic battle with the U.S. China knows that continuation of the war will have the effect of bleeding this nation dry.”
    January 11, 1966. Issue Number 311. page 2.
    “As I see it, China is very much afraid of war with the U.S. (see Sundry Comments), and the fact is that China has backed away from real confrontation with the U.S. whenever that possibility has arisen. On the other hand, I believe Russia would like the keep the war expanding in the hopes that the U.S. will ultimately turn her nuclear capabilities against China (note the reports of new giant Russian-made mortars in the hands of Vietcong). If Russia can bring this off, she will have rid herself of the Chinese nuclear and population explosion threat, and she will have emerged as the second or greatest power on earth.”
    February 1, 1966, Issue Number 313. page 2.
    “It is well to remember that the Communists (ironically) view capitalism from an orthodox (pre-Keynesian) standpoint, and the Chinese in particular have always been fiscal conservatives.”
     “An interesting aside is that renewed gold buying has come in from Red China (in the London Market). This prompted the London Economist to note ‘The buying represents not a switch out of sterlings, but out of Swiss francs. China has apparently been accumulating them in greater quantity than was generally suspected.’ This gold buying fits in with the writer’s thesis that China is fighting an economic war with the U.S., and that she wants ultimately to compete with capitalism in the marketplace. China’s unannounced motto might be, ‘Keep buying gold while the U.S. loses her own gold.’”
    September 21, 1966, Issue Number 335. page 3.
    “The Third World force is to be China, the looming giant of the East. In time, thinks DeGaulle, the buffer force will be ‘cemented’ and grow powerful, in time China will be a superpower to be reckoned with…”
    “Russia and China are fully aware of the power of the yellow metal, and both are making every effort to bolster their holdings. The scene is set for drama over Africa. But in this writer’s opinion, history will favor those who understand the old adage, ‘Gold will win.’”
    February 17, 1967, Issue Number 349. page 2.
    “…Russia wants the war to continue, since it keep the U.S. ‘aimed’ continually at Russia’s real enemy, China.”

     
    As with the first entry on July 25, 1962, it may be necessary to reflect on the conventional wisdom to determine if things going forward may not turn out as many analysts expect. 
     
    Citation Note:

    Highest Yielding Nasdaq 100 Stocks

    Below are the Nasdaq 100 companies that are within 20% of their respective 52-week lows and ranked by highest dividend yield. Stocks that appear on our watch lists are not recommendations to buy. Instead, they are the starting point for doing your research and determining the best company to buy. Ideally, a stock that is purchased from this list is done after a considerable decline in the price and considerable due diligence.
    Symbol
    Name
    Price
    P/E
    EPS
    Yield
    P/B
    % from Low
    Garmin Ltd.
    $27.05
    8.17
    $3.31
    5.40%
    2.09
    1.92%
    Paychex, Inc.
    $24.97
    18.93
    $1.32
    5.00%
    6.39
    1.30%
    Maxim Integrated Products
    $16.75
    68.93
    $0.24
    5.00%
    2.12
    6.01%
    KLA-Tencor Corporation
    $29.10
    23.72
    $1.23
    3.40%
    2.18
    9.03%
    Intel Corporation
    $19.15
    11.46
    $1.67
    3.20%
    2.36
    4.59%
    Linear Technology
    $29.25
    18.52
    $1.58
    3.10%
    170.06
    14.44%
    Applied Materials, Inc.
    $11.17
    34.91
    $0.32
    2.50%
    2.05
    2.10%
    Steel Dynamics, Inc.
    $13.69
    14.35
    $0.95
    2.20%
    1.44
    6.21%
    Microsoft Corporation
    $24.40
    11.61
    $2.10
    2.10%
    4.60
    7.35%
    QUALCOMM
    $37.95
    19.96
    $1.90
    2.00%
    3.09
    19.98%
    Staples, Inc.
    $19.11
    17.68
    $1.08
    1.90%
    2.08
    1.54%
    Cintas Corporation
    $25.84
    18.31
    $1.41
    1.80%
    1.57
    11.86%
    Patterson Companies Inc.
    $26.66
    14.97
    $1.78
    1.50%
    2.29
    10.48%
    Costco Wholesale
    $55.31
    19.79
    $2.80
    1.50%
    2.21
    17.43%
    Activision Blizzard, Inc
    $10.87
    42.13
    $0.26
    1.40%
    1.22
    9.47%
    Teva Pharmaceutical Industries
    $49.97
    17.75
    $2.82
    1.30%
    2.35
    6.34%
    Ross Stores, Inc.
    $49.03
    12.31
    $3.98
    1.30%
    4.93
    15.91%
    Sigma-Aldrich Corporation
    $53.84
    17.65
    $3.05
    1.20%
    3.85
    15.78%
    CA Inc.
    $18.32
    12.04
    $1.52
    0.90%
    1.83
    2.92%
    Oracle Corporation
    $22.66
    18.74
    $1.21
    0.90%
    3.74
    12.74%
    DENTSPLY International Inc.
    $30.24
    16.32
    $1.85
    0.70%
    2.62
    6.86%
    Watch List Summary
    The best performing stock from our July 30th Nasdaq 100 Watch List was Vertex Pharmceuticals (VRTX) which increased +7.52% .  Much of Vertex's gain can be attributed to a study which indicated that the hepatitis C drug may allow for a shorter treatment time (Forbes article).  Vertex's main competetitor in this area is Merck.
    The worst performing stock from July 30th was Seagate Technology (STX).  Seagate fell -10.92% on news of a downgrade from Barclays Capital (Barron's article).  The expectation is that weak demand will impair profit margins at least until the end of 2010.
    This week's list makes it challenging to ignore Paychex (PAYX) and Garmin (GRMN).  The arguments that are made for PAYX increase each day the price declines.  According to Valueline, PAYX normally trades at fair value around 22 times the cash flow per share.  If this were the case, PAYX would be trading around $35.20 or 29% higher than Friday August 13th closing price based on 2010 estimated cash flow.   The primary concern with PAYX is the dividend payout ratio which is very high.  GRMN wouldn't be so difficult of an investment  if they paid a quarterly dividend.  However, Valueline has GRMN priced at fair value around $44.10 or 63% above the current price.

    International Dividend High Fliers

    Below are the top ten current and former international dividend high fliers (ranked by dividend yield) that trade as ADRs on the New York Stock Exchange. These are companies that have had a history of dividend increases over the last several years in a row. While this list contains the top ten companies, the full list of 40 companies within 20% of the 52-week low can be found here.
    Symbol Name Price P/E EPS Yield P/B % from Low
    CRH CRH PLC $19.17 16.98 1.13 5.50% 1.1 1.29%
    CWCO Consolidated Water $9.68 21.37 0.45 3.00% 1.14 1.79%
    SNY Sanofi-Aventis SA $28.64 9.65 2.97 3.80% 1.13 2.25%
    ALTE Alterra Capital Holdings Ltd $17.65 4.79 3.68 2.60% 0.73 2.26%
    UL Unilever PLC $26.66 15.37 1.73 4.10% 4.77 3.57%
    DEG Etablissements Delhaize Freres $66.30 10.05 6.6 2.00% 1.22 3.74%
    UN Unilever NV $27.02 15.58 1.73 4.00% 4.82 3.84%
    PRE PartnerRe Ltd. $72.55 4.75 15.28 2.70% 0.78 4.95%
    TEVA Teva Pharmaceutical Industries $49.97 17.75 2.82 1.30% 2.35 6.34%
    ESLT Elbit Systems Ltd. $52.10 0 0 0 0 7.42%
    STO Statoil ASA $19.84 13.35 1.49 3.90% 1.92 7.59%
    SYT Syngenta AG $46.84 17.94 2.61 2.00% 3.25 9.11%
    RNR RenaissanceRe Holdings $55.86 4.02 13.9 1.80% 0.98 10.70%
    AXS Axis Capital Holdings $30.40 8.77 3.47 2.80% 0.73 11.68%
    KYO Kyocera Corp $87.80 19.5 4.5 N/A 1.05 13.07%
    ACE Ace Limited $53.42 6.3 8.48 2.50% 0.84 13.44%
    ASR Grupo Aeroportuario del Sureste $44.89 15.52 2.89 4.10% 1.2 13.70%
    TMX Telefonos de Mexico $14.83 9.51 1.56 5.10% 4.09 14.08%
    SU Suncor Energy Inc $31.59 19.51 1.62 1.20% 1.49 14.25%
    PBR Petroleo Brasileiro S.A. $35.87 N/A - - N/A 14.93%
    NGG National Grid $42.38 9.71 4.37 8.50% 3.18 15.41%
    NVS Novartis AG $50.19 11.75 4.27 3.30% 2.05 15.43%
    TOT Total S.A. $49.76 8.95 5.56 4.70% 1.43 15.53%
    SNN Smith & Nephew SNATS, $44.32 14.25 3.11 1.30% 3.43 15.72%
    SLB Schlumberger  $58.76 23.16 2.54 1.40% 3.58 16.31%
    CCH COCA COLA HELLENIC BOTTLING $23.12 15.56 1.49 1.40% 2.47 17.06%
    EOC Empresa Nacional de Electricida $49.99 13.89 3.6 3.00% 3.15 17.71%
    GSK GlaxoSmithKline PLC $38.14 15.59 2.45 5.00% 7.04 18.63%
    CHL China Mobile Limited $52.69 12.59 4.18 3.20% 2.87 18.64%
    BG Bunge Limited $54.19 3.92 13.83 1.70% 0.76 19.47%
    AMX America Movil, S.A.B. $49.53 13.99 3.54 0.50% 4.75 19.81%
    WSH Willis Group Holdings $29.92 11.31 2.65 3.40% 2.12 19.82%
    Please be sure to calculate the payout ratios before buying these stocks. Payout ratios above 70% are cutting it close if you're not prepared for the potential downside risk. The stock symbols next to the company names take you directly to the history of dividend payments. As always, only buy these stocks if you're willing to accept losing at 50%, otherwise, the risk may outweigh the reward. Thanks again to the author of The Stock Market Advantage for the suggestion on including international stocks.

    Watch List summary

    Below are the companies that appeared on our international list for May 30, 2010.

    Symbol Name May 30, 2010 August 13, 2010 % change
    NGG National Grid $40.54 $42.38 4.54%
    GSK GlaxoSmithKline $33.46 $38.14 13.99%
    TEF Telefonica $57.37 $66.93 16.66%
    AZN AstraZeneca $42.25 $51.39 21.63%
    RUK Reed Elsevier $27.99 $33.42 19.40%
    BP British Petroleum $42.95 $38.93 -9.36%
    TMX Telefonos de Mexico $14.07 $14.83 5.40%
    TOT Total S.A. $46.63 $49.76 6.71%
    BTI British American Tobacco $58.55 $70.36 20.17%
    STD Banco Santander $10.15 $12.07 18.92%
    Average gain 11.81%
    Double digit gains were pronounced for this group except the usual suspect BP along with Total, Telefonos de Mexico and National Grid. The previous list was ranked by dividend yield instead of those closest to the new low. However, all companies on the May 30th list were all within 10% of their respective 52%-week low.
    Email our team here.

    From Macro to Micro, Cree Follow Up

    We wrote an article titled "It's a Matter of Economics, Cree is Overpriced" back in early June. The purpose of that article was not urging investors to short Cree or the market but to observe what happen to company with overly optimistic expectations. We felt that Cree (CREE) was a perfect case in point. So where are we with CREE?
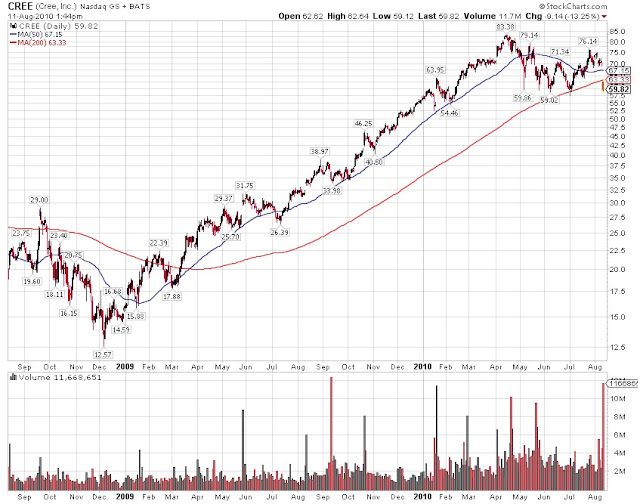
    Yesterday Cree reported earnings that exceeded expectations but revenue guidance missed the consensus view. As a result, UBS analyst took the target price down to $64 from $83. The target price of $83 was reached in April and since the stock has been trading in $60 and $75 range.
    Fundamental
    The data looks good for Cree. Revenue rose 79% year-over-year while earnings per share exploded 348%! Operating margin expanded to 25.9% from 19.7% mentioned in the last article. These are amazing figures but how is it possible that such a great quarter shares could be down more than 10%?  Possible explanation is that all the good news have been discounted into the stock as suggested by Dow Theory.
    Another piece of interesting data to support our argument was from the equipment side of the LED market. We mentioned that Kulicke & Soffa (KLIC) had a tremendous amount of booking (equipment orders) from the LED side of the market. Prior to that, they didn't have any business in that segment. Additional data point came another research firm, Displaybank, which claimed that the Blue LED capacity is to double. The equipments mentioned are the Metal-Organic Chemical Vapor Deposition (MOCVD) systems which is the primary method of depositing film onto wafers in the LED making process. The front-end of the market (depositing films) has now confirmed with back-end (assembly).
    Technical Picture
    The up-trend was established beginning December 2008. As the market (Dow Jones Industrial Average) made a lower-low in March of 2009, Cree held above their December 2008 low pointing to a sustained rally. Through out 2009 and the most of 2010, it held above the 50 days moving average and 200 days moving average. The collapse in price today established an opening price below the 200 days moving average which we use as a long-term trend of the stock.

    Summary
    Today's fallout of Cree could simply be just another pull back then resume the rally. We're not quite so sure. At this rate, we wouldn't touch it with a 10-foot pole. Once again, we don't encourage shorting. Shares of Cree could easily move back to $80 as it retraces the old high. The purpose is to point out the obvious fact that when things are rosy and analyst are upping their forecasts inflating the P/E, investors should be looking for the exit sign. The macro view of margin contraction and entrance of competition are nature of business which affect the micro view in the long run. The short run of the stock market could be anything but the long run are often determined by value. After the fall of today, Cree trailing P/E will be around 35, much lower than 60 we observed in June. Even if earning exploded, multiple (P/E) contraction will be the key to share price going forward.

    Sources:
    It's a Matter of Economics, Cree is Overpriced
    Report: Blue LED capacity set to double
    Cree Swoons On Disappointing Guidance; UBS Cuts Rating
    Cree Reports Record Revenue and Net Income for the Fourth Quarter and Fiscal Year 2010

    Email our team here.

    Canadian Dividend Achievers

    This list of Canadian Dividend Achievers, published by Mergent's, includes current and former Canadian Dividend Achievers and then ranking the companies based on those closest to the 52-week low as of August 6, 2010. We've updated the stock symbol to connect to the Financial Post, one of Canada's top business publications. You'll find the most complete fundamental information on these companies at the FP website. However, Yahoo!Finance probably has the better long-term charts and historical dividend data. Enjoy.
    FP Yahoo!Finance Name Price % from Low
    RBA RBA.TO RITCHIE BROS AUCTIONEERS INC. $18.51 2.27%
    ESI ESI.TO ENSIGN ENERGY SERVICES INC. $12.70 4.35%
    PWF PWF.TO POWER FINANCIAL CORP. $28.29 5.76%
    IMO IMO.TO IMPERIAL OIL $40.15 6.36%
    POW POW.TO POWER CORP CDA $26.98 7.28%
    GWO GWO.TO GREAT-WEST LIFECO INC $24.76 7.61%
    IGM IGM.TO IGM FINANCIAL INC. $40.18 9.45%
    CTC.A CTC-A.TO CANADIAN TIRE CORP $56.99 12.05%
    SU SU.TO SUNCOR ENERGY INC. $34.11 14.04%
    TIH TIH.TO TOROMONT IND $24.88 14.18%
    SNC SNC.TO SNC-LAVALIN SV $47.76 14.84%
    TLM TLM.TO TALISMAN ENERGY INC. $18.15 15.53%
    TRI TRI.TO THOMSON REUTERS CORP. $37.85 15.68%
    PSI PSI.TO PASON SYSTEMS INC. $11.03 16.11%
    BNS BNS.TO BANK OF NOVA SCOTIA $50.88 18.44%
    TD TD.TO TORONTO-DOMINION BANK $73.09 19.51%
    IAG IAG.TO INDUSTRIAL ALLIANCE $32.53 19.68%

    Watch List Summary
    Below are the best and worst performing Canadian Dividend Achievers in the period from July 23, 2010 to August 6, 2010.
      Leaders:
      • Canaccord Genuity and Raymond James upgraded Talisman Energy on August 4, 2010. Shares of Talisman Energy rose +8.49%.
      • Cameco Corporation rose +6.43%.
      • Finning International was appointed as the Caterpillar dealer for Northern Ireland on August 2, 2010. Shares of Finning International rose +6.96%.
      Laggards:
      • Corus Entertainment fell –8.40%.
      • Industrial Alliance fell –7.35%.
      • Ritchie Brothers Auctioneers fell –3.14%.

      Next Week:

      • Nasdaq 100 Watch List
      • International Dividend Achievers

      Dividend Achiever Watch List

      At the end of the week, our watch list contracted to 30 companies. Here is the watch list which ranks current and former Dividend Achievers that are within 10% of their respective 52-week low for August 6, 2010. We filtered out companies that has no earning and payout ratio in excess of 100%. Stocks that appear on our watch lists are not recommendations to buy. Instead, they are the starting point for doing your research and determining the best company to buy. Ideally, a stock that is purchased from this list is done after a considerable decline in the price and extensive due diligence.

      Symbol Name Price % Yr Low P/E EPS (ttm) Div/Shr Yield Payout Ratio
      PBI Pitney Bowes Inc   20.71 1.02% 10.79 1.92 1.46 7.05% 76%
      WST West Pharmaceutical Services, Inc. 35.26 2.23% 15.81 2.23 0.64 1.82% 29%
      PAYX Paychex, Inc.  25.56 2.69% 19.36 1.32 1.24 4.85% 94%
      HGIC Harleysville Group Inc.  30.90 2.83% 11.24 2.75 1.30 4.21% 47%
      CWT California Water Service Group 34.97 3.43% 18.90 1.85 1.19 3.40% 64%
      BEC Beckman Coulter, Inc. 46.12 3.87% 21.96 2.10 0.72 1.56% 34%
      FFIN First Financial Bankshares, Inc.  47.88 4.82% 18.34 2.61 1.36 2.84% 52%
      DNB Dun & Bradstreet Corp. 68.96 5.28% 14.86 4.64 1.40 2.03% 30%
      FII Federated Investors Inc 21.35 5.38% 11.18 1.91 0.96 4.50% 50%
      JNJ Johnson & Johnson   59.96 5.45% 12.39 4.84 2.16 3.60% 45%
      LOW Lowe's Companies Inc 20.28 5.90% 16.62 1.22 0.44 2.17% 36%
      TR Tootsie Roll Industries Inc  24.58 6.09% 26.15 0.94 0.32 1.30% 34%
      BBT BB&T Corp. 25.20 6.11% 23.77 1.06 0.60 2.38% 57%
      UMBF UMB Financial Corp.  36.69 6.13% 15.29 2.40 0.74 2.02% 31%
      AWR American States Water Co. 33.24 6.54% 18.57 1.79 1.04 3.13% 58%
      WAG Walgreen Co. 28.00 6.63% 13.46 2.08 0.70 2.50% 34%
      NTRS Northern Trust Corp.  48.57 6.86% 15.92 3.05 1.12 2.31% 37%
      SFNC Simmons First National Corp.  26.25 7.14% 15.35 1.71 0.76 2.90% 44%
      CSL Carlisle Companies Inc. 32.75 7.17% 14.06 2.33 0.64 1.95% 27%
      MDT Medtronic, Inc. 37.81 7.63% 13.55 2.79 0.90 2.38% 32%
      UVV Universal Corp. 37.78 7.70% 6.65 5.68 1.88 4.98% 33%
      UFPI Universal Forest Products, Inc.  30.92 8.15% 25.14 1.23 0.40 1.29% 33%
      TRH Transatlantic Holdings, Inc. 47.38 8.40% 7.54 6.28 0.84 1.77% 13%
      WMT Wal-Mart Stores, Inc. 51.79 8.42% 13.59 3.81 1.21 2.34% 32%
      CL Colgate-Palmolive Co. 76.50 8.59% 18.26 4.19 2.12 2.77% 51%
      ALL Allstate Corp.   28.98 8.70% 12.60 2.30 0.80 2.76% 35%
      HCC HCC Insurance Holdings, Inc. 25.98 8.93% 8.66 3.00 0.54 2.08% 18%
      MSA Mine Safety Appliances Co 24.55 9.60% 21.92 1.12 1.00 4.07% 89%
      SBSI Southside Bancshares, Inc.  19.08 9.72% 7.23 2.64 0.68 3.56% 26%
      HSC Harsco Corp. 23.15 9.92% 19.13 1.21 0.82 3.54% 68%
      OMI Owens & Minor, Inc. 28.08 10.03% 14.25 1.97 0.71 2.53% 36%
      30 Companies


      Watch List Summary
      The best performing stock from the previous list was Pfizer (PFE) which rose 11.4%  The worst performing stock was State Auto Financial (STFC) which fell 6.3%.  Because our list has more than a handful of great companies, We urged investors to filter for companies with less than 50% payout ratio. This should minimized the risk of dividend reductions if earnings are to fall by half. If you understand the companies' history and their ability to pay the dividend, then payout ratios in excess of 50% may be considered.

      Pitney Bowes (PBI) fell like a rock on Thursday after missing analyst estimates on their earnings along with a a credit rating downgrade from S&P. Strangely, PBI's price action this week replicated last year's price action after they reported their earnings. The New Low team highlighted that price action on July 31, 2009. As a result, we are beginning to dig deeper into the details of this company in light of recent event.

      After a heart-stopping drop of 15%, we took a position in Beckman Coulter (BEC). Because we're confident that BEC will fall further, we implemented the first of 3 purchases that we're expecting to make.  We're ready and excited to make the next two purchases if they happened to be triggered at much lower levels.

      Johnson & Johnson (JNJ) is still interesting at this level.  Based on IQTrends (http://www.iqtrends.com/), JNJ is undervalued at or near 3.5% yield. With current yield of 3.60%, we suggest readers adding JNJ to your investment watch list.

      Once again, we suggest readers use the March 2009 low (or companies' most distressed level in the last 2 years) as the downside projection for investing.  Our view is to embrace the worse case scenario prior to investing.  The November 2008 or March 2009 low fits that description.  Although we use the one year (52-week low) time frame, the past year was nothing but a major bull run and anyone who bought at or near the low could, and should, be taking profits.  It is important to place these companies in your own watch list so that when the opportunity arises, you can purchase them with a greater margin of safety.

      Next Week:

      • Nasdaq 100 Watch List
      • International Dividend Achievers

      Email our team here.

      Dow Theory, Stock Markets and Economic Forecasting

      A reader writes:
      In a recent Time Magazine article dated July 27, 2010, David Rosenberg said the following:
       

      "…But the market gets it wrong as often as it gets it right – it was wrong to forecast a recession in the fall of 1987, again in the summer of 1998 and again in the winter of 2003. It was wrong to forecast sustained growth in the summer of 2000, a recovery in the winter of 2002, an avoidance of recession in the fall of 2007 and the end of the downturn in the spring of 2008. It may be a discounting mechanism, but the stock market has a spotty record – let's remind ourselves of that."

      Does this mean that the Dow Theory was not giving the right signals for the stock market during all the periods Rosenberg mentions above? Can you tell me what was Russell saying with regards to the stock market's and the economy's trend as forecasted by the Dow Theory during those periods?
       
      To put it another way, there are two separate issues involved here:
       
      • First, does the Dow Theory correctly forecast the bull/bear trend reversals in the stock market? (Answer seems yes, though with a considerable lag.)
      • Second, does the stock market correctly forecast recoveries/recessions in the economy? (Some say No!)
      Our Response:
      To address the preceding questions, we’ll first cover the role of Dow Theory from our perspective. Then we’ll address the aspect of modern usage of Dow Theory from the leading proponents with the widest following. Then we’ll circle round to address Dow Theory and how to make it useful regardless of its obvious shortcomings. We’ll address Richard Russell’s take on Dow Theory and what he was saying about the market using Dow Theory. We’ll make comments on David Rosenberg’s assessment that the stock market “…gets it wrong as often as it gets it right” by comparing the periods of recession with the Dow Jones Industrial Average.
       
      When thinking in terms of Dow Theory, the New Low Observer team doesn’t take the conventional view on how it should be used. To us, Dow Theory isn’t a market forecasting tool as much as it is an allocation indicator. When there is a bull market indication then we have a target allocation of 33% or more for a single stock. When there is a bear market indication then we have a target allocation of 25% or less for an individual stock.
       
      Some take Dow Theory too seriously and extrapolate far beyond even the most rudimentary use and allow it to become a make or break approach for buying or selling stocks. The most useful, but least understood, element of Dow Theory is Charles Dow’s discussion of values. Subsequent writing on the topic of values, in the context of Dow Theory, by Nelson, Hamilton, Rhea, Collins, Shumate, Schaefer, Russell and Schennep are worth heaps more than any successful market call of a top or bottom. In fact, the Dow Theory understanding of values trumps all market signals since great values can exist in both bull and bear markets.
       
      Aside from ignoring the emphasis on values, the two most common mistakes that are made when thinking about Dow Theory are misinterpretation and misapplication. Accurate interpretation is the primary goal of every Dow Theorist. However, it becomes easy to get overwhelmed with current market conditions. This makes the acceptance of what the indicator is saying very challenging. Front load a few personal experiences from the “Great” Depression and WWII and it become impossible to see the market from the trees. Renowned Dow Theorist Robert Rhea once cautioned those trying to interpret the markets (especially Dow Theory) that, “the wish must not father the thought.” In many cases, it becomes too easy for the wish to supercede the judgment of markets.
       
      The linked article written on June 16, 2010 on MarketWatch.com titled “Avoiding a Death Sentence” by Mark Hulbert provides a perfect example of misinterpretation and misapplication when trying to use Dow Theory. We get misapplication by trying to recommend selling stocks based on the misinterpretation of a potential bear market indication.
       
      In the article, Hulbert highlights opinions on Dow Theory from the most prominent Dow Theorists today starting with Richard Russell, Jack Schannep and Richard Moroney. The basic view in the article was that the stock market was grasping at the last straws of a bull market and it was only a matter of time before a sell signal would to be given.
      Richard Russell was the only one of the three Dow Theorists who was unwavering in his view that a sell signal had already been registered. The article quotes Russell as saying that, “the curse is cast. …[The breaking of the May lows] means that the primary bear market is resuming. The monster is creeping towards Bethlehem.”
       
      Schannep and Moroney seemed to be in agreement that a violation of the June 7th low would be what they needed to see in order for them to officially declare that a sell signal had been indicated, according to Dow Theory. As it happens, the June 7th lows were violated for both the Dow Industrials and Dow Transports (on a closing basis) which means that both Dow Theorists would have given sell recommendations to their newsletter subscribers.
       
      The misinterpretation of Dow Theory that was executed by these three theorists was a function of two distinct issues. First, there wasn’t a focus on prior action as suggest by Charles H. Dow. Our May 13th article on Dow Theory outlined the specific action that should be watched for prior to the occurrence based on the Dow Industrials movement from January 19th to February 5th. The next item that was misinterpreted was the May 6th “flash crash.” The fact that the Dow Industrials and Dow Transports had similar closing lows of May 6th made the otherwise technically significant closing price unimportant in comparison to the intra-day low. The intra-day low reflected either the psychological influence needed to fall as much as it did or the psychological influence needed to recover from such a low.
       
      These are the factors that I think contributed to the misinterpretation of the signals given. Some Dow Theorists have said that because they take an arms length approach to the market (i.e. not invested personally in stocks) that their interpretation is not clouded by the desires for financial gain. However, those same Dow Theorists manage to get it wrong just as often as anybody else.
       
      Next is the issue of the misapplication of Dow Theory. William Peter Hamilton was correct in titling his book on Dow Theory The Stock Market Barometer. Like a weather barometer, Dow Theory was intended to be a guide to the direction of the market on a short-term basis. The readings from a weather barometer tell you to either bring an umbrella or leave it at home. The barometer never tells you to stay at home if it is going to rain. Telling investors that a bear market has been signaled and therefore you need to sell all or some of your stocks is the equivalent of saying, “its going to rain today, you’d better stay home.”
       
      Again, Dow Theory wasn’t intended to generate a buy or sell indication. Instead, it was created to tell investors what the current conditions of the market are with a 3-month, 6-month, or 9-month peek at what might lay ahead. If the indication is that we’re in a bear market then we could expect that the market will decline further. If the indication is that we’re in a bull market then we could expect that the market will rise. What an investor does with this information is something else altogether. In many respects, buy and sell reactions based on Dow Theory bull and bear market indications are misapplications of the theory.
       
      Throughout the writings by Rhea and Hamilton, it has been noted that Dow Theory is not a “get rich quick” way to make money in the stock market. Neither is the theory infallible. Because misinterpretation of Dow Theory is so easy to accomplish, the New Low Observer team attempts to focus more attention on values and the application of Dow Theory as an asset allocation tool rather than being right about the big picture or primary trend.
       
      When you combine the effects of misinterpretation with misapplication by some of the most renowned Dow Theorists, it is no wonder that critics complain that Dow Theory is archaic. However, put in its proper context, observations in Dow Theory can provide better judgment in selecting individual stocks at appropriate times with proper allocations. Although Dow Theory generally gets it right about the stock market direction on a short term basis, I personally wouldn’t rely on the market calls as much as I do with Dow’s writings on values.
       
      Like most market participants, we don’t necessarily know values in the way that someone as smart as Warren Buffett might. However, everyone is clear on the fact that well established companies with consistent dividend increasing histories near a new 52-week low are most likely to be closer to “real” value propositions instead of stocks in a well established rising trend or at a new high. Charles Dow was very clear that values, above all else, determine the direction of the market. This includes the values that can be found within a bull or bear market.
       
      In regards to Richard Russell’s commentary on Dow Theory, it is necessary to take Russell’s bias into account when determining whether he was wrong or right about the markets in 1987, 2000, 2002, 2003, 2007, and 2008. Russell’s bias is infinitely and always to the downside and this bias has grown as time has passed. This is what makes his late 1974, early 1975 call of a market bottom so amazing and worth studying.
       
      Despite being right at the time, it is next to impossible to say whether Russell truly called the tops of 1987, 2000, 2007, and 2008 or was continuing with his downside bias (false positives). However, what we can gather from each call of a market top are the nuances that are very distinct from the other times that Russell was bearish. You’d have to read all of his letters from the beginning of a rising market to the peak to know the distinctions.
       
      How biased against the upside is Richard Russell, despite what Dow Theory and his proprietary Primary Trend Indicator says? The following quote should summarize Russell’s attitude.
       
      In his latest mailing, Steve [Leuthold] talks about secular bear markets. What’s a secular bear market? They are the really big ones. Steve tells us that the dictionary defines secular as ‘coming once in an age.’ Steve Leuthold says that in 46 years in this business, he has only seen two secular bear markets, the bear market of 1969 to 1974, and the bear market of 1999 to 2002. Fair enough. But I disagree. Writing at the time, I called the bear market as starting in 1966, not 1969, but Steve and I both agree that the secular bear market ended with the crushing market collapse of 1973-1974. We both agree that another secular bear market began in 1999. Steve believes that bear market ended in 2002. But I believe the bear market that started in 1999 is still in force, although it’s been extended due to the manipulations of the Federal Reserve under Alan Greenspan.”
      Richard Russell. http://www.dowtheoryletters.com, staff2@dowtheoryletters.com, Letter 1378, November 17, 2004, Page 3
      Even though the market bottomed in October 2002 and Dow Theory signaled a bull market in June 2003, Russell stuck to his bearish view. In his July 19, 2006 letter, Russell said, “The Big, Big Picture is this-the bear market that began in January 2000 never ended.” Russell did not indicate that we were in a bull market until January 2009. Russell managed to ignore the Dow Theory signal that was given in June 2003 at around the 9000 level for the Dow Industrials all the way to the peak in 2007 at 14,100. A span of 4 years and 55% wasn’t enough to convince Russell that the last bear market had ended. As I mentioned before, out of the blue we got the January 2009 bull market call by Russell, which seemed, at the time, to defy all available data and logic.
       
      The comment posed by David Rosenberg, in the July 27th issue of Time Magazine, “that the markets continuously get it wrong,” is certainly a matter of subjectivity. Rosenberg’s assessment could be very accurate if viewed from the perspective that the popular media outlet’s parade of talking heads, representing the voice of the market, got it all wrong beforehand. However, if viewed from a Dow Theory perspective, especially in retrospect, the message that the market was sending was very clear and quite accurate, albeit somewhat delayed. Naturally, Dow Theory isn’t perfect but the consistency, as compared to the alternatives, is enough to give a general overview of future market activity that is later support by some, not necessarily all, economic indicators.
       
      To be specific with Rosenberg’s contention, let us get the data portion on recessions during secular bull and bear markets out of the way. Below is a side-by-side comparison of the National Bureau of Economic Research (NBER) account of economic peaks to troughs (recessions) and the Dow Jones Industrial Average of peaks to troughs (bear markets).
       
      Peak Trough DJIA peak DJIA trough DJIA % change Coincidence
      June 1899(III) December 1900 (IV) 4/4/1899 6/23/1900 -29.40% YES
      September 1902(IV) August 1904 (III) 9/19/1902 11/9/1903 -37.80% YES
      May 1907(II) June 1908 (II) 1/19/1906 11/15/1907 -48.50% YES
      January 1910(I) January 1912 (IV) 11/19/1909 7/26/1910 -26.80% YES
      January 1913(I) December 1914 (IV) 9/30/1912 12/24/1914 -43.50% YES
      August 1918(III) March 1919 (I) no coincidence no coincidence no coincidence NO
      January 1920(I) July 1921 (III) 11/3/1919 8/24/1921 -46.60% YES
      May 1923(II) July 1924 (III) 10/14/1922 7/31/1923 -16.00% YES
      October 1926(III) November 1927 (IV) no coincidence no coincidence no coincidence NO
      August 1929(III) March 1933 (I) 9/12/1929 7/8/1932 -89.20% YES
      May 1937(II) June 1938 (II) 3/10/1937 3/31/1938 -49.10% YES
      February 1945(I) October 1945 (IV) no coincidence no coincidence no coincidence NO
      November 1948(IV) October 1949 (IV) 6/15/1948 6/13/1949 -16.30% YES
      July 1953(II) May 1954 (II) 1/5/1953 9/14/1953 -13.00% YES
      August 1957(III) April 1958 (II) 4/6/1956 10/22/1957 -19.40% YES
      April 1960(II) February 1961 (I) 8/3/1959 10/25/1960 -16.50% YES
      December 1969(IV) November 1970 (IV) 12/3/1968 5/26/1970 -35.90% YES
      November 1973(IV) March 1975 (I) 5/26/1972 10/4/1974 -39.80% YES
      January 1980(I) July 1980 (III) no coincidence no coincidence no coincidence NO
      July 1981(III) November 1982 (IV) 4/27/1981 8/12/1982 -24.10% YES
      July 1990(III) March1991(I) 10/9/1989 10/11/1990 -15.30% YES
      March 2001(I) November2001 (IV) 1/14/2000 10/10/2002 -35.75% YES
      December 2007 (IV) no trough announced 10/9/2007 3/9/2009 -53.38% YES
      For the sake of all the economists out there, we will only view stock market declines with recessions as a coincidence indicator. We cannot know when a sustained market decline is a simple correction or an indicator of a coming recession. However, in the table above, we can see that 19 out of 24 occurrences of a recession were led, or accompanied, by a decline in the stock market. The far right column indicates if there was no coincidence or an/or the percentage change of the market when there was coincidence.
       
      I’m willing to submit to the view that the answer to this question is yes, stock markets lead or coincided with economic contractions. However, the nature of the recover may not meet the expectations of some, if not many, of the participants of the economy in question. During a secular bear market, the frequency and length of recessions will be longer and occur more often than during a secular bull market. The opposite is true during a secular bull market.
       
      It is important to note that the designation of a recession often occurs months and sometimes year(s) after the fact. For example, the indication of the December 2007 recession was given by the NBER exactly one year later. At the same time, the coincidence of the market corresponding with or leading a recession has occurred in real time. Dow Theory gave a confirmed indication of a bear market in the month of December 2007.
       
      During a secular bear market, only certain aspects of the economy will experience growth while other elements will continue to wane or hold in a range. The recession from 2007 to 2009 is just such an example. Housing and employment has not “enjoyed” the tepid growth in the economy that has occurred since the March 2009 bottom. The government has had a crowding out effect with preferential stimulus in housing and jobs, which has only prolonged the uncertainty of the “real” numbers in foreclosures and unemployment. After all, why pay your mortgage when there is a program set up to keep you in the house? Why take any old job when you could hold out for that “ideal” job because you’re getting another extension of unemployment benefits? These aren’t artificial attributes of the rising stock market and economy as some Austrian economists argue. Instead, stimulus and printing of money simply adds to the complexity within an overall secular bear market.
       
      During a secular bull market, the impact of a recession will not be as deep or broad in its scope or as long as in a secular bear market. Most elements in the economy will thrive despite a build up of otherwise dire conditions (which result in severe recessions and bear markets). One industry’s fall will not impair the breadth of the economy. Corruption and scandal, in business and politics, is looked upon as isolated incidents. There is less of a demand for a complete change of the entire system when problems are revealed. Cyclical bear markets within a bull market allow for a healthy purging of excesses and reinforce the view that prior excesses were justified somehow.
       
      Sources:

      Nasdaq 100 Watch List

      Below are the Nasdaq 100 companies that are within 10% of their respective 52-week lows. Keep in mind that the March 2009 low or the November 2008 low should be your downside target for the worst case scenario.
      Symbol Name Price P/E EPS Yield P/B % from Low
      SYMC Symantec Corp. $12.97 14.87 0.87 0.00% 2.29 1.17%
      AMAT Applied Materials $11.80 36.88 0.32 2.30% 2.19 2.79%
      NVDA NVIDIA Corp. $9.19 19.07 0.48 0.00% 1.83 3.03%
      TEVA Teva Pharma. $48.85 17.35 2.82 1.30% 2.19 3.96%
      PAYX Paychex, Inc. $25.99 19.7 1.32 4.60% 6.73 4.42%
      LIFE Life Technologies $42.99 36.04 1.19 0.00% 1.84 4.60%
      GILD Gilead Sciences $33.32 10.1 3.3 0.00% 4.4 5.01%
      XRAY DENTSPLY Intl $30.02 16.41 1.83 0.70% 2.35 6.08%
      HSIC Henry Schein, Inc. $52.49 15.11 3.47 0.00% 2.15 6.90%
      HOLX Hologic, Inc. $14.14 25.71 0.55 0.00% 1.3 6.96%
      CEPH Cephalon, Inc. $56.75 11.32 5.01 0.00% 1.79 6.97%
      GRMN Garmin Ltd. $28.51 8.28 3.44 5.00% 2.23 7.42%
      VRTX Vertex Pharma $33.66 N/A -3.5 0.00% 6.65 7.71%
      SPLS Staples, Inc. $20.33 18.81 1.08 1.80% 2.14 8.02%
      AMGN Amgen Inc. $54.53 11.57 4.71 0.00% 2.31 8.37%
      STX Seagate Tech. $12.55 4.01 3.13 0.00% 2.22 8.56%
      EBAY eBay Inc. $20.91 10.99 1.9 0.00% 1.92 9.71%
      CA CA Inc. $19.56 12.85 1.52 0.80% 1.94 9.89%

      Watch List Summary

      Of particular interest to us is Garmin Limited (GRMN) which happens to have the highest dividend yield.  We're suckers for high dividend yields which means we'll do just as much research as possible to determine if the yield is justified.  One approach that we used compares the dividend to the price as a ratio.  In this analysis, we were able to determine that the current price of $28.51, based on the current dividend, is the equivalent to the May 22, 2009 price of $19.74.  In addition, the earnings would have to decline 56% before the current dividend is no longer serviceable before borrowing, issuance of shares or the dividend is ultimately cut.  This appears to be a wide margin of safety for those concerned about earnings slippage going forward. 
      The caveat to all of this analysis on Garmin (GRMN) is that we're not sure if the company is truly committed to paying a dividend.  Since the history of dividend payments is so short (since 2003) it is hard to say whether or not the dividend will stick.  In addition, the company has an erratic dividend payment schedule.  I'd like to say that the payment is annually however we cannot be certain that the next dividend payment will occur at the same time next year as it did this year.  Finally, annual payments of the dividend requires nerves of steel in order to get through to the next dividend payment, if it arrives.
      For those drawn to the company for their dividend and the high visibility of their products, Garmin (GRMN) appears to be an interesting company to do follow-up research for the speculative portion of your portfolio.  In addition, Garmin (GRMN) might be underpriced at the current level and could be a possible takeover candidate due to their strong foothold in the niche business of GPS navigation.

      Genzyme Corp: Value is Finally Being Recognized

      There has been a lot of news about Genzyme (GENZ) being considered as a takeover candidate by Sanofi-Aventis (SNY). Typically, rumors are simply that, nothing more than prattle about a washed up company that has little or no life remaining. However, we have demonstrated that discussions of Genzyme (GENZ) being taken over are not so far fetched.
      On October 17, 2009 (article link), we had only four companies that were on our Nasdaq 100 Watch List that was within 20% of their respective 52-week lows. This was in contravention to the overall market; which was racing higher every day. So compelling were the companies on the list that we felt it was necessary to give mini-profiles on their value propositions.
      Genzyme (GENZ) was one such company that was on that list. We included Genzyme (GENZ) as the last company we profiled since we felt that it was “…a far superior value proposition.” This was despite the fact that Genzyme (GENZ) was the farthest from the new low among the companies on the list.
      On October 30, 2009 (article link), we weren’t surprised that drug and medical device makers dominated our list of companies near a new low. In that posting to our site we said, “The continued undervaluation of these companies makes them prime targets for acquisition…” Genzyme (GENZ) was on the list and trading at $50.60. The performance of the stocks that were on the on the October 30 watch list is as follows:

      The average gain for the group was 15.32% in 9 months. The worst performing stock has been Gilead Sciences (GILD) with a decline of 22.21%. The best performing stock has been Biogen (BIIB). Our sanguine view on Gilead Sciences (GILD) may be worth reviewing since it has fallen so much since October 30, 2009.
      Genzyme has already indicated that they’re not going to accept the Sanofi-Aventis (SNY). This opens the door for competing bids, which should push the price up. Our view at this time is that Genzyme is strictly a speculation, at best, given the rise of nearly 33% since our mention of being a takeover candidate in October 2009.