Below is the Price Momentum for Gilead Sciences Inc. (GILD). Continue reading
- Japan
- Market Indicator
- Price Momentum Indicators
- Richard Russell
- Silver
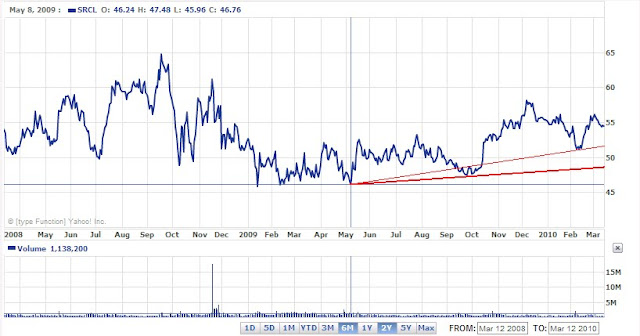
- Speed Resistance Lines
- U.S. Dividend Watch List

Below is the Price Momentum for Gilead Sciences Inc. (GILD). Continue reading
Below are the valuation targets for Gilead Sciences (GILD) for the next 10 years. Continue reading
On November 16, 2015, when Gilead Sciences (GILD) was trading at $99 per share, we posted the following long-term downside targets for the stock:
At the same time, we contrasted our downside targets with commentary from TheStreet.com to ensure that there was some balance to the perspective for our readers. TheStreet.com said the following of GILD:
“We rate GILEAD SCIENCES INC (GILD) a BUY. This is based on the convergence of positive investment measures, which should help this stock outperform the majority of stocks that we rate. The company's strengths can be seen in multiple areas, such as its robust revenue growth, notable return on equity, attractive valuation levels, expanding profit margins and good cash flow from operations. We feel its strengths outweigh the fact that the company has had generally high debt management risk by most measures that we evaluated. (TheStreet.com. Gilead Sciences (GILD) Stock Is the ‘Chart of the Day’. Albright, Amanada. November 16, 2015. ”

It is worth noting the buy rating that we gave to GILD on January 14, 2010. At the time, the fundamentals seemed to be supported by the technicals and warranted due diligence and possible acquisition. Below is our revised assessment of Gilead based on the technical attributes which is precipitated by investor reaction to the company fundamentals.

Posted in downside, Edson Gould, GILD, gilead sciences, risk, speed resistance line, SRL
Below are the Nasdaq 100 companies that are within 10% of their respective 52-week lows. Stocks that appear on our watch lists are not recommendations to buy. Instead, they are the starting point for doing your research and determining the best company to buy. Ideally, a stock that is purchased from this list is done after a considerable decline in the price and rigorous due diligence.
| symbol | Name | Price | P/E | EPS | Yield | P/B | % from Low |
| SYMC | Symantec Corporation | 14.57 | 9.28 | 1.57 | - | 2.06 | 2.17% |
| DELL | Dell Inc. | 12.12 | 6.92 | 1.75 | - | 2.28 | 2.71% |
| CHRW | CH Robinson Worldwide Inc. | 57.92 | 21.6 | 2.68 | 2.3 | 7.51 | 3.65% |
| EA | Electronic Arts Inc. | 13.47 | 58.57 | 0.23 | - | 1.75 | 4.74% |
| INFY | Infosys Ltd. | 43.62 | 14.54 | 3 | 1.3 | 3.81 | 5.36% |
| NVDA | NVIDIA Corporation | 12.12 | 14.8 | 0.82 | - | 1.72 | 5.67% |
| GMCR | Green Mountain Coffee Roasters | 23.13 | 11.11 | 2.08 | - | 1.76 | 6.25% |
| EXPD | Expeditors Int'l of WA | 39.36 | 22.75 | 1.73 | 1.4 | 3.95 | 6.49% |
| CTRP | Ctrip.com Int'l | 18.66 | 17.86 | 1.04 | 0 | 2.38 | 6.63% |
| SPLS | Staples, Inc. | 12.86 | 9.23 | 1.39 | 3.4 | 1.24 | 7.71% |
| LRCX | Lam Research | 37.62 | 16.65 | 2.26 | - | 1.72 | 8.07% |
| NFLX | Netflix, Inc. | 65.64 | 22.22 | 2.95 | - | 5.41 | 8.14% |
| WYNN | Wynn Resorts Ltd. | 104.21 | 22.1 | 4.72 | 1.9 | 46.53 | 8.76% |
| NTAP | NetApp, Inc. | 30.33 | 19.2 | 1.58 | - | 2.65 | 9.14% |
| MCHP | Microchip Technology Inc. | 32.01 | 19.4 | 1.65 | 4.4 | 3.08 | 9.25% |
| VOD | Vodafone Group | 26.58 | 12.6 | 2.11 | 7.5 | 1.1 | 9.34% |
| MRVL | Marvell Technology | 12.28 | 13.15 | 0.93 | 2 | 1.4 | 9.35% |
| ORCL | Oracle Corporation | 27.16 | 14.23 | 1.91 | 0.9 | 3.16 | 9.87% |
| CTSH | Cognizant | 58.85 | 19.81 | 2.97 | - | 4.14 | 9.92% |
Watch List Summary
Of interest on our watch list is NVIDIA (NVDA). According to Yahoo!Finance, “NVIDIA Corporation provides graphics chips for use in smartphones, personal computers (PC), tablets, and professional workstations markets worldwide.” As we’ve described in the past, we have a strong interest in chip sector stocks and believe that the long-term prospects for companies in the chip industry is very appealing.
NVDA first appeared on our watch list on June 12, 2010. At that time, NVDA was trading at $11.61. By February 18, 2011, NVDA was trading as high as $25.68 which was a gain of over +120%. We’re not certain that NVDA’s decline has ended. According to Edson Gould’s Speed Resistance Lines, NVDA has already declined below the conservative downside target of $17.87 based on the February 2011 high. The persistence of the current decline suggests that the stock could decline to the extreme downside target of $8.67. We’re doing everything we can to hold off buying this stock at the current time.

Watch List Performance Review
The following is a performance review of the top five Nasdaq 100 Watch List from June 4, 2010. Keep in mind that this is a 2 year performance review instead of a 1 year review.
|
Symbol
|
Name | 2010 | 2012 | % change |
| GILD | Gilead Sciences, Inc. | $34.71 | 49.21 | 41.77% |
| SYMC | Symantec Corporation | $13.92 | 14.43 | 3.66% |
| ERTS | Electronic Arts Inc. | $15.81 | 13.07 | -17.33% |
| APOL | Apollo Group, Inc. | $51.48 | 32.42 | -37.02% |
| QCOM | QUALCOMM | $35.30 | 55.85 | 58.22% |
| average | 9.86% | |||
| NDX | Nasdaq 100 | 1,832.04 | 2,478.13 | 35.27% |
As can you can see, the list of top five stocks significantly underperformed the Nasdaq 100 (NDX), mainly due to Apple Inc. (AAPL) having an outsized impact on the index. However, underneath the static 2-year performance data is a story to be told, which is the basis of our New Low investment strategy.
In the chart below, take note of the period around July 2011. At that time, Qualcomm had gains of +60%, Electronic Arts had gains of +55%, Symantec had gains of +42% and Gilead Sciences had gains of +21%. Only Apollo Group had losses to compare against the other stocks.

In the case of Symantec and Electronic Arts, they have come full circle after a 2-year period. This cycle is not unusual for most of the stocks that we track. Even when the stock does not approach the prior low of a watch list, many stocks attain a 52-week low after 2 to 2.5 years (as in the NVDA example above). Be on the lookout for stocks that have similar cycles like EA, SYMC and NVDA since their ability to replicated such moves adds to the prospect that they could pull a repeat performance.
Posted in apol, EA, electronic arts, GILD, gilead sciences, Nasdaq 100 Watch List, NVDA, Nvidia, qcom, Qualcomm, SYMC
Below are the Nasdaq 100 companies that are within 20% of their respective 52-week low. Stocks that appear on our watch lists are not recommendations to buy. Instead, they are the starting point for doing your research and determining the best company to buy. Ideally, a stock that is purchased from this list is done after a considerable decline in the price and considerable due diligence.
| Name | Price | P/E | EPS | Yield | P/B | Pct from Yr Low | |
| Gilead Sciences, Inc. (GILD) | $38.37 | 12.31 | 3.12 | 0.00% | 4.71 | 0.95% | |
| Apollo Group, Inc. (APOL) | $54.41 | 13.61 | 4.00 | 0.00% | 6.23 | 3.07% | |
| QUALCOMM (QCOM) | $36.50 | 19.47 | 1.88 | 2.10% | 2.90 | 3.60% | |
| Ryanair Holdings plc (RYAAY) | $24.60 | 0.00 | 0.00 | 0.00% | 0.00 | 3.89% | |
| Activision (ATVI) | $10.56 | 124.24 | 0.09 | 1.40% | 1.22 | 6.34% | |
| Yahoo! Inc. (YHOO) | $15.29 | 27.40 | 0.56 | 0.00% | 1.81 | 9.45% | |
| Genzyme (GENZ) | $51.77 | 125.66 | 0.41 | 0.00% | 1.84 | 9.94% | |
| Symantec (SYMC) | $15.62 | 40.57 | 0.39 | 0.00% | 3.02 | 11.82% | |
| Electronic Arts (ERTS) | $17.63 | 0.00 | 0.00 | 0.00% | 2.29 | 12.29% | |
| Cephalon, Inc. (CEPH) | $59.38 | 11.84 | 5.01 | 0.00% | 1.90 | 13.00% | |
| Logitech (LOGI) | $14.63 | 40.41 | 0.36 | 0.00% | 2.65 | 14.03% | |
| Staples (SPLS) | $21.66 | 21.17 | 1.02 | 1.60% | 2.35 | 15.71% | |
| Amgen Inc. (AMGN) | $54.46 | 11.56 | 4.71 | 0.00% | 2.37 | 17.22% | |
| RIMM (RIMM) | $64.92 | 0.00 | 0.00 | 0.00% | 0.00 | 19.56% | |
| Cintas (CTAS) | $25.54 | 23.87 | 1.07 | 1.80% | 1.61 | 19.91% |
Watch List Summary
| Company | Change from Last Week |
| Gilead Sciences, Inc. (GILD) | -3.49% |
| Apollo Group, Inc. (APOL) | -5.51% |
| QUALCOMM (QCOM) | -5.97% |
| Ryanair Holdings plc (RYAAY) | -14.47% |
| Activision (ATVI) | -4.92% |
| Yahoo! Inc. (YHOO) | -8.11% |
| Genzyme (GENZ) | -2.80% |
| Symantec (SYMC) | -7.36% |
In all, the Nasdaq 100 Watch List of last week lost -6.58% as compared to the Nasdaq 100 index which lost a total of -7.56%. As with our Dividend Achiever Watch List, the smaller losses and larger gains make the Watch Lists a good place to start investigating your next investment opportunities. Naturally, we expect that all investment decisions should be done with an eye for selectivity and a willingness to harbor a lot of patience.
| Symbol | Name | Price | P/E | EPS | Yield | P/B | % from low |
| GILD | Gilead | 39.71 | 12.74 | 3.12 | 0 | 4.86 | 0.40% |
| APOL | Apollo | 57.41 | 14.36 | 4 | 0 | 6.53 | 8.75% |
| QCOM | QUALCOMM | 38.68 | 20.63 | 1.88 | 2.00% | 3.09 | 9.08% |
| ATVI | Activision | 11.08 | 130.35 | 0.09 | 1.40% | 1.31 | 11.58% |
| GENZ | Genzyme | 53.22 | 129.17 | 0.41 | 0 | 1.91 | 13.02% |
| RYAAY | Ryanair | 28.16 | 0 | 0 | 0 | 0 | 13.46% |
| YHOO | Yahoo! Inc. | 16.53 | 29.62 | 0.56 | 0 | 1.93 | 18.84% |
| SYMC | Symantec | 16.77 | 43.56 | 0.39 | 0 | 3.13 | 20.04% |
Below are the Nasdaq 100 companies that are within 21% of the 52-week low.
| Symbol | Name | Price | P/E | EPS | Yield | P/B | % from Low |
| GILD | Gilead Sciences | 41.67 | 14.77 | 2.82 | 0 | 5.74 | 4.44% |
| QCOM | QUALCOMM | 38.25 | 30.7 | 1.25 | 1.90% | 3.08 | 7.87% |
| GENZ | Genzyme Corporation | 53.93 | 35 | 1.54 | 0 | 1.85 | 14.53% |
| ATVI | Activision Blizzard | 11.6 | 136.47 | 0.09 | 1.30% | 1.35 | 16.82% |
| RYAAY | Ryanair Holdings | 29.19 | N/A | - | 0 | 0 | 17.61% |
| APOL | Apollo Group, Inc. | 63.53 | 15.89 | 4 | 0 | 7.34 | 20.34% |
| Symbol | Name | Price | P/E | EPS | Yield | P/B | % from Low |
| GILD | Gilead | 45.7 | 16.19 | 2.82 | 0 | 6.4 | 10.63% |
| GENZ | Genzyme | 53.64 | 34.81 | 1.54 | 0 | 1.82 | 13.91% |
| RYAAY | Ryanair | 29.23 | 0 | 0 | 0 | 0 | 17.77% |
| ATVI | Activision | 11.79 | 138.71 | 0.09 | 1.30% | 1.36 | 19.33% |
| SYMC | Symantec | 16.68 | 43.32 | 0.39 | 0 | 3.1 | 19.40% |
This list is strictly for the purpose of researching whether or not the companies have viable business models or are about to go out of business. These companies are deemed highly speculative unless otherwise noted.
| Symbol | Name | Trade | P/E | EPS (ttm) | Yield | P/B | % from Low |
| GILD | Gilead | 45.7975 | 16.2 | 2.822 | 0 | 6.48 | 10.86% |
| GENZ | Genzyme | 52.8 | 34.3 | 1.54 | 0 | 1.81 | 12.13% |
| SRCL | Stericycle | 54.58 | 27 | 2.03 | 0 | 5.44 | 18.76% |
| QCOM | QUALCOMM | 42.17 | 33.8 | 1.25 | 1.60% | 3.32 | 18.92% |
| APOL | Apollo Group | 63.14 | 15.8 | 4 | 0 | 7.13 | 19.61% |
| RYAAY | Ryanair | 29.75 | N/A | - | 0 | N/A | 19.86% |
Below are the Nasdaq 100 companies that are within 20% of the 52-week low.
| Symbol | Name | Price | P/E | EPS (ttm) | Yield | P/B | % from Yr Low |
| GILD | Gilead Sciences | 45.34 | 16.1 | 2.82 | 0 | 6.5 | 9.76% |
| GENZ | Genzyme Corp. | 53 | 34.4 | 1.54 | 0 | 1.8 | 12.55% |
| APOL | Apollo Group | 61.28 | 14.7 | 4.16 | 0 | 6.7 | 16.08% |
| QCOM | QUALCOMM | 41.83 | 33.6 | 1.246 | 1.60% | 3.3 | 17.96% |
| FSLR | First Solar, Inc. | 116.5 | 15.5 | 7.53 | 0 | 3.6 | 18.02% |
| SRCL | Stericycle, Inc. | 54.5 | 26.9 | 2.03 | 0 | 5.5 | 18.58% |
Below are the Nasdaq 100 companies that are within 20% of the 52-week low.
| Symbol | Name | Price | P/E | EPS | Yield | P/B | % from Low |
| QCOM | QUALCOMM | 40.05 | 32.14 | 1.25 | 1.70% | 3.17 |
12.94%
|
| FSLR | First Solar, Inc. | 113.3 | 15.05 | 7.53 | N/A | 3.65 |
14.78%
|
| GILD | Gilead Sciences, Inc. | 47.87 | 16.96 | 2.82 | N/A | 6.7 |
15.88%
|
| ERTS | Electronic Arts Inc. | 18.42 | N/A | -2.31 | N/A | 2.33 |
17.32%
|
| ATVI | Activision Blizzard, Inc | 11.82 | 139.06 | 0.09 | 1.30% | 1.39 |
20.00%
|
Nasdaq 100 Watch List Summary
Before pursuing any of these companies, be sure to verify the dividend history as well as the earnings capacity to pay the dividend (more commonly known as payout ratio).
| Symbol | Company | Price | P/E | EPS | Yield | P/B | % from low |
| MCHP | Microchip Technology | 28.25 | 31.6 | 0.89 | 4.80% | 3.53 | 43.69% |
| MXIM | Maxim Integrated Prod. | 19.14 | 71.69 | 0.27 | 4.20% | 2.31 | 48.49% |
| PAYX | Paychex, Inc. | 32.17 | 23.52 | 1.37 | 3.90% | 8.43 | 39.87% |
| LLTC | Linear Technology | 28.36 | 24.22 | 1.17 | 3.20% | N/A | 39.98% |
| ADP | ADP | 44.6 | 16.57 | 2.69 | 3.00% | 3.91 | 34.10% |
| INTC | Intel Corporation | 21.99 | 28.41 | 0.77 | 2.90% | 2.94 | 53.26% |
| PPDI | Pharma Prod. Dev. | 22.71 | 16.94 | 1.34 | 2.60% | 1.98 | 26.38% |
| XLNX | Xilinx, Inc. | 26.6 | 24.43 | 1.09 | 2.40% | 3.68 | 46.48% |
| AMAT | Applied Materials, Inc. | 12.49 | N/A | -0.07 | 2.20% | 2.37 | 23.91% |
| CMCSA | Comcast Corp. | 17.53 | 13.9 | 1.26 | 2.20% | 1.17 | 40.35% |
| KLAC | KLA-Tencor Corp. | 28.79 | N/A | -0.39 | 2.10% | 2.25 | 49.25% |
| Symbol | Name | Trade | P/E | EPS | Yield | P/B | Pct from Yr Low |
| QCOM | QUALCOMM | 38.95 | 31.3 | 1.25 | 1.70% | 3.1 | 9.84% |
| ERTS | Electronic Arts Inc. | 17.77 | N/A | -2.3 | N/A | 2.3 | 13.18% |
| GILD | Gilead Sciences, Inc. | 47.42 | 16.8 | 2.82 | N/A | 6.7 | 14.79% |
| FSLR | First Solar, Inc. | 115.5 | 15.4 | 7.53 | N/A | 3.6 | 17.04% |
| SRCL | Stericycle, Inc. | 54.49 | 26.9 | 2.03 | N/A | 5.5 | 18.56% |
| APOL | Apollo Group, Inc. | 63.02 | 15.2 | 4.16 | N/A | 6.8 | 19.38% |
| GENZ | Genzyme | 56.91 | 36.9 | 1.54 | N/A | 2 | 20.85% |
Watch List Summary