The before and after should make this observation very clear: Continue reading
- Japan
- Market Indicator
- Price Momentum Indicators
- Richard Russell
- Silver
- Speed Resistance Lines
- U.S. Dividend Watch List

The before and after should make this observation very clear: Continue reading
Kellogg (K) stock peaked at $72 in July 2020. Since then, the stock has fallen to $57 (-20%) in 2021. The underperformance put the stock on our radar in January 2021 (yellow arrow). Stock has been trading in range since and appears to be breaking out of that range today. Such action is bullish to a technician or chart readers. Fundamentally, the stock is undervalued based on our 10-year target. The two forces, fundamental & technical, appears to be in alignment with one another. It will be good to revisit Kellogg after 6 months or a year to review how this situation turn out.

ABM Industries is a leading provider of facility services in the United States. They provide janitorial, parking, and engineering services for commercial, industrial, institutional, governmental, and retail client facilities. The company was established in 1909. This mid cap company ($2.0 Billion) first appeared on our watch list back in March this year. The stock was trading at $35 then and lost 12% since.
Posted in ABM, Coppock Curve, investment observation, investment strategy, technical review, Uncategorized
Tagged members
At the time that Carbo Ceramics (CRR) was trading at $82.79, we said the following in our May 28, 2012 article (found here):
“Based on the current dividend for Carbo Ceramics, we have anticipated that the stock price will decline to $62.40 before the next buy indication is triggered.”
Interestingly, Carbo Ceramics fell as low as $62.41 on a closing basis on October 10, 2012. Although this is one penny above the prior $62.40 buy indication, the recent increase of the dividend from $0.24 to $0.27 put the stock well within the buy range, as shown below. Our estimate of $62.40 was based on Edson Gould’s Altimeter which has given reasonable buy and sell recommendations in the past.

As indicated in the chart, there are points where Carbo Ceramics has fallen well below the normal buy range. On two prior occasions, Carbo Ceramics fell as low as the equivalent of today’s $43.74 and $42.12. We are not putting it past this company to accomplish a similar decline this time around. However, this is why we recommend the purchase of this stock in two phases.

When Edson Gould’s Speed Resistance Lines [SRL] are applied to Carbo Ceramics we can see that the stock has taken back a majority of the gains that have accrued from the 2008 low to the most recent peak. The SRL indicates that the extreme downside target of $60.08 is about to be reached shortly. However, there does exist the possibility of going back to point where CRR established its critical support at $26.51.
According to Dow Theory, Carbo Ceramics has the following downside targets:
As indicated in our portfolio (found here), we have already completed the first of the two purchases for CRR and are waiting for either the price to rise to the sell range or decline to the $43.74 level before implementing the next purchase. The sell range currently stands at $96.
Note: This stock is worth considering only with the appropriate amount of due diligence by confirming the fundamental attributes and proper consideration of the downside risk as indicated above.
Below are the Nasdaq 100 companies that are within 10% of their respective 52-week lows. Stocks that appear on our watch lists are not recommendations to buy. Instead, they are the starting point for doing your research and determining the best company to buy. Ideally, a stock that is purchased from this list is done after a considerable decline in the price and rigorous due diligence.
| Symbol | Name | Price | P/E | EPS | Yield | P/B | % from low |
| INTC | Intel Corporation | 22.68 | 9.63 | 2.36 | 4 | 2.31 | 1.84% |
| EXPD | Expeditors International of Washington | 35.55 | 21.16 | 1.68 | 1.6 | 3.65 | 2.07% |
| ATVI | Activision Blizzard | 11.3 | 16.1 | 0.7 | 1.6 | 1.2 | 2.91% |
| DELL | Dell Inc. | 9.66 | 5.75 | 1.68 | 3.4 | 1.68 | 3.32% |
| MRVL | Marvell Technology Group | 9.25 | 11.84 | 0.78 | 2.6 | 1.09 | 3.35% |
| LRCX | Lam Research Corporation | 32.26 | 23.9 | 1.35 | 0 | 1.16 | 3.50% |
| WCRX | Warner Chilcott plc | 13.3 | 11.67 | 1.14 | 0 | 15.18 | 5.35% |
| CHKP | Check Point Software Technologies | 46.72 | 16.86 | 2.77 | 0 | 2.92 | 8.20% |
| BBBY | Bed Bath & Beyond Inc. | 61.6 | 14.31 | 4.3 | 0 | 3.57 | 8.60% |
| TEVA | Teva Pharmaceutical Industries | 40.12 | 11.27 | 3.56 | 2.1 | 1.55 | 8.79% |
| MCHP | Microchip Technology Inc. | 33.25 | 21.47 | 1.55 | 4.2 | 3.18 | 9.99% |
Watch List Summary
As we’ve indicated in our most recent Transaction Alert, we bought Intel (INTC). Below is the Altimeter for Intel since 2006.

According to the Altimeter, Intel at it’s worst, a la the 2009 low, has a downside target of $19.35. It is very important to consider the 2009 low because according to Charles H. Dow:
“…the very foundation of investments in industrials should be knowledge of what these companies earned, say in 1893 to 1896, making, perhaps, reasonable allowances for economies under consolidation [1].”
It is important to note that the period of 1893 to 1896 had declines in the market as much as -40%. What is useful about Dow’s view on earnings is that they should be judged in comparison to the prior bear market lows for the company in question. In the instance of a company that experienced a low in earnings in a bear market or during a recessionary period, essentially Dow is advocating the use of the worst-case scenario.
According to Value Line Investment Survey, 2009 was the most recent low in earnings and reasonably reflects where we should expect the price of Intel to revert to under a worse case scenario. Although Intel fell as low as $12 a share in 2009, provided the company can afford to continue dividend increases, we believe additional purchases should take place at $16.
To reiterate, the fundamental reason for our purchase of Intel are as follows:
Another stock to watch for is Microchip Technology (MCHP). This Altimeter for the stock is below:

In the chart are the upside and downside levels to look out for. As an example, the next upside target is $35.80 while the next downside target is $30.54.
Of particular interest about MCHP is the fact that it appeared on our March 20, 2010 watch list as having the highest yield in the Nasdaq 100 index. That high relative yield translated into a +35% gain one year later for a total return of +39.80%. As a way to manage risk, we may later buy Microchip Technology (MCHP) instead of Intel for our second 15% purchase for our portfolio.
Watch List Performance Review
In our ongoing review of the Nasdaq 100 Watch List, we have taken the top five stocks on our list from our October 7, 2011 list and have checked their performance one year later. The top five companies on that list can be seen in the table below.
| Symbol | Name | 10/7/2011 | 10/5/2012 | % change |
| Illumina, Inc. | 27.18 | 51.79 | 90.54% | |
| QGEN | Qiagen N.V. | 12.65 | 19.2 | 51.78% |
| BMC | BMC Software, Inc. | 36.98 | 43.34 | 17.20% |
| LIFE | Life Technologies Corp. | 36.82 | 50.29 | 36.58% |
| TEVA | Teva Pharmaceutical | 36.75 | 40.12 | 9.17% |
| Average gain: | 41.06% | |||
| NDX | Nasdaq 100 | 2202.76 | 2811.94 | 27.66% |

As reflected in the chart and table above, the top five stocks on our list achieved substantial gains on the average. Only Teva Pharmaceuticals (TEVA) was unable to keep up the pace. Six months after the watch list, all of the stocks were able to achieve our minimum annual gain of +10%.
Citation:
According to Value Line Investment Survey, “Markel Corp. markets and underwrites specialty insurance products and programs to a variety of niche markets.” When reviewing the Value Line tear sheet on Markel, there are a couple of items that make the stock very compelling.
First, Value Line indicates that the company has a fair value of 1.5 times the book value. Using the most conservative full year data from 2011 provided by Value Line, Markel has a fair value of $528.15 which is a 20% premium above the current market price of $439.77. Value Line estimates that by 2017, Markel would have a book value of $447. This implies a fair value of $670.50. Assuming that Markel only achieves half of the projected growth in the book value, the fair value would be at $599. Considering that Markel typically trades above fair value, the prospects are reasonably favorable.
Next, Markel has increased their book value from $49.16 in 1996 to $352.10 in 2011. With Markel having the ability to consistently increase their book value at double digit rates is phenomenal in our view. As an added benefit, Markel has only increased the number of shares outstanding from 5.46 million to 9.62 million in the period from 1996 to 2011. This suggests that the growth of the company has not come at the expense of the shareholders.
We have constructed an Altimeter for Markel (MKL) that is based on a hypothetical dividend assuming an average payout from earnings of 13% and a compounded annual growth rate (CAGR) of the dividend at 9.9%.

Although hypothetical, our assumptions of a dividend policy is the most conservative possible. We believe that, if compelled, Markel could easily maintain such a dividend policy while increasing the book value. Whenever, the Altimeter is above 180, the stock should be sold and whenever it is below 107, MKL should be bought. Below is the performance of the stock price when it falls within the parameters previously noted.
| Date | Price | Altimeter | buy/sell | % change |
| 2/23/1996 | 87 | 106 | buy | 106.61% |
| 6/8/1998 | 179.75 | 182 | sell | -31.99% |
| 3/6/2000 | 122.25 | 103 | buy | 157.67% |
| 10/5/2004 | 315 | 181 | sell | -22.14% |
| 11/20/2008 | 245.25 | 97 | buy | ???????? |
An alternative strategy, for investors with a long-term perspective, could be to accumulate the shares of Markel at or below 107 on the Altimeter (currently $395.90) without consideration of selling. We feel this would be a prudent stance since the declines experienced by the stock at the “sell” indications are not meaningful enough to warrant actually selling the stock by the time the next “buy” indication is given.
Finally, our concern for the worst case scenario is always in the back of our mind. For this reason, we assume that the lows of 2009 will be revisited and ask ourselves are we able to handle such a situation. If based on the Altimeter low of 2009, Markel could decline as low as $281.20. Our hope is that such a low is not visited again. However, with the aid of Dow Theory, we are prepared to accumulate additional shares when, and if, such an opportunity arises.
Posted in Altimeter, Edson Gould, investment observation, Markel, MKL
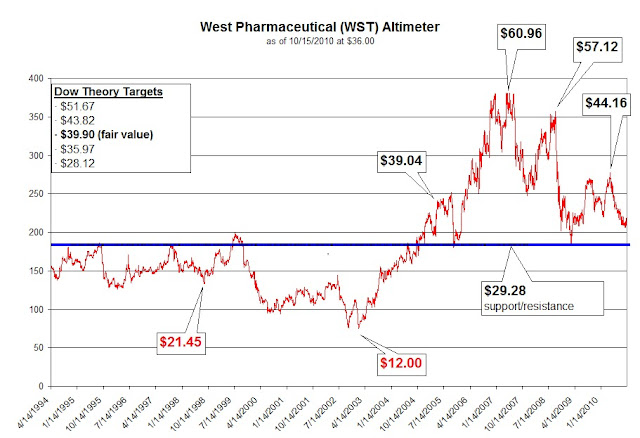
| Upside Targets | Downside Targets | ||||
| $39.04 | $28.96 | ||||
| $44.16 | $21.45 | ||||
| $57.12 | $12.00 | ||||
| $60.96 | |||||
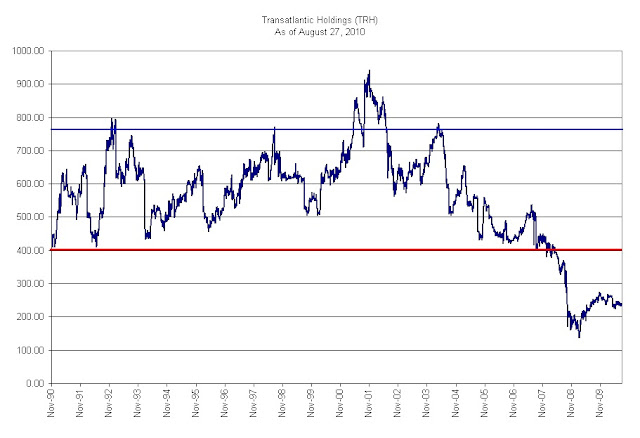
“As a result of its reduced ownership percentage, the AIG Group is no longer considered a related party after March 15, 2010”
Transatlantic Holdings, 10-Q August 6, 2010 (PDF link), page 25, Accessed August 27, 2010.
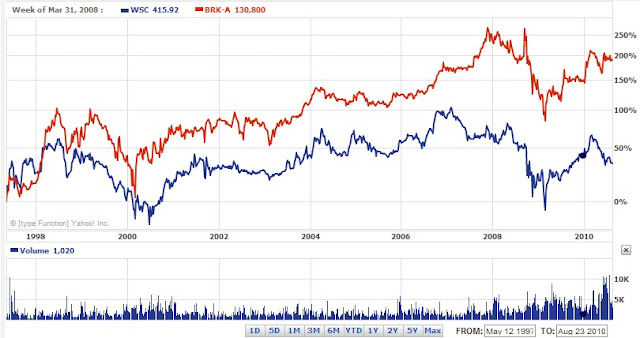
“Business and human quality in place at Wesco continues to be not nearly as good, all factors considered, as that in place at Berkshire Hathaway. Wesco is not an equally-good but smaller version of Berkshire Hathaway, better because its small size makes growth easier. Instead, each dollar of book value at Wesco continues plainly to provide much less intrinsic value than a similar dollar of book value at Berkshire Hathaway. Moreover, the 7 quality disparity in book value’s intrinsic merits has, in recent years, continued to widen in favor of Berkshire Hathaway. All that said, we make no attempt to appraise relative attractiveness for investment of Wesco versus Berkshire Hathaway stock at present stock-market quotations.”Munger, Charles T. Wesco Financial Corporation, Letter to Shareholders. February 25, 2009. Page 7. http://www.wescofinancial.com/cm2008.pdf (PDF). Accessed August 23, 2010.
Posted in BRK-A, investment observation, Wesco Financial, wsc
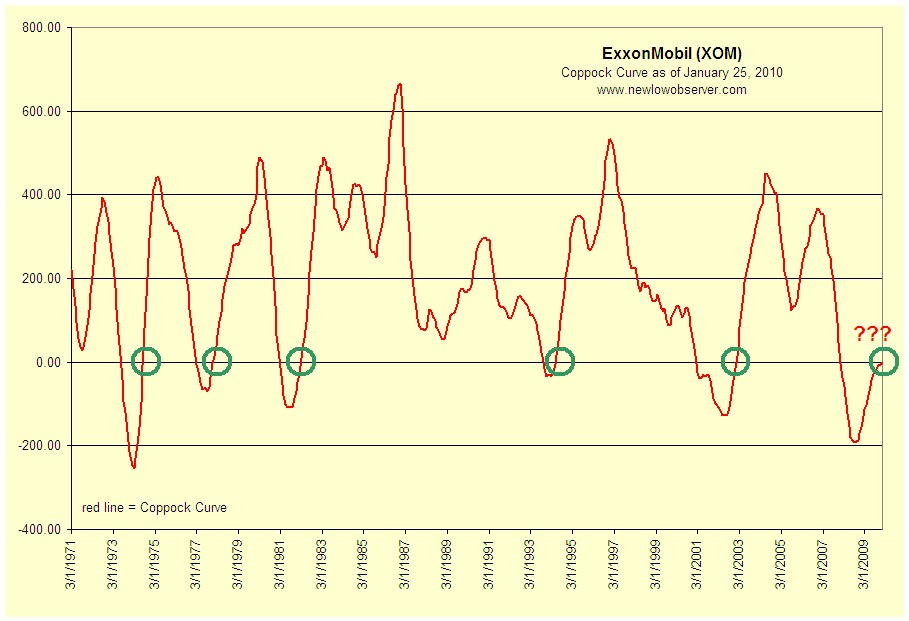
-Touc
Posted in Coppock Curve, investment observation, XOM
As noted in our Dividend Achiever watch list dated January 1st, CWT is within 10% of the 52-week low. CWT has increased its dividend for 41 years in a row. The 10-year compounded growth rate of the dividend is an anemic level of less than 2%. Keep in mind that with a 41 year history of increased dividends, the odds favor the dividend remaining the same or being cut in the near future. A cut in the dividend would initiate the selling of the stock automatically, regardless of other fundamental attributes.
CWT has had a pattern of trading in a range for approximately 6 years at a time before breaking out to a new and higher trading level. The following are the range in years that CWT traded before obtaining a new high:
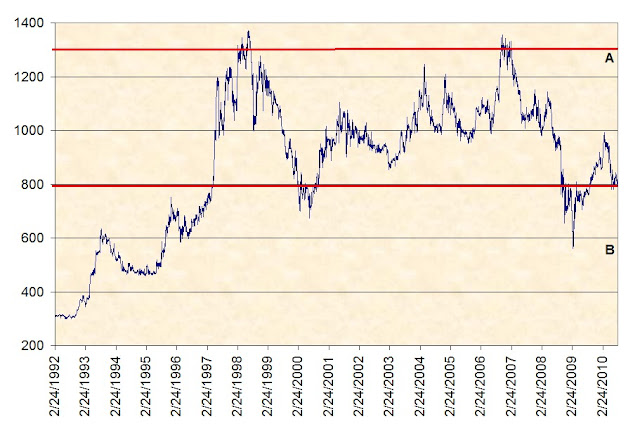
According to Dow Theory, CWT has the following upside and downside targets.
Upside:
Downside:
While we am hopeful of the upside prospects, potential investors need to consider their willingness to hold this stock through the possible downside targets. Personally, we would consider selling the stock if it fell below the $27.40 level. This means that we would be accepting the potential loss of 26% before deciding if we should continue to hold the stock. However, a lot depends on market conditions at the time that CWT falls to the respective downside targets. Our goal is to obtain CWT at a lower price than the current level and sell the stock at or near the $48 level.
To put our investment observation in perspective, IQTrends.com considers CWT undervalued when the stock trades for $16.85. According to Value Line Investment Survey, CWT trades at a mean price of:
Being as conservative as possible, both sources indicate that CWT is overvalued or fairly priced by as much as 54% and as little as 8.71%. In theory, a stock that is "fairly" priced has more of a chance of falling in value rather than increasing in value. Also of concern is the possibility of rising interest rates. It would be challenging to expect that the price of a utility can increase in a potentially rising interest rate environment that we might face in the long term.
As mentioned in our recommendation of AquaAmerica (WTR), although CWT is a water utility and water is critical to life, investors need to understand that companies in this industry aren't a "sure thing." The biggest reason for this is that when, and if, water becomes scarce, government regulators will step in to take over (nationalize) what should otherwise be sold at the most profitable price (thereby curbing wasteful consumption.) There is literally an upside cap on profitability to a company like this due to the critical importance of the resource being sold. Additionally, CWT should be considered a relatively risky stock because of its low daily trading volume. With a 3 month average volume of 100,000 shares, this stock may not be suitable for investors who need ready access to the cash on short notice.
Posted in California Water Service, CWT, Dividend Achievers, investment observation
Tagged members