
- Japan
- Market Indicator
- Price Momentum Indicators
- Richard Russell
- Silver
- Speed Resistance Lines
- U.S. Dividend Watch List
Category Archives: CAG
Review: Conagra Brands
Posted in CAG, dividends, dividends canceled, LYB, PMI, Price Momentum
Tagged members
Conagra Brands Price Momentum
Below is a chart of Conagra Brands Inc. (CAG) from 1982 to 2021, reflecting Price Momentum data.
ConAgra Brands Momentum Review
Below is a chart of ConAgra Brands (CAG) from 1983 to 2021 reflecting Price Momentum data.
ConAgra 10-Year Targets
Below are the valuation targets for ConAgra (CAG) for the next 10 years. Continue reading
Warren Buffett Leverages Up on Inflation Hedge
On February 14, 2013, Berkshire Hathaway and investment firm 3G announced a deal to buy H.J. Heinz (HNZ) for $28 billion, or $72.50 per share. Naturally, Warren Buffett, not being one to get the short end of any stick, is investing only $4.4 billion in Heinz common stock and another $8 billion in preferred shares yielding approximately 9%. The rest of the purchase is being financed through investment group 3G and bank borrowing.
According to the Wall Street Journal, Warren Buffett “…has previously expressed disdain for private-equity buyouts that employed excessive leverage.” However, as the details of the acquisition have unfolded, it becomes apparent that the leveraged nature of the transaction is on par with the deals that Buffett has spoken out against. So what is the motivation of Warren Buffett to engage in such a transaction? In this case, the allure of an inflation hedge that performs much better than gold in high inflation environments and that is proven to succeed after the high inflation period ends.
In the past, we have been outspoken on the matter of investing in food processing companies instead of gold and gold stocks if you want to beat inflation. On December 17, 2008, we pushed the idea that Sysco Corporation (SYY) is an inflation hedge that will beat gold and gold stocks. Our closing remark were, “…if you're of the mind that inflation is coming down the road, with all this liquidity being injected into the economy, then SYY might be a good "long-term" hedge against inflation (found here).”
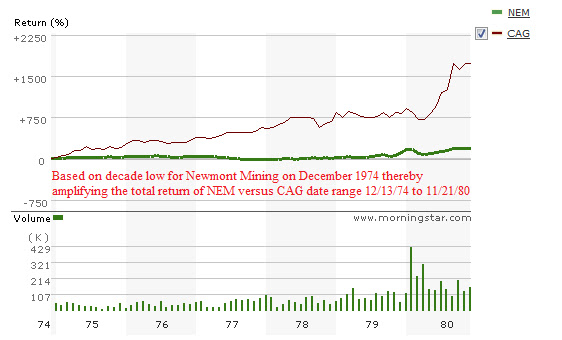
In a December 1, 2010 article we re-iterated that value of inflation protection provided by food processors by comparing ConAgra (CAG), to Newmont Mining (NEM) during the gold bull market from 1974 to 1980. This was a time when ConAgra exceeded Newmont Mining by 10 times. Again, this was within the gold bull market from 1970 to 1980 (found here).
One article published as recently as September 20, 2012 was titled “Gold Stock Investors: To Beat Inflation Look to Food Processors, Producers and Distributors (found here).” In that article, we said, “As an alternative to the ‘mines’ of precious metal stock investing, we’ve recommended investing in food processors, producers and distributors that have a history prudent of dividend increasing policies to take advantage of the expectations of high inflation down the road.”
We cannot emphasis enough the fact that there are vastly superior alternatives to gold and gold stocks if you want to beat inflation. Additionally, investment in companies like Heinz will be richly rewarded even as the period of inflation comes to an end. This will not be the case for gold and gold stocks, as found out by gold permabulls in the period from 1980 to 1999. This explains why Warren Buffett would be involve in the Heinz transaction, it is the appropriate alternative to buying gold or gold stocks if runaway inflation is expected down the road.
Source:
-
Matt Wirz and Ryan Dezember. Berkshire Stomachs Leverage for Heinz Buy. Wall Street Journal. February, 14, 2013. http://blogs.wsj.com/deals/2013/02/14/berkshire-stomachs-leverage-for-heinz-buy.
Gold Stock Investors: To Beat Inflation Look to Food Processors, Producers and Distributors
We’ve long maintained the view that in order for long-term investors to beat inflation, the conventional wisdom of investing in gold and silver stocks is not the most advantageous way to benefit from what almost everyone believes is coming as a consequence of QE4ever. While we favor the physical metals (especially silver) and their paper derivatives like (GLD) and (SLV), we’ve also claimed that a specific strategy is needed in order to get the most mileage out of gold and silver stock investing. However, in order to really beat inflation, forget gold and silver stocks and instead consider companies involved in food processing, producing and distribution industries.
Before we can tackle our food processors, producers and distributors, we need to examine the well documented wealth destruction that has occurred in the gold stock sector in the last year despite the relatively slight decline in the price of gold. Below is a table reflecting the percentage range that many gold and silver stocks have experienced between their one year high and low.
| Symbol | Name | 1-yr % range |
| NG | NovaGold Resources Inc. | -69.33% |
| MUX | McEwen Mining Inc. | -68.23% |
| SSRI | Silver Standard Resources Inc. | -57.35% |
| PAAS | Pan American Silver Corp. | -56.19% |
| KGC | Kinross Gold Corporation | -55.98% |
| BAA | Banro Corporation | -53.55% |
| AUQ | AuRico Gold Inc. | -53.13% |
| AEM | Agnico-Eagle Mines Ltd. | -51.78% |
| HMY | Harmony Gold Mining Co. Ltd. | -44.81% |
| ABX | Barrick Gold Corporation | -41.79% |
| GG | Goldcorp Inc. | -41.74% |
| NEM | Newmont Mining Corp. | -40.69% |
| AU | AngloGold Ashanti Ltd. | -37.81% |
| GFI | Gold Fields Ltd. | -36.32% |
| BVN | Compania de Minas Buenaventura SA | -34.03% |
| SLV | iShares Silver Trust | -30.46% |
| GLD | SPDR Gold Shares | -15.50% |
In all instances, those who had invested in these stocks did not expect that they’d face the prospect of –30% declines in value before they’d realize a gain. In fact, many of these stocks are not at a break-even point if purchased a year ago. Naturally, this should lead inflationistas and gold bugs to feeling a high level of frustration with the belief that gold stocks are a true inflation hedge.
Some perpetual gold bull analysts/marketers argue that gold junior and exploration companies provide better investment opportunities as compared to the many large cap gold stocks like Barrick Gold (ABX), Agnico-Eagle (AEM), and Newmont Mining (NEM). However, the last year has been unforgiving to the larger junior and exploration companies as represented by the Market Vectors Junior Gold Miners (GDXJ) in the chart below:

As early as 2008, in an article titled “Why Gold Will Decline More than the Markets,” we’ve cautioned gold stock investors to be prepared for gold stocks to decline by a greater percentage whenever the general stock market, as represented by the Dow Jones Industrial Average (DIA) or S&P 500 Index (SPY), declines -10% or more.
Within the last year, the closest the Dow Industrials and S&P 500 came to a -10% decline was from April 2nd to June 1st when the indexes fell –8.63% and –9.93%, respectively. Unfortunately, the Philadelphia Gold and Silver Stock Index (XAU) was already in a declining trend after having lost -22.85% from the April 8, 2011 high until April 2, 2012. Despite this fact, the XAU Index managed to lose an additional –20.87% from April 2, 2012 to the May 15, 2012 low.
As an alternative to the “mines” of precious metal stock investing, we’ve recommended investing in food processors, producers and distributors that have a history prudent of dividend increasing policies to take advantage of the expectations of high inflation down the road. Among the many companies that we’re currently following closely in this sector are Hershey (HSY), ConAgra (CAG), and Sysco Foods (SYY).
With all the unexplained pain in the precious metal sector in the last year, companies like ConAgra (CAG), Hershey (HSY) and Sysco Foods (SYY) have continued to increase shareholder value, dividend payments and see steady gains in their stock price. Although the last two years hasn’t been as favorable for Sysco Foods, HSY and CAG have managed to keep pace with the overall market.
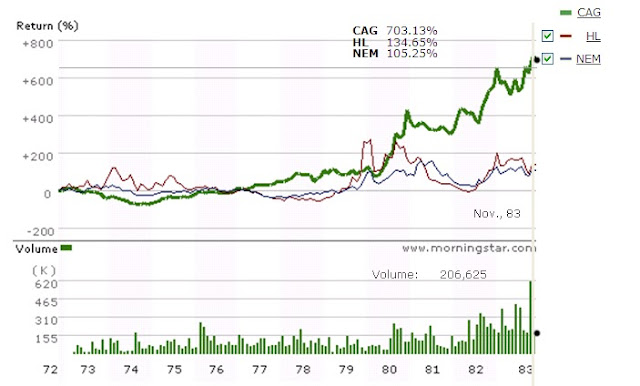
Our belief in the processors, producers and distributors is rooted in the performance of these stocks during the last precious metal bull market from 1970 to 1980 and beyond. In a piece titled “ConAgra: A History of Beating Precious Metals During a Commodity Bull Market,” we compared the performance of ConAgra to Newmont Mining (NEM) and Hecla Mining (HL) at the peak in the market in 1972, before the –42% decline in the Dow Industrials, and the subsequent peak in the commodity bull market in 1980.
What we found was that CAG matched the performance of NEM and HL by the end of the gold bull market in 1980 and went on to out-distance both stocks after the commodity bull market ended, by nearly seven time in 1983. As a follow-up to our initial ConAgra observation in November 21, 2010, we can see the performance of the same three stock in the chart below:

The performance of ConAgra over the last 2 years has been exceptional in comparison to Newmont Mining and Hecla Mining. Today, ConAgra reported that first quarter net doubled and raised their full year expected earnings. CAG’s stock was up +6.20% on the news. The news out of ConAgra suggests that processors, producers and distributors have much to gain from the coming inflation.
Precious metal enthusiasts will likely argue that the less than redeeming attributes of the companies selected (Newmont Mining and Hecla Mining) such as bad management, unprofitable properties, etc. contributed to the poor performance. Another common refrain is, “look how my gold stocks have done in the last 3 or 4 months.” We believe such arguments are the equivalent of whistling past the graveyard.
Consider the following data points, since June 30, 1972 CAG, HL and NEM have generated the following returns, according to Morningstar.com:
-
CAG: +9,021.62%
-
HL: -42.76%
-
NEM: +392.29%
When viewed from the perspective of trying to beat inflation, during the only proven gold bull market in recent history, gold and silver stocks don’t have the durability to truly beat inflation. For those that are ardent long-term value investors, you don’t really need to wade into the dark pools of precious metal stock investing where a mine can flood, a strike will break out, management can be slightly off with their estimates or the cost of production increases causing a stock to collapse in the middle of widely recognized gold bull market. Instead, focus your research and due diligence in the food processors, producers and distributors that are trading near their respective new lows. You will be rewarded far beyond the high inflation period to come.
ConAgra Counterpoint
We love corporate news that is bad. There are few times when anything can be learned through good news, at least not as much as what can be learned with “bad” news.
Recently there was an article titled “Nothing Appetizing About ConAgra” published on Investopedia.com that was unrelenting in the bad news regarding the future prospects of our recent Investment Observation on the same company. So thorough, and yet concise, was the article that we feel it is a must read.
Along with all the negative prospects for ConAgra, there was one morsel of information which happens to confirm our view of what ConAgra might be worth. In the sixth paragraph of the article, it says the following:
“Assuming that private equity buyers could wring some efficiencies and cost savings from this business, a deal worth $28 to $30 could be achievable.”
In our Investment Observation of ConAgra (CAG) dated December 1, 2010, we indicated that using several different approaches, we were able to arrive at a “fair value” of $30. All things cannot go our way with our investment recommendations, so if we were to assume the stock to rise at least to the midpoint between the current price of $22.40 and the expected fair value of $30, then we’d get a gain of 17%. Despite having opposite views on the prospects for the company, there is common ground as to the possible valuation of the company.
We’re reticent to believe that taking the company private, which will then lead to taking the company public at some point down the road, will truly cure what ails ConAgra (CAG). In fact, the history of private equity, from one man's perspective, has been abysmal for companies ensnared in such transactions. The recent book by Josh Kosman titled The Buyout of America details the history of such deals and the subsequent impact on the respective company and their employees.
As we’ve shown in the example of Wilmington Trust (WL), market analyst estimates, including our own, can be usurped by realities beyond our purview. Therefore, despite our take on the prospects for this company, we still recommend “Nothing Appetizing About ConAgra.” It provides the right antidote to our recommendation to consider ConAgra (CAG) as a possible investment candidate.
Investment Observation: ConAgra (CAG) at $21.48
Today’s Investment Observation is on ConAgra (CAG). According to Yahoo!Finance, “ConAgra Foods, Inc. operates as a food company in North America and internationally. It operates in two segments, Consumer Foods and Commercial Foods. The Consumer Foods segment provides branded, private label, and customized food products, which are sold in various retail and foodservice channels. The Commercial Foods segment provides commercially branded foods and ingredients principally to foodservice, food manufacturing, and industrial customers.”
After a cut in 2006, ConAgra (CAG) has had a steady, albeit irregular, increase of the dividend. Prior to 2006, ConAgra had a 28-year history of consecutive dividend increases according to Mergent’s Handbookof Dividend Achievers. As recently as September 21, 2010, ConAgra announced a 15% increase of the dividend from the previous year.
In our analysis of ConAgra (CAG), we’ll first address the technical pattern of Edson Gould’s Altimeter. The altimeter suggests to us that ConAgra is reasonably undervalued in relation to the dividend. The green horizontal line in the chart below is the indicated level where ConAgra would normally be considered undervalued at $21.40 per share. On the opposite end at the overvalued range, ConAgra would trade at approximately $29.72 as indicated by the red horizontal line. The extremes of the under and over valuation are indicated in green and red text, respectively. We adjusted the altimeter to reflect the cut in dividend of 2006. This means that the percentage decrease of the dividend was applied to periods before 2006 to obtain a representative perspective on the altimeter.
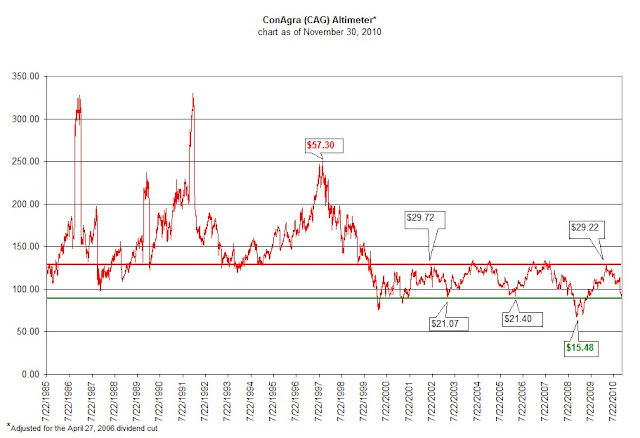
According to Value Line Investment Survey dated October 29, 2010, ConAgra (CAG) is expected be around the $40 range by 2014. We opted to err on the side of caution on this matter and have taken the view that, from the current price of $21.48, we could reasonably expect that ConAgra could rise to $30 or 39.7% over the next 3-4 years. However, our investment strategy requires that if we get a 10% gain in less than a year in a tax-deferred account then we’ll consider the next best investment alternative if we can identify one at that time.
Value Line also indicated that ConAgra is fairly valued at 12 times cash flow. Using the full year cash flow figure for 2010, ConAgra should return to a fair value of $30. Again, this is far above the current price by 39.7% and in perfect alignment with Gould’s Altimeter; which shows that ConAgra’s range established since 1999 is still intact.
Dow Theory ascribes a fair value for ConAgra of $20.04 based on the peak of March 23, 2010 and the trough on December 4, 2008. The Dow Theory downside targets from the current level are:
-
$20.04
-
$17.96
-
$13.80
The downside risk, in our opinion, is 36% below the current price of $21.48. We believe that anyone considering ConAgra should carefully assess their willingness to accept such downside risk.
In a recent posting (link here), we submitted that for the “buy-and-hold” investor, a company like ConAgra would outperform, in the long run, the performance of gold and silver companies like Newmont Mining (NEM) and Coeur D’Alene (CDE); later changed to Hecla Mining (HL) for its continuous price history through the 1970s. We intentionally used the period of the gold and silver bull market to compare ConAgra to the stocks mentioned. We included the silver stocks because we have frequently written that in the past, as is the case presently, silver outperforms gold.
Critics argued that Coeur D’Alene wasn’t exactly the best-run company around. Others said that the timeframe of 1970 to 1983 was biased against precious metal stocks since the peak in gold and silver was in 1980. To answer these critics, we only used Newmont Mining at its lowest price in the period from 1970 to 1980 which occurred on December 13, 1974. We then compared the performance of ConAgra to Newmont until November 21, 1980. The chart below, courtesy of Morningstar.com, is even more astounding than the one initially created. As the chart below demonstrates, instead of outperforming Newmont by 7x, ConAgra beat Newmont by almost 17x.
The last critic standing on our comparison of Newmont Mining, Coeur D’Alene
Watch List Double Take
After highlighting the performance of Sysco (SYY) during the commodity bull market from 1970 to 1983 on our recent NLO Dividend Watch List, we decided to see how another food distributor/producer stacked up against precious metal stocks.
The total return chart of ConAgra (CAG) below (courtesy of Morningstar.com) should be all you need to know about alternative investment opportunities to gold and silver stocks. Like Sysco (SYY), ConAgra (CAG) has had incredible performance against precious metal stocks during a period when there is a lot of hype about the benefits of investing in stocks like Newmont (NEM) and Hecla Mining (HL). If you believe that record high inflation is coming down the road and you're a long-term investor and don't mind a 4.28% dividend yield, research in ConAgra (CAG) just might be for you.
 |
| Source: Morningstar.com, date range: 11/20/1972 to 11/19/1983 |
Below is a chart of CAG compared only to Newmont Mining (NEM) at the very lowest price of NEM on December 13, 1974 to the high of NEM at or near the peak of gold stocks. In this case, NEM has the bold green line while CAG has the thin red line. Note that CAG has a total return almost 17 times that of NEM.
