Category Archives: review

2021 Nasdaq Composite Review

On September 6, 2020 in an article titled “The Nasdaq Will Surprise Everyone”, we said the following:

“When compared to the Dow Jones Industrial Average at the same price levels from 2009 to 2012, the Nasdaq Composite needs to correct but there is more room to run.”

Since that time, the Nasdaq Composite declined -11.80% from the September 2, 2020 high.

So far, the Nasdaq Composite has not exceeded the September 2, 2020 year-over-year runup.  If you thought that the Nasdaq Composite run has been exceptional since the March 23, 2020 low then the chart below should put those thoughts to rest.

image

Bitcoin: December 2018

After twelve months, the extent of the euphoria and devastation has been wrought on the price of Bitcoin.  Out of necessity, it is necessary to review what has happened since our January 17, 2018 posting (when Bitcoin was at $11,141) on the topic as this was the last assessment that was the most accurate, so far.  In that posting, we said the following:

“Anyone willing to participate in Bitcoin should be willing to accept that the price could easily decline –70%, as has been the average of all previous Bitcoin busts (found here).  Anyone who participates in anything other than Bitcoin should expect a minimum –90% to –99% decline if, at the same time, Bitcoin declines –70% or more.

“We see the current decline consistent with all prior crashes in Bitcoin and therefore see no reason to panic if you are out already.  Alternatively, if you are currently in Bitcoins, you should be willing to accept that the price routinely declines to the levels mentioned above.”

Again, this was that last best assessment we had. After this posting, we’ve had others that can be found in our Bitcoin archive which have been mostly accurate and a couple that have been dead wrong.  Below is the update on the topic of Bitcoin. Continue reading

Review: Family Dollar

Today it was announced that Dollar General (DG) is considering a bid for Family Dollar (FDO).  This recent indication only adds to the hype that has suddenly fallen upon FDO.  On March 31, 2014, we wrote a Quick Take on Family Dollar that had the following conclusion:

“Investors interested in FDO could break their investment into at least two purchases, the first being 60% of the intended amount now and the second purchase of 40% at either of the two indicated support levels at $44.95 or $34.83.”

It appears that our indication to consider FDO at the $57.88 range was appropriate as the stock never reverted to any of the suggested downside targets and now trades at $77.47 or +33% higher.  This is the second call in a row that FDO has delivered for us.  FDO appeared on our watch list of February 17, 2013 which prompted our research and subsequent purchase on March 5, 2013. There is significant room for fine tuning which we will eventually examine going forward with these recommendations.

image

Review: Symantec (SYMC)

On February 22, 2014, we posted our Nasdaq 100 Watch List with the following commentary on Symantec (found here):

Symantec (SYMC) tops our watch list again.  SYMC was last recommended back on April 27, 2012.  In our June 10, 2012 posting, we said the following:

“‘In the case of Symantec and Electronic Arts, they have come full circle after a 2-year period. This cycle is not unusual for most of the stocks that we track. Even when the stock does not approach the prior low of a watch list, many stocks attain a 52-week low after 2 to 2.5 years (as in the NVDA example above). Be on the lookout for stocks that have similar cycles like EA, SYMC and NVDA since their ability to replicated such moves adds to the prospect that they could pull a repeat performance.

image

As can be seen in the chart above, the two year cycle that was observed appears to be asserting itself on SYMC.  We don’t see why the stock couldn’t decline a bit further until April or May.  As is usually the case, losses were incurred initially.  Also, our call to sell the principal was early.  However, the +46% gain that was achieved from April 27, 2012 to May 13, 2013 has been secured.”

Continue reading

Review: Bank of Hawaii Meets Upside Target

On January 12, 2009, we made a recommendation of Bank of Hawaii (BOH). In that article (found here), we said the following:

"This would be the ideal buying point, however we must be ready to pull the trigger anywhere between $30.70 and $20.87."

The actual low for the stock was $25.70 on March 9, 2009. While technical analysis was dismissed at the time, there were and currently are some factors that we feel are important to review regarding Bank of Hawaii.

As pointed out in the 2009 article, BOH was a buy when the price declines in the face of above average trading volume (found here).

Currently, BOH has below average trading volume. This does not suggest that the stock cannot increase in value. However, each time volume was exceptionally high (1990, 2000, 2009, 2011), as the stock declined, the valuation figures were in favor of the investor buying BOH.

In addition, our Jan. 2009 article said the following:

“…BOH would trade at $56.84 if it were to revert to the mean based on 2008 earnings of $4.06 (The Bank of Hawaii has estimated fourth quarter 2008 earnings of $0.89).”

After recently closing as high as $56.81 on August 1, 2013 with a possible double top in place, a decline below $54.70 could indicated the trend is down for the intermediate term.  With the upside target having been met, we’d wait to see if a meaningful decline ensue before accumulating additional shares of Bank of Hawaii.

image

2010 Performance Review

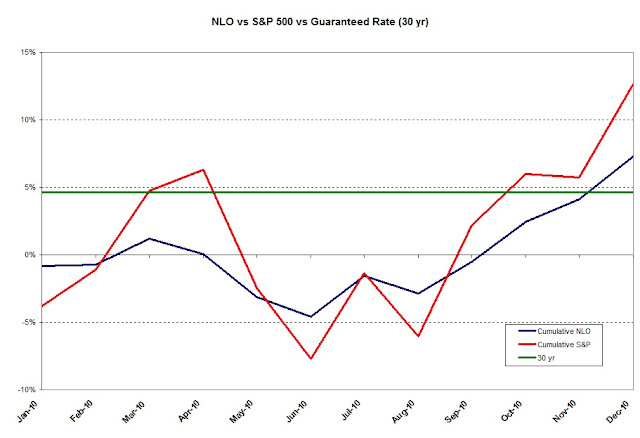
This year was the worst performing year for the New Low Observer in the last five years since our investment approach was codified.  Despite our lackluster performance, you can see that our portfolio incurred less volatility that the S&P 500 index.  We believe this has a lot to do with our philosophy, or the lack thereof, on diversification.  Although our portfolio did not beat any of the major indexes (Dow Industrials, S&P 500, and Nasdaq Composite) we did manage to exceed the return of our primary target, the 30-year U.S. treasury. 
Below is the end of month performance chart of the NLO portfolio and the S&P 500 during 2010.  Throughout the entire year we averaged 50% of the portfolio in stocks and 50% in cash.  The period from January to June reflects partial implementation of our strategy.  The second half of the year, June to December, reflects the full use of our investment strategy.
New Low Observer performance for 2010 (http://www.newlowobserver.com/)
Our new target to beat in the coming year is the 30-year treasury yield as of January 3, 2011 at a rate of 4.39%.  Although this is a modest target, we cannot easily justify the buying and selling of stocks if we cannot exceed the return of a guaranteed rate. 
Below is the performance of our portfolio since the end of 2005:

Dow
S&P
NASDAQ
NLO
2006
16.29%
15.74%
9.52%
18.30%
2007
6.43%
5.46%
9.81%
19.80%
2008
-33.84%
-37.22%
-40.54%
14.35%
2009
18.82%
27.11%
43.89%
36.65%
2010
11.02%
14.32%
16.91%
7.14%