Below are the valuation targets for Bank of Hawaii (BOH) for the next 10 years. Continue reading
- Japan
- Market Indicator
- Price Momentum Indicators
- Richard Russell
- Silver
- Speed Resistance Lines
- U.S. Dividend Watch List

Below are the valuation targets for Bank of Hawaii (BOH) for the next 10 years. Continue reading
On September 28, 2018, we posted 10-Year price targets for Bank of Hawaii (BOH). At the time, we had undervalued and extreme undervalue targets of $64.18 and $44.16, respectively.

Since that time, Bank of Hawaii has had a closing low of $47.37 on March 23, 2020.

see also: All 10-Year Targets
Posted in 10-year Targets, Altimeter, BOH, Target Achieved
Recently we have been adding 10-Year Targets for estimating the future undervalued, overvalued, and fair valued levels of specific stocks.
To help clarify the reasons why we have done this, we are providing an example from a Value Line Investment Survey dated December 4, 1998 to capture data from within the two stock market crashes of 1999 to 2001 (2003) and 2007 to 2009.
The sample stock that we have used is Bank of Hawaii (BOH) which was known as Pacific Century Financial at the time. In the Bank of Hawaii (BOH) example that we have provided from 1998, we have run exactly the same numbers as in the 10-Year Targets for the stock from 2018 to 2029. Continue reading
Posted in 10-year Targets, BOH
In our posting from October 5, 2018, we failed to point out the estimated price that the December 4, 1998 Value Line Investment Survey had for Bank of Hawaii for the period of 2001-2003. This is a metric that all Value Line Investment Survey provides in the upper left-hand corner of their reports. For us, this helps in determining the quality of the estimates that are given by the publication.
At the time, Value Line has an upside target of $40 and a downside target of $30.

Our target price for the same 2001-2003 period was as follows:

As can be seen in the table above, the overvalued high level was $40.64 and the undervalued low level was $23.77. The chart below shows the change in the price of BOH from 1998 to the end of 2003.

As noted in the price chart, BOH achieved a closing price of $42.29, or thereabouts. This is instructive considering that the bear market from early 1999 to mid-2001 was not anticipated at all and resulted in BOH falling slightly more than –50%.
What is our verdict on Value Line Investment Survey estimates for Bank of Hawaii? They did a great job and came in under the actual number of the end of year 2003, in spite of the stock market crash.
Additionally, our estimated range of the stock price was equally as accurate with a more accurate expected low in the price as well as achieving the considerable upside target that followed.
Posted in 10-year Targets, BOH
Recently we have been adding 10-Year Targets for estimating the future undervalued, overvalued, and fair valued levels of specific stocks.
To help clarify the reasons why we have done this, we are providing an example from a Value Line Investment Survey dated December 4, 1998 to capture data from within the two stock market crashes of 1999 to 2001 (03) and 2007 to 2009.
The sample stock that we have used is Bank of Hawaii (BOH) which was known as Pacific Century Financial at the time. In the Bank of Hawaii (BOH) example that we have provided from 1998, we have run exactly the same numbers as in the 10-Year Targets for the stock from 2018 to 2029.
1998 to 2018
For the Bank of Hawaii, based on the December 4, 1998 and priced at $22.00, we have the following targets:
The accompanying stock chart from 1998 to 2018 indicates the estimated valuation levels, and highlights the 2005-2010 & 2018 periods.

Observations
First and foremost, each year has its own valuation level. Second, periods from 1999-2004 and 2011-2017 are excluded for the purpose of focusing on the most relevant periods.
1998-2000
The period from December 1998 to October 2000 saw the Bank of Hawaii decline from $22 to $11.25. The undervalued level was indicated to be $15.81, suggesting that buying BOH at or below that level was ideal.
2000-2007
At the low in 2000, the overvalued price was $31.82, an amount that was nearly double the $15.81 undervalued level of December 1998. As seen in the inset of the chart, by the time 2005 came around, the overvalued level was $47.85. Holding BOH beyond that price was likely to result in subpar returns with the exception of the crash up to $70 in September 2008.
2007-2009
By 2007, it was clear that the housing crisis was going to affect banks. As BOH was already trading close to the overvalued price that was estimated in 1998, there should have been little motivation to buy the stock. Additionally, investors should have been focused on the next time that BOH would approach the undervalued level at $32.95 by 2007. However, by 2009, the undervalued had increased while BOH continued to decline. The question we ask at this point, was BOH a good investment at $32.95 or $38.78?
2018
Again, using the estimated values based on the 1998 Value Line Investment Survey from December 4, 1998, the estimated targets for BOH were:
As of October 5, 2018, BOH sits at $80.12. Because the valuation components have changed since 1998, we cannot say that BOH is currently undervalued. However, the valuation levels that have been updated on our site provide reasonable targets for potential investment consideration.
The growing list of stocks that we have generated for the 10-year targets (2019 to 2029) can be found at the following link. Recommendations are accepted and may be furnished but only as time permits.
Posted in 10-year Targets, BOH
Below are the valuation targets for Bank of Hawaii (BOH) for the next 10 years. Continue reading
On January 12, 2009, we made a recommendation of Bank of Hawaii (BOH). In that article (found here), we said the following:
"This would be the ideal buying point, however we must be ready to pull the trigger anywhere between $30.70 and $20.87."
The actual low for the stock was $25.70 on March 9, 2009. While technical analysis was dismissed at the time, there were and currently are some factors that we feel are important to review regarding Bank of Hawaii.
As pointed out in the 2009 article, BOH was a buy when the price declines in the face of above average trading volume (found here).
Currently, BOH has below average trading volume. This does not suggest that the stock cannot increase in value. However, each time volume was exceptionally high (1990, 2000, 2009, 2011), as the stock declined, the valuation figures were in favor of the investor buying BOH.
In addition, our Jan. 2009 article said the following:
“…BOH would trade at $56.84 if it were to revert to the mean based on 2008 earnings of $4.06 (The Bank of Hawaii has estimated fourth quarter 2008 earnings of $0.89).”
After recently closing as high as $56.81 on August 1, 2013 with a possible double top in place, a decline below $54.70 could indicated the trend is down for the intermediate term. With the upside target having been met, we’d wait to see if a meaningful decline ensue before accumulating additional shares of Bank of Hawaii.

Posted in Bank of Hawaii, BOH, review
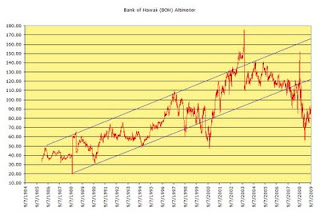 The channel that BOH has managed to fluctuate within suggests that the stock is overvalued at the high end and undervalued at the low end. The period of extreme overvaluation is reflected in 2003 and started to move in a declining trend to undervaluation when BOH increased the dividend from $0.19 to $0.30.
There are two periods of extreme undervaluation in the altimeter. The first level of extreme undervaluation hit bottom in October 2000. The second period was most recently in March of this year. If the stock were to go back to the "historical" low end of the range, BOH would be priced at $54 a share. Although we do not have an extensive history on the periods of extreme undervaluation, it could be inferred that, based on the altimeter, an investment in BOH while not risk free, could be considered low risk.
At least one hitch to my assessment on BOH, in terms of the altimeter, is the fact that the low in March 2009, around the 60 level, could be part of a normal low range that is being established for the stock. If the 60 level is the low end of a new long-term range, my best guess is that the 110 level is the upper end of the range. At the 110 level, BOH stock price would be $49.50.
Only time will tell whether the escalating failure of banks is going to spread even further. However, BOH has managed to fare better than most banks of a similar size. As a further indication of BOH's strength, the dividend increase in November 2008 suggests that management believes the company will survive through the present banking liquidation cycle. Regardless of BOH's strength, I wouldn't be surprised if BOH does not increase the dividend in November. However, if a cut in the dividend takes place then I would be more cautious on the company and the stock. Touc.
related articles:
Please revisit Dividend Inc. for editing and revisions to this post.
Posted in Altimeter, Bank of Hawaii, BOH, Edson Gould