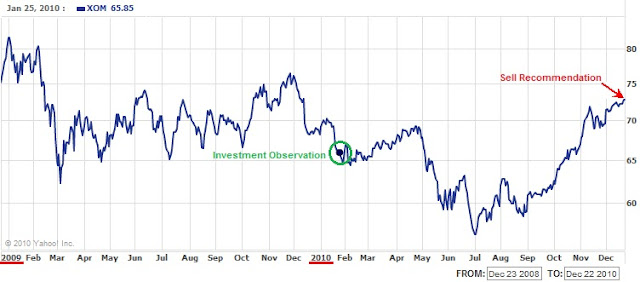
It is now time to recommend that ExxonMobil (XOM) be sold at the market. The stock has performed modestly since the Investment Observation was issued on January 25, 2010. It is highly recommended that anyone who bought the stock based on our insight should re-read the posting. Shortly after our recommendation, XOM fell 15% before heading higher.
In the pursuit of "seeking fair profits" the returns that this stock has provided within the last 333 days say that it is necessary to consider alternative opportunities. The key to investment success and a key principle of economics is to seek the best alternatives.
ExxonMobil (XOM) was recommended when it closed at $65.90 on January 25th. Based on yesterday's closing price of $72.80, XOM has gained 10.47%. If we include reinvested dividends then the gain was 14.84%.
In our observation of the stock on January 25th we were specific in how long the shares might decline and by what percentage we expected the stock to fall further. We said the following:
“…based on the prior Coppock Curve indications, XOM is expected to remain unchanged or fall for another three to six months by about 11% to 18%.”
Five months later, ExxonMobil reached the final bottom on July 2nd at a price of $55.94. As mentioned before, this was a decline of 15% from date of the Investment Observation.
In addition to giving a specific time frame for where the stock would go, we gave a strategy for if you wanted to buy the stock at the January 25th price. The strategy that we outline said the following:
“If we were to invest in stocks the way that Charles H. Dow would then we would buy half of the intended amount now and purchase the second half if the price declines. For example, let's say that you wanted to invest $13,180 in this company. What you would do is buy $6,590 worth of stock now (approximately 100 shares) and hold the stock if the price goes up. If the stock goes down then you would invest the remaining $6,590 at the next level that you felt was ideal. This approach works well regardless of the market that you're in as long as you set aside the amount that you intend to invest before making the first purchase. Also, after making the first investment never invest the second half somewhere else.”
Based on the quality of the observation and a strategy for the investment, readers of this site should have gains that exceed our worst case scenario gain of 14%. The maximum possible gain on this position, including dividends, is 30.42%. We hope that there are those who took advantage of this opportunity.
The annualized return on this position would be close to 14.84% assuming that only purchase was made at the time of the initial Investment Observation. Selling this stock now generates a return of 5.56x greater than the amount of the dividend yield if held for a full year. Additionally, the 14.84% gain exceeds the return on a 30-year treasury purchased on January 25, 2010 by 3.25x.
Those not interested in following through with our sell recommendation can feel comfortable knowing that XOM is a great long-term holding with a 14.84% downside cushion since our investment observation. As the price of XOM rises, it should be noted that the stock faces significant upside resistance at $75, $80 and $95.
As we have indicated in the purposes and function of this site, our goal is to:
-
Maximize the annual yield of each trade.
-
Reduce the time between buying and selling of each stock.
-
Exceed the annual yield of government guaranteed alternatives in each trade.
Investment observations are intended to be a starting point for investigating a quality company at a reasonable price. It is hoped that after doing the background research you can buy the stock at a lower price. Ideally the stock should be held in a tax-deferred account and should not consist of less than 20% of your holdings. Personally, we prefer holding only 2-3 stocks at a time.
For a portfolio of $10,000 with a 20% position that gains 14.84%, the impact on the entire portfolio is a little over 2%. This is contrasted with the same portfolio with a 5% position that gains 14.84%, the impact on the entire portfolio is slightly over half a percent (0.50). By choosing conservative dividend increasing stocks at or near a new low, the odds of success are increased in your favor making the assumed increase in risk worthwhile.
Sell recommendations are intended to deal with the short-term reality of the market. The tracking of the Sell recommendations are the worst case scenario if you happen to have bought a stock at the time the Investment Observation was made (please avoid making this mistake.) We aim for modest but consistent returns, therefore we are happy with 9-12% annual gains.
It is always recommended that when selling a stock, one should not place stop orders, limit orders or orders after hours as detailed in our article "Automatic Orders Don't Provide Protection." This leaves the seller in the position of being vulnerable to the whims of the market makers. Instead, place your sell orders only as a market order during market hours. Some would complain that a market order during market hours might leave some profits on the table. However, we would rather leave some money on the table rather than have it taken away from us by the trades that are placed by institutions and market makers.