-
Topics
Archives
-
-
Recent Posts
-
-
-
-
Category Archives: Dow Jones-UBS
Bloomberg Commodity Index Price Momentum
Below is the Price Momentum Indicator of the Bloomberg Commodity Index.
Bloomberg Commodity Index Review
Below is a review of the Bloomberg Commodity Index.
Posted in BCOM, Bloomberg Commodity Index, Dow Jones-UBS, Edson Gould, Speed Resistance Lines
Tagged members
1993-2022 Bloomberg Commodity Index
Below is a chart of the Bloomberg Commodity Index from 1993-2022, reflecting Price Momentum data.
Commodity Index: Upside Resistance Targets
Below is the Bloomberg Commodity Index (BCOM) from December 2015 to November 2020.

In the work that follows, we provide an updated view on the upside targets for the index. Continue reading
Posted in BCOM, Bloomberg Commodity Index, commodities, Dow Jones-UBS
Tagged members
Commodity Index Review: April 2020
On October 6, 2019, we presented the following on the Bloomberg Commodity Index (BCOM):
“The current level in the index, with the backdrop of the extended trading range from 2015, suggests that it would be very easy to see upside movement to the 141.58 target in a relatively short period of time (3-6 weeks). However, confirmation of the uptrend is needed before action can be taken. The confirmation is a break above the 124.15 target.”
The chart that we posted at the time is below:

Below is our update to the chart above, along with our tentative downside target which, based on precedent, is likely to be the next low for the index. Continue reading
Commodity Index Review: October 2019
Below is a chart of the Bloomberg Commodity Index from 2011 to the present. Since 2011, there has been only one other period that has come close to the current level in the market. Continue reading
Commodity Index Review: November 2018
We’ve been following the Bloomberg Commodity Index (BCOM) since it was known as the Dow-Jones UBS Commodity Index. In that time, We’ve never seen the persistent action that has been on display since May 2016. Continue reading
Commodity Index Review: August 2018
On February 26, 2018, we said the following:
“…BCOM needs to actually break out to the upside in order to indicate the direction going forward. In the chart above, we have indicated with a blue dashed line the 50% Principle for the established trading range to show that the most recent decline from 90.79 and subsequent rebound is a very positive indication. A break above the 90.79 level would be a declarative statement of the uptrend.”
A review of the Bloomberg Commodity Index (BCOM) since February 2018 indicates that our analysis was wrong on the very important point of exceeding the 90.79 level. Below we have plotted the course of BCOM to show what has transpired and what we’re looking for from the index.
Commodity Index Review: April 2018
The market plods along with little in the way of noticeable change from our last posting in February 2018.
Commodity Index Review: February 2018
Below is one of the most important charts of the Bloomberg Commodity Index (BCOM) you’ll ever see. The range of the chart is from late 2015 to the present.

Looking at this chart, can you tell what the overall trend of the index is? Do you suspect what might happen if the index declines below the June 2016, February 2017, or January 2018 levels?
Commodity Index Review: January 2018
In this posting, we’ll provide upside target price and date for the Bloomberg Commodity Index (BCOM).
Commodity Index Review: December 2017
In February 2017, we said the following:
“For now, we have to see if the retest of the 82.10 holds while exceed[ing] the 89.93 bodes well for the commodity sector in general.”
Commodity Index Review: Upside Targets
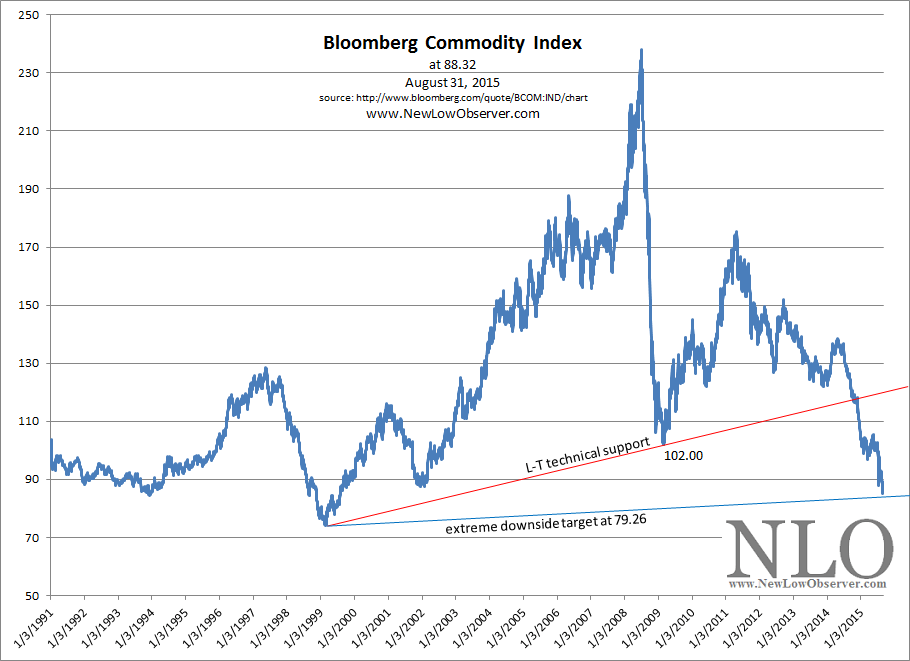
The Bloomberg Commodity Index has finally reached the extreme downside target of 79.26. Initially, we didn’t think that the index would fall to the extreme downside target as indicated in our October 29, 2013 posting. However, after declining below the long-term technical support level, we had to acknowledge what is now obvious.
Commodity Index Review
On October 29, 2013, we did a review of the Dow Jones-UBS Commodity Index (now the Bloomberg Commodity Index [BCOM]) in which we concluded with the following commentary:
“Already we have indicated the extreme downside target for the commodity index at 79.32, based on the work of Edson Gould’s Speed Resistance Lines. However, if we are in a commodity bull market, as we’ve made reference to in our January 1, 2009 article titled (found here), then there is a good chance that a bounce at the long-term technical support line would mark the end of the cyclical bear move in commodities.”
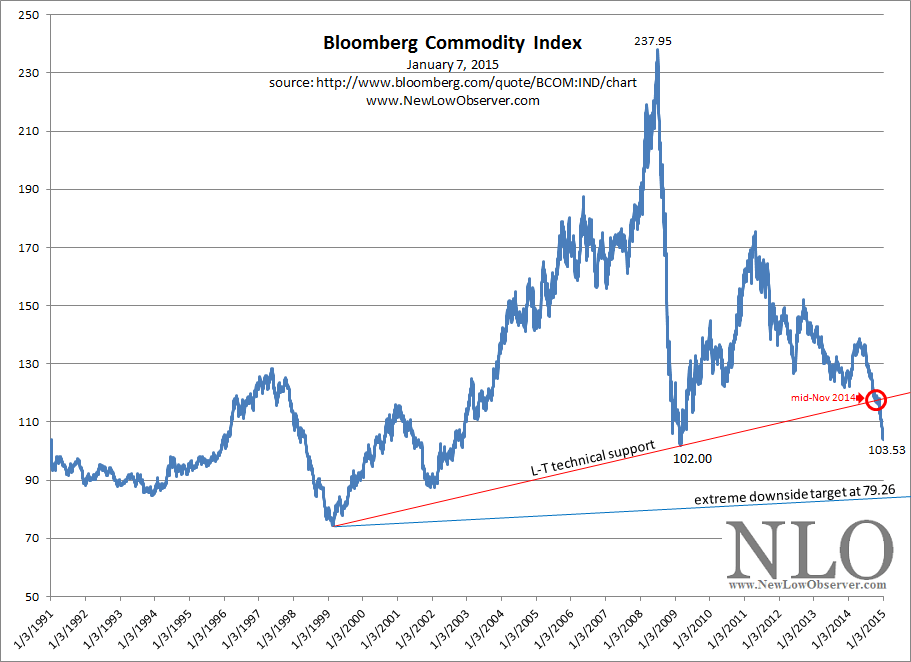
All along it had been our contention that if the commodity index bounced at the long-term technical support line then the declining trend would be over. Unfortunately, that bounce never came to pass. Only on a marginal basis did the price decline stall on or around mid-November 2014.
Since mid-November 2014, the Bloomberg Commodity Index has been in a free fall. All that we can expect now is for the commodity index to decline to the following downside targets at 102, 83 and finally the extreme downside target of 79.26.