
-
Topics
Archives
-
-
Recent Posts
-
-
-
-
Category Archives: BCOM
Bloomberg Commodity Index Price Momentum
Below is the Price Momentum Indicator of the Bloomberg Commodity Index.
Bloomberg Commodity Index Review
Below is a review of the Bloomberg Commodity Index.
Posted in BCOM, Bloomberg Commodity Index, Dow Jones-UBS, Edson Gould, Speed Resistance Lines
Tagged members
iPath Bloomberg Commodity Index Price Momentum $DJP
Below is a chart of the iPath Bloomberg Commodity Index ETN from 2008-2023, reflecting Price Momentum (PMI) data.
Commodity Index: May 2021
Below is our outlook on the Bloomberg Commodity Index. Continue reading
Commodity Index: Upside Resistance Targets
Below is the Bloomberg Commodity Index (BCOM) from December 2015 to November 2020.

In the work that follows, we provide an updated view on the upside targets for the index. Continue reading
Posted in BCOM, Bloomberg Commodity Index, commodities, Dow Jones-UBS
Tagged members
Commodity Index Review: April 2020
On October 6, 2019, we presented the following on the Bloomberg Commodity Index (BCOM):
“The current level in the index, with the backdrop of the extended trading range from 2015, suggests that it would be very easy to see upside movement to the 141.58 target in a relatively short period of time (3-6 weeks). However, confirmation of the uptrend is needed before action can be taken. The confirmation is a break above the 124.15 target.”
The chart that we posted at the time is below:

Below is our update to the chart above, along with our tentative downside target which, based on precedent, is likely to be the next low for the index. Continue reading
Commodity Index Review: October 2019
Below is a chart of the Bloomberg Commodity Index from 2011 to the present. Since 2011, there has been only one other period that has come close to the current level in the market. Continue reading
Commodity Index Review: January 2019
Below we review the Bloomberg Commodity Index (BCOM) and upside resistance targets. Continue reading
Commodity Index Review: August 2018
On February 26, 2018, we said the following:
“…BCOM needs to actually break out to the upside in order to indicate the direction going forward. In the chart above, we have indicated with a blue dashed line the 50% Principle for the established trading range to show that the most recent decline from 90.79 and subsequent rebound is a very positive indication. A break above the 90.79 level would be a declarative statement of the uptrend.”
A review of the Bloomberg Commodity Index (BCOM) since February 2018 indicates that our analysis was wrong on the very important point of exceeding the 90.79 level. Below we have plotted the course of BCOM to show what has transpired and what we’re looking for from the index.
Commodity Index Review: April 2018
The market plods along with little in the way of noticeable change from our last posting in February 2018.
Commodity Index Review: February 2018
Below is one of the most important charts of the Bloomberg Commodity Index (BCOM) you’ll ever see. The range of the chart is from late 2015 to the present.

Looking at this chart, can you tell what the overall trend of the index is? Do you suspect what might happen if the index declines below the June 2016, February 2017, or January 2018 levels?
Commodity Index Review: January 2018
In this posting, we’ll provide upside target price and date for the Bloomberg Commodity Index (BCOM).
Commodity Index Review: December 2017
In February 2017, we said the following:
“For now, we have to see if the retest of the 82.10 holds while exceed[ing] the 89.93 bodes well for the commodity sector in general.”
Commodity Index Review: February 2017
On August 31, 2015, we reviewed the Bloomberg Commodity Index had the following to say:
“While achieving the extreme downside target doesn’t mean that the decline in the index has ended, the majority of the decline from the 2008 peak is behind us.”
“We believe that those interested in the investment opportunities in commodity stocks should review the top tier stocks that have 7% or more individual commodity weighting in the Bloomberg Commodity Index.”
Based on that assessment, the following sectors would have been represented in individual commodity stocks:
-
gold
-
copper
-
corn
-
oil
-
natural gas
What has been the sector ETF performance of the related categories? Below is the respective charts with percentage change:
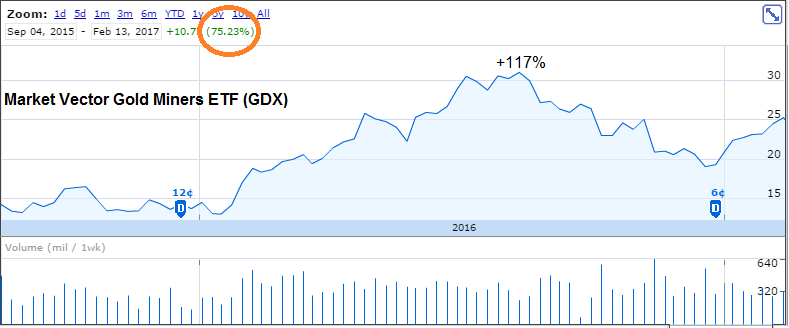
The gold ETF rose as high as +117% and currently sits with gains of +75%. Notice that there was marginal downside action for the sector after September 4, 2015.
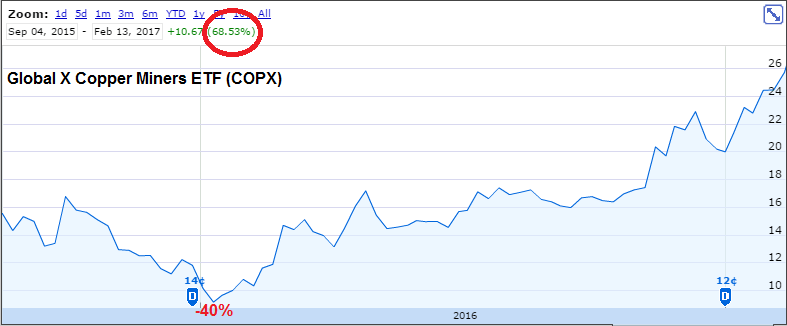
The copper miner ETF did not fair as well immediately after September 2015, falling as much as –40%. However, the recover has been dramatic with the ETF chalking up an “in-line” performance with the gold ETF at +68% gains.
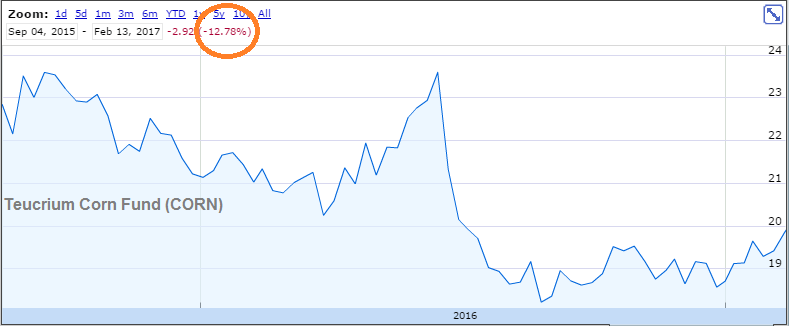
The Teucrium Corn Fund has underperformed with a decline of –12.78% since the late August 2015 call on commodities. This may be the sector to watch as it may be an outperformer in the category, if market conditions continue.
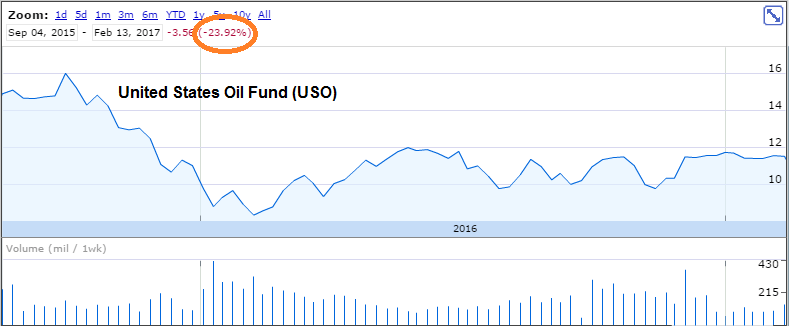
The United States Oil Fund (USO) has suffered in a similar fashion as the corn fund but by a greater magnitude at a decline of –24%.
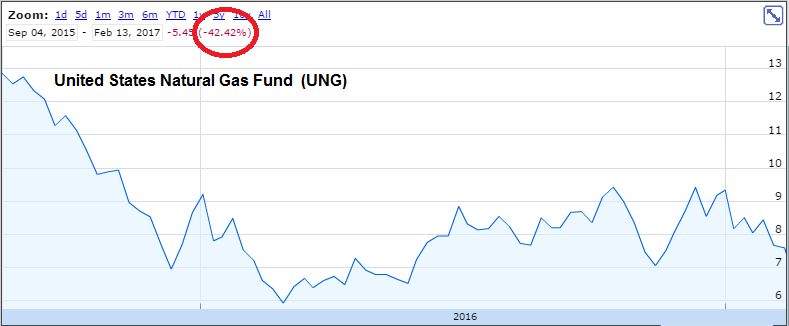
Getting crushed in this category was the United States Natural Gas Fund (UNG) with a decline of –42%.
Unsurprisingly, the individual stocks affected by the representative sectors have had much better performance than the sector ETFs with losses. As an example, our real-time purchases of Flowers Foods (FLO), Raven Industries (RAVN) and Helmerich & Payne (HP) had exceptional gains within the context of a declining sector at +36%, +63% and +74%, respectively. Each of these stocks are heavily impacted by the segments of the above sectors of the Bloomberg Commodity Index. The dichotomy between the commodity and the representative stocks explains why we have a long-held belief that the stocks are better for investors, in the short and long-term, rather than the pure play on the commodity itself.
Below is the updated review of the Bloomberg Commodity Index (BCOM) and our take on what to expect going forward.