Investment Observation: Eli Lilly (LLY) at $35.18

Today's investment Observation is on Eli Lilly and Co. (LLY).  According to Morningstar.com, "Eli Lilly is a pharmaceutical company with a focus on neuroscience, endocrinology, oncology, and cardiovascular therapeutic areas. Lilly's key products include antipsychotic Zyprexa, Cymbalta for depression and fibromyalgia, Gemzar and Alimta for cancer, Evista and Forteo for osteoporosis, Humalog, Humulin, and Byetta for diabetes, and Cialis for erectile dysfunction."

Prior to 2010, Eli Lilly (LLY) had a 41 year history of dividend increases.  The normal dividend increase that takes place in February did not occur this year.  However, the prospect exists that LLY may actually increase the dividend in the 2nd weeks of February of next year.  The fact that there wasn't an increase does not diminish our expectations for LLY.  In fact, keeping the dividend the same or reducing it reflects management's acute awareness to preserve capital for future tough times ahead.  The current annual dividend of $1.96 provides for a substantial dividend yield of 5.60% at the current price.

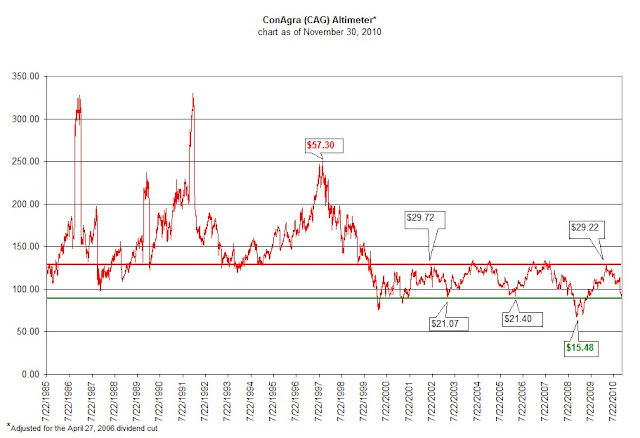
In order to put the current stock price into perspective, we like to see how the dividend payments compare to the stock price on a relative basis.  Below is Edson Gould's Altimeter which reflects the stock price relative to the dividend that has been paid since 1982.

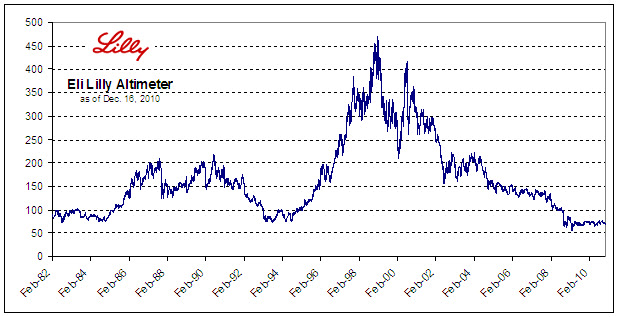
The altimeter at the high points reflects that the stock price is overvalued compared to the dividend payment while the low points reflect the opposite.  At the current level, Eli Lilly (LLY) is at historic low levels in terms of the stock price compared to the actual dividend paid.

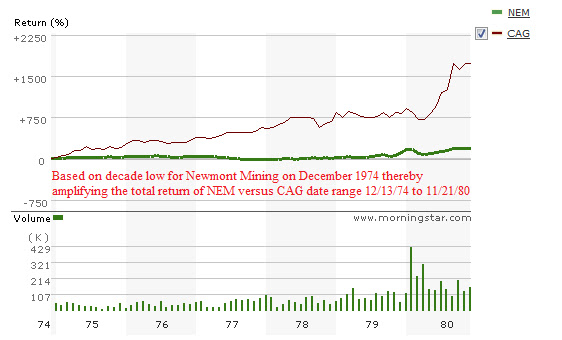
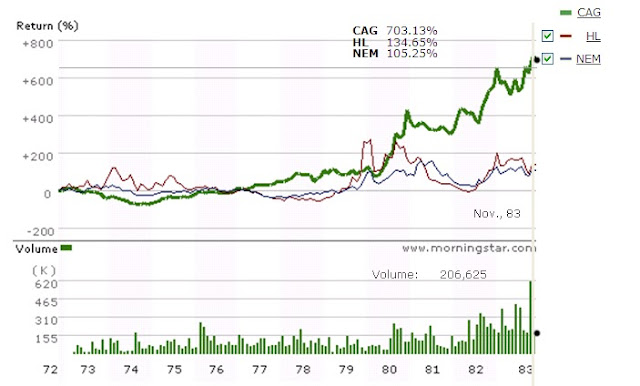
When looking at Eli Lilly's price movement (adjusted for dividends), we intuitively see that there is a pattern that has been repeated and, more recently, overextended.  The chart below shows two different periods (January 4, 1982 to September 6, 1994) and (September 4, 1990 to December 16, 2010).


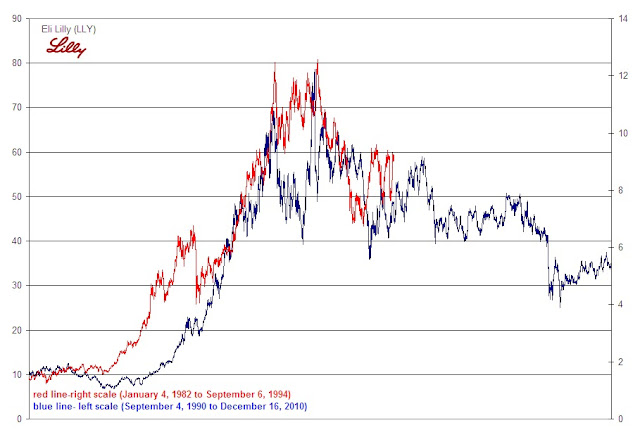
The chart above demonstrates how Eli Lilly (LLY) managed to replicate much of the rise in the respective periods.  Only the decline has been different.  Whereas the decline from January 1992 at $12.52 (adjusted price) ended relatively quickly before going higher, the decline from August 2000 at $78.75 (adjusted price) has managed to get dragged out much longer.  However, regardless of the amount of time that it has taken, both periods have settled at the altimeter levels of undervaluation of between 50 and 100 as was done in the periods of 1984 and 1994 before taking off to the races.

When viewed from the perspective of Value Line Investment Survey's fair value indicator, we arrive at an unbelievable figure of $58.85.  This price is 67% above the current level of $35.18.  Again, we only consider the fair value level as a marker for when long term investors, after having bought at the current price, should sell.  Although we favor the consistency and accuracy of the Value Line fair value estimate, we must defer to the more conservative estimates that we can find.  According to Morningstar.com, Eli Lilly (LLY) has a fair value of $42 while Dow Theory has a fair value of $46.  We'll settle for the Dow Theory figure since it is close to Morningstar's estimate but well below the Value Line estimate.  This leaves us with 30% upside potential for this stock.

We'd like to speak of the return on assets (ROA) and return on equity (ROE) for Eli Lilly (LLY) however they can't be used as a primary motivation for buying this company.  We'll just state that according to MergentOnline, Eli Lilly registered ROA of 15.28% and ROE of 53.25% in 2009.  For the year 2008, ROA and ROE was severely in the negative due, in part, by excessive financial leverage.  2008 and 1997 were the only years that negative ROA and ROE was indicated since 1983. 

In closing, we have saved the most important, and best, part for last.  This is has to do with what the downside risks are for the stock price.  According to Dow Theory, the following are the downside targets:

  • $29.22
  • $20.44
  • $11.66
Anyone considering investing in Eli Lilly (LLY) should be willing to accept the possibility of the stock price falling to any of the indicated level.  If the prospect of falling to $11.66, or 67%, seems far fetched then talk to the share holders who bought for the long term near $100 in 2000.  They are literally sitting on a price decline of 60% (excluding dividends) from the previous purchase. 

Our only other concern with this stock is if it somehow gets "Mercked."  Merck (MRK) was found to have passed off marketing material as clinical studies that indicated that their drug Vioxx was safe at the same time that people were dying from the very same treatment.  We can only hope that such a scenario does not darken the door of Eli Lilly in the coming years. 

Good luck on your follow-up research on Eli Lilly.  We believe the venture will be worth the effort.


Please revisit New Low Observer for edits and revisions to this post. Email us.

Nasdaq 100 Watch List

Below are the top Nasdaq 100 companies that are within 20% of the 52-week low. This list is strictly for the purpose of researching whether or not the companies have viable business models. These companies are deemed highly speculative unless otherwise noted.

Symbol Name Trade P/E EPS Yield P/B % from Low
CSCO Cisco Systems, Inc. $19.70 14.44 1.36 0 2.46 3.68%
ISRG Intuitive Surgical, Inc. $260.07 30.95 8.4 0 5.1 5.70%
AMGN Amgen Inc. $53.89 11.65 4.63 0 2.11 7.22%
DISH DISH Network Corp $18.80 9.24 2.04 0 N/A 8.55%
APOL Apollo Group, Inc. $37.95 10.49 3.62 0 4.02 12.44%
ADBE Adobe Systems Inc $28.71 32.04 0.9 0 2.89 12.81%
TEVA Teva Pharmaceutical $53.80 16.56 3.25 1.40% 2.18 14.49%
CEPH Cephalon, Inc. $63.23 11.82 5.35 0 1.89 14.96%
SHLD Sears Holdings Corp $68.18 40.66 1.68 0 0.9 15.15%
GRMN Garmin Ltd. $30.23 8.26 3.66 4.90% 2.04 15.78%
FLIR FLIR Systems, Inc. $27.97 18.84 1.49 0 3.05 16.54%
GILD Gilead Sciences, Inc. $37.61 11 3.42 0 5.29 18.53%
HSIC Henry Schein, Inc. $59.90 17.35 3.45 0 2.31 19.23%
XRAY DENTSPLY Intl $33.12 17.92 1.85 0.60% 2.58 19.31%
CELG Celgene Corp. $57.46 29.01 1.98 0 5.1 19.66%

Watch List Summary

In the Nasdaq 100 watch list of 17 companies from November 26, 2010 to the closing price of December 10, 2010, the average return from all of the companies listed was +3.21%. This is compared to the NDX (Nasdaq 100 Index) which had a gain of +2.85%.
Apollo Group (APOL) registered the largest gain of +10.13% in defiance of any suggestion by us that it was going to be dropped from the Nasdaq 100.  Apollo Group's ability to stay in the Nasdaq 100 (article link) is in stark contrast to rival for-profit education company Corinthian Colleges (COCO) which was dropped from the S&P MidCap 400 Index down to the S&P SmallCap 600 Index on Thursday December 9, 2010 (article link).  Microsoft (MSFT) and Teva Pharmceutical (TEVA) rounded off the top three performers with 7.77% and 6.81% gains, respectively.
Dish Network (DISH) and Gilead Sciences (GILD) were the only two stocks with declines of less than -1.20% each.

Top Five Performance Review

In our ongoing review of the Nasdaq 100 Watch List, we have taken the top five stocks on our list from the closing price of December 11, 2009 and have checked their performance one year later. The top five companies on that list are provided below with the closing price for December 11, 2009 and December 10, 2010.

Symbol 2009 2010
change
Genzyme Corp. 49.74 69.82
40.37%
Apollo Group 56.58 37.95
-32.93%
Cephalon 58.94 63.23
7.28%
Electronic Arts 16.11 15.82
-1.80%
Gilead Sciences 46.42 37.61
-18.98%
Average
-1.21%
Nasdaq 100 1792.06 2215.34
23.62%

As a group, the top five companies on our Nasdaq 100 list watch list averaged a loss of –1.21% in the last year. This compares with the Nasdaq 100 Index gain of 23.62% in the same one-year time frame. It should be noted that Genzyme (GENZ), Apollo Group (APOL), Cephalon (CEPH), and Electronic Arts (ERTS) gained 10% in the first 41 days of the watch list posting. This equals approximately 80% annualized returns if sold at the 10% mark. As we continually state, if you can beat historical market gains in less than a year then it may be worth seeking out any viable alternatives from the most recent watchlist.

Please revisit New Low Observer for edits and revisions to this post. Email us.

Sell West Pharmaceutical Services (WST) at the Market

It is now time to recommend that West Pharmaceutical Services (WST) be sold at the market. The stock has performed moderately since the Investment Observation was issued on October 17, 2010. It is highly recommended that anyone who bought the stock based on our insight should re-read the posting. For the most part, West Pharmaceutical (WST) retained the recommended market price and moved higher from there.
In the pursuit of "seeking fair profits" the returns that this stock has provided within the last 55 days say that it is necessary to consider alternative opportunities. The key to investment success and a key principle of economics is to seek the best alternatives.
West Pharmaceutical (WST) was recommended when it closed at $35.97 on October 18, 2010. Based on the most recent closing price, WST has gained 10.06% (from the $36 price.)
The annualized return on this position would be close to 60%. Selling this stock now generates a return of 5.29x greater than the amount of the dividend yield if held for a full year. Additionally, the 10.06% gain exceeds the return on a 30-year treasury purchased on October 18, 2010 by 2.56x.
Those not interested in following through with our sell recommendation can feel comfortable knowing that West Pharmaceutical (WST) is a great long-term holding with a 10.06% downside cushion since our investment observation. As the price of WST rises, it should be noted that the stock faces significant upside resistance at $44 and $52. The current strong interest in Beckman Coulter (BEC) (article link) will provide significant support of West Pharmaceutical (WST) for the next couple of weeks.
As we have indicated in the purposes and function of this site, our goal is to:
  • Maximize the annual yield of each trade.
  • Reduce the time between buying and selling of each stock.
  • Exceed the annual yield of government guaranteed alternatives in each trade.
Investment Observations are intended to be a starting point for investigating a quality company at a reasonable price. It is hoped that after doing the background research you can buy the stock at a lower price. Ideally the stock should be held in a tax-deferred account and should not consist of less than 20% of your holdings. Personally, we prefer holding only 2-3 stocks at a time.
For a portfolio of $10,000 with a 20% position that gains 10.06%, the impact on the entire portfolio is 2.01%. This is contrasted with the same portfolio with a 5% position that gains 10.06%, the impact on the entire portfolio is 0.50%. By choosing generally conservative dividend increasing stocks at or near a new low, the odds of success are increased in your favor making the assumed increase in risk worthwhile.
Sell Recommendations are intended to deal with the short-term reality of the market. The tracking of the Sell Recommendations are the worst case scenario if you happen to have bought a stock at the time the Investment Observation was made. We aim for modest returns, therefore we are happy with 9-12% annualized gains.
It is always recommended that when selling a stock, one should not place stop orders, limit orders or orders after hours as detailed in our article "Automatic Orders Don't Provide Protection." This leaves the seller in the position of being vulnerable to the whims of the market makers. Instead, place your sell orders only as a market order during market hours. Some would complain that a market order during market hours might leave some profits on the table. However, we would rather leave some money on the table rather than have it taken away from us by the trades that are placed by institutions and market makers.

Please revisit New Low Observer for edits and revisions to this post. Email us.

We Were Disastrously Wrong about Beckman Coulter (BEC)

On September 12, 2010, commenter Boulay365 asked, “Will BEC stock bounce back to 70 in a few months?” The following day, in an article titled “Beckman Coulter (BEC):Pondering the Imponderable”, we attempted to hazard a guess, based on cycle analysis and Dow Theory, where the stock would be by December 13, 2010. Our analysis was disastrously incorrect as we shall demonstrate.

First, we attempted to rationalize the usefulness of probability in determining the ability of Beckman Coulter (BEC) to rise to $70 level. We used the last period that Beckman Coulter rose from $45 to $70 as a benchmark for what could be expected in the off chance that the stock price could catapult from such a low level in a short period of time. Next, we reasoned that the period in which the stock rose so quickly, March 17, 2009 to September 11, 2009, was in the midst of a bear market rally which tends to be a violent correction of prior declines. We then attempted to quantify the potential for the stock price to rise based on Dow Theory and cyclical patterns that had been exhibited in the past.

Suffice to say, our summary at the end of the article says it all, we said the following:
  • $70 by March 11, 2011 based on previous $45-$70 cycle(rosy scenario)
  • $57 by December 13, 2010 using $45-$70 trajectory (rosy scenario)
  • Price accomplishes $70 by September 13, 2011 (plausible scenario)
  • Price falls further (likely scenario)
We are (apparently) the masters of trying to project the most cautious view possible. Even as new shareholders of the stock, we said that our expectation was for the price of Beckman Coulter (BEC) to fall further from the date of September 13, 2010. In addition, we felt that it was plausible that Beckman Coulter (BEC) could accomplish $70 by September 13, 2011. However, under a rosy scenario, a perspective we routinely attempt to shun, we expected the stock to accomplish $57 by December 13, 2010.

We were catastrophically wrong in our analysis. As recently as December 9, 2010, Beckman Coulter (BEC) closed at $57.09. Had we made it to next Monday, we would have been able to claim that to our surprise the rosy scenario or reaching $57 did play itself out. We were wrong by a country mile on that matter. Today, December 10, 2010, Beckman Coulter (BEC) rose as high as $74 in anticipation of the sale of the company.

At this point, we can only thank Boulay365 for asking the question which we found fascinating to research. There were definite lessons learned in this exercise which we hope to carry forward in future analysis.

Please revisit New Low Observer for edits and revisions to this post. Email us.

Real Estate: The Verdict Is In

On January 6, 2010, we wrote an article titled "Real Estate Bottom is Calling". At that time we indicated that, based on the cycles as presented by Roy Wenzlick along with supporting data from the Federal Reserve Bank of St. Louis, the real estate bottom was in or that it would be registered within 2010.

As we come to the close of 2010, it appears that based on the narrow scope of sources that we’ve selected, the bottom in real estate has come and gone. Below we show a chart of housing starts which appears to have registered a bottom in the month of July 2010.

In the next chart, we have the real estate loans of all commercial banks. This chart also shows that the bottom did occur in the month of April 2010.

Again, the premise of our assertion that real estate would hit bottom is primarily based on the fine research of Roy Wenzlick, author of the Real Estate Analyst. Wenzlick proposed that real estate goes through 18.3 year cycles. Such cycles can be used to estimate the approximate bottoms or tops in the market for relatively accurate timing on when to buy or sell real estate.

Below is a chart that appears to show real estate hitting bottom in 1973. If we were to added 18 years to 1973 then we’d get a bottom in the real estate market in 1991. In fact, 1991 was the last major bottom in real estate. Adding 18 years to 1991 gives us an expected bottom in 2009. As stated in our article of January 6, 2010, we play it safe by including 2008 and 2010 to our expected bottom in the real estate cycle.

saupload_wenzlick

If we add another 18 years to the 2010 bottom that we expect that we’ve passed, we arrive at the year 2028 as the next bottom. This coincides with our inflation cycle peak that is expected from 2028 to 2030 (see right hand column). We arrived at our inflation cycle from the work of Dewey and Dakin’s book Cycles, The Science of Prediction. In their book, written in 1947, Dewey and Dakin proposed that the next peak in wholesale prices would occur in 1979 and the next trough would occur in 2006. The 1979 target was off by one year while the 2006 target is off by 2 or 3 years.

Source: Edward Dewey and Edwin Dakin. Cycles, Science of Prediction. 1947.

Despite the discrepencies in the 2006 estimate for wholesale prices, the stage has been set for some interesting times in the coming years. Based on the indicated sources above, we feel that real estate has a six to nine year stretch of rising prices or "trading" in a range and decreased foreclosures.

Seth Klarman Review: Margin of Safety-Chapter 1

The following is a line for line analysis of chapter one of Seth Klarman's book Margin of Safety. we're providing the concept or idea that we think is being conveyed followed by the quote or concept and page where you can find the citation. Additionally, we follow-up with our thoughts on the concept. We hope to review the complete book one chapter at a time.
According to GuruFocus.com, "Seth Klarman is a value investor and Portfolio Manager of the investment partnership The Baupost Group. Founded in 1983, The Baupost Group now manages $7 billion, and has averaged returns of nearly 20% annually since their inception. Seth Klarman is the author of the book 'Margin of Safety' which sells for over $1000."
Chapter One
  • Know the Difference
    • Knowing the difference between saving & investing and investing & speculating is very important. Also important, the difference between assets and liabilities. p.3.
        • From personal experience there is much confusion about what savings actually is. Money that is consistently put into a bank account and not touched unless there is an emergency is savings. Money that is put into a 401k and invested in a stock mutual fund is not savings. Too often the reflexive remark about contributions to a 401k is that the money is savings for retirement. The only way this is possible is if the money is put into a money market account. Anything else is investing which incurs the attribute of risk of loss.
  • 3 Things Investors want
    • Investors expect 3 things when they invest: free cash flow which is translated into a higher stock price or dividend payouts; higher multiple that others are willing to pay for; narrowing of the gap between share price and business value. p. 4.
        • The latter to of three things that investors should want are solely dependent on the realization of the markets that the company in question is worth either paying more for which in turn narrows the gap between share price and business value. Free cash flow reflected in the form of the dividends does not rely on the hopes and expectation of other investors. Either the dividend is paid or it isn’t.
  • Speculators have Faith
    • Speculators, by contrast, buy and sell securities based on whether they believe those securities will next rise or fall in price. Their judgment regarding future price movements is based, not in fundamentals, but on a prediction of the behavior of others.” p. 4.
        • Strong beliefs are what allow investors and speculators to hope that what they’re doing is right without proper consideration of the risks. This seems to be why many investors would rather rely on “conventional” market wisdom like diversification and holding stocks for the long term. Somehow the faith in a financially stable promise land in some far distant future is more appealing than the evidences of the past and the “here and now.” It goes without saying that financial markets have the tendency to spite long held superstitions bandied about as market truisms.
  • Untested Over an Economic Cycle
    • Although newly issued junk bonds were a 1980s invention and were thus untested over a full economic cycle, they became widely accepted as a financial innovation of great importance…” p.14
        • Anyone investing, or saving for that matter, that isn’t aware of economic cycles is likely to pay for investing instead of get paid by investing. Likewise, for anyone who is actually trying to save, those who understand interest earn it, those who don’t pay it.
  • Yield Pigs
    • Double-digit interest rate on U.S. government securities early in the decade [1980] whetted investors’ appetites for high nominal returns. When interest rates declined to single digits, many investors remained infatuated with the attainment of higher yields and sacrificed credit quality to achieve them either in the bond market or in equities.” P.14
        • This reflects investors fighting the last war rather than the current or future battles. The key to future confrontations lies in an intimate knowledge of the distant past. The key to the current environment is in the ability to avoid the popular strategies that have proven not to work in the recent past.
  • Get to know the difference between yield on capital and return of capital.
    • Yield Pigs are easily confused about return of capital masquerading as yield on capital. Fancy “widow-and-orphan” products or otherwise “safe” investments with high returns are often created with the stated return leaving out the important fact that investors may in fact be receiving their initial investment as part of the “income.” p. 15.
        • The challenge of investing of requires a basic understanding of the difference between getting a return on your capital versus a return of capital. Many investors strive to obtain high yield at the risk of either getting a return of their capital if their lucky or a return that is inferior in the long run simply because exceptionally high yields are guaranteed to last for only so long.
  • Bond yields low? Maybe stocks are too high.
    • When bond yields are low, share prices are likely to be high.” p. 16.
        • This is a matter that constantly lurks in the back of my mind when I hear someone comparing stocks with high dividend yields to government bonds. I worry that there may be something in the stock yield we don’t know about. On the spectrum of risk, we know that the government bond has a greater chance of being repaid whereas the stock’s dividend can be cut at any point.
  • Backward looking investment formulas consistently misguide investors.
    • Other formulas incorporate investment fundamentals such as price-to-earnings (P/E) ratios, price-to-book-value ratios, sales or profit growth rates, dividend yields, and the prevailing level of interest rates. Despite the enormous effort that has been put into devising such formulas, none has been proven to work.” p. 17.
    • Investors would be much better off to redirect the time and effort committed to devising formulas into fundamental analysis of specific investment opportunities.” p. 18.
        • The most blatant deceptions are often the most widely disseminated or misconstrued. Based on Mr. Klarman’s example, it could easily be said that the New Low Observer is among the active participants in such a farce. We don’t argue this point. We readily admit that we don’t know as much as a Buffett, Soros, Lynch or Rosenburg. What we do know is that we attempt to accept our failures and try to learn from them rather than move on to the next investment fad that we have absolutely no clue about.


Please revisit New Low Observer for edits and revisions to this post. Email us.

AquaAmerica Has Prevailed…So Far

On November 29, 2009, in an article titled "What About Utilities?", we submitted our thoughts about the merits of buying the electric utility Consolidated Edison (ED). Our response was that, in terms of a company in the exact same industry group, Southern Company (SO) was probably the best peer to choose from. In addition, we indicated that, although not in the exact same industry group, AquaAmerica, Inc. (WTR) was a far superior alternative to Consolidated Edison (ED).
Below is a chart of the performance of all three stocks from November 30, 2009 to December 3, 2010. It should be noted that the chart only reflects the change in price and not the dividends paid.
As you can see, AquaAmerica, Inc. (WTR) came out on top by generating a return of 32.23% in the last year. Second in the ranking was Southern Company (SO) which returned 18.79%. Finally, Consolidated Edison (ED) returned 14.24%. If viewed strictly on a price appreciation basis, AquaAmerica exceeded the return of Consolidated Edison by more than double.
When analyzed from the more relevant basis of total return (dividend plus price appreciation), the performance was as follows:
  • WTR-36.50%
  • SO-25%
  • ED-20.32%
We invite the curious to re-read the piece we wrote (located here) at the time to gain the “insight” that we were trying to convey. That “insight” is to always seek the best alternative. To the New Low team, the best alternative is the stock nearest the low that has the most viable upside prospects. Those that wish to suggest that “…no long-term holder of stocks would care about the one-year performance of a utility...” are correct. However, what we are trying to demonstrate is the value of assessing the proper time to buy.
Although we outlined our rationale for selecting AquaAmerica over Consolidated Edison, we’re more than willing to submit to the idea that we’re just lucky. As my economics professor used to say, “It is better to be lucky than smart.”

Please revisit New Low Observer for edits and revisions to this post. Email us.

NLO Dividend Watch List

Watch List Summary

This week's list contains 18 companies that are among some of the biggest blue-chip institutions out there. Topping this list again is the giant food supplier, ConAgra (CAG). The New Low team has issued an Investment Observation on ConAgra that is worth reading.

December 3, 2010 Watch List

Symbol Name Price % Yr Low P/E EPS (ttm) Dividend Yield Payout Ratio
CAG ConAgra Foods, Inc. 22.08 5.04% 14.06 1.57 0.92 4.17% 59%
TFX Teleflex Inc. 50.53 5.45% 12.48 4.05 1.36 2.69% 34%
CLX Clorox Co. 62.49 5.99% 13.41 4.66 2.20 3.52% 47%
ABT Abbott Laboratories 47.37 6.23% 15.63 3.03 1.76 3.72% 58%
KMB Kimberly-Clark Corp. 62.01 6.45% 14.03 4.42 2.64 4.26% 60%
CL Colgate-Palmolive Co. 77.95 6.61% 18.21 4.28 2.12 2.72% 50%
LLY Eli Lilly & Co. 34.14 6.62% 7.83 4.36 1.96 5.74% 45%
GBCI Glacier BanCorp., Inc.  13.60 7.26% 21.59 0.63 0.52 3.82% 83%
UVV Universal Corp. 38.13 7.83% 7.49 5.09 1.92 5.04% 38%
BOH Bank of Hawaii Corp. 44.98 8.13% 11.84 3.80 1.80 4.00% 47%
SYY Sysco Corp. 29.30 8.60% 15.10 1.94 1.04 3.55% 54%
VLY Valley National BanCorp.  13.39 9.16% 17.62 0.76 0.72 5.38% 95%
WFSL Washington Federal, Inc.  15.26 9.23% 14.53 1.05 0.20 1.31% 19%
JNJ Johnson & Johnson   62.56 10.02% 12.85 4.87 2.16 3.45% 44%
WABC Westamerica BanCorp.  53.74 10.35% 16.85 3.19 1.44 2.68% 45%
OMI Owens & Minor, Inc. 28.18 10.42% 14.68 1.92 0.71 2.52% 37%
CWT California Water 37.39 10.59% 19.78 1.89 1.19 3.18% 63%
PEP PepsiCo Inc. 65.17 10.93% 16.42 3.97 1.92 2.95% 48%
18 Companies


Top Five Performance Review

In our ongoing review of the NLO Dividend Watch List, we have taken the top five stocks on our list from December 4, 2009 and have check their performance one year later. The top five companies on that list can be seen in the table below.

Name Symbol 2009 Price 2010 Price % change
Aqua America WTR 16.81 21.58 28.38%
WGL Holdings, Inc. WGL 31.86 35.98 12.93%
UGI Corp. UGI 23.59 31.98 35.57%
Northern Trust Corp. NTRS 48.69 52.82 8.48%
California Water CWT 37.67 37.39 -0.74%


Average 16.92%


Dow Jones Industrial DJI 10,388.90 11,382.09 9.56%
S&P 500 SPX 1,105.98 1,224.71 10.74%

Once again, our top five have beaten both the Dow Jones Industrial Average and the S&P 500.  Of particular interest to us is the performance of Northern Trust (NTRS).  If after a year of holding stock, the shares of NTRS have risen 8.5%.  In our recent investment observation (Sept 1, 2010) and sell recommendation (Dec 3, 2010) of Northern Trust, we managed a gain of 10.9% in a much shorter time frame.

As mentioned with every sell recommendation, our goal is to maximize the annual yield of each trade so if we can obtain a 10% gain in less than a year (the approximate historical annual market return) then we are satisfied. Those who wish to hold for the "long-term" may also benefit from our method of buying quality dividend paying stocks near a new low, Aqua America (WTR), WGL Holding (WGL), and UGI (UGI) are perfect examples.

  • See the 36% 1-year performance of our utility recommendation here.

Disclaimer 

On our current list, we excluded companies that have no earnings. Stocks that appear on our watch lists are not recommendations to buy. Instead, they are the starting point for doing your research and determining the best company to buy. Ideally, a stock that is purchased from this list is done after a considerable decline in the price and extensive due diligence. We suggest that readers use the March 2009 low (or the companies' most distressed level in the last 2 years) as the downside projection for investing. Our view is to embrace the worse case scenario prior to investing. A minimum of 50% decline or the November 2008 to March 2009 low, whichever is lower, would fit that description. It is important to place these companies on your own watch list so that when the opportunity arises, you can purchase them with a greater margin of safety. It is our expectation that, at the most, only 1/3 of the companies that are part of our list will outperform the market over a one-year period.

Please revisit New Low Observer for edits and revisions to this post. Email us.

Sell Northern Trust (NTRS) at the Market

It is now time to recommend that Northern Trust (NTRS) be sold at the market. The stock has performed moderately since the Investment Observation was issued on September 1, 2010. It is highly recommended that anyone who bought the stock based on our insight should re-read the posting. For the most part, Northern Trust retained the recommended market price and moved higher from there.
In the pursuit of "seeking fair profits" the returns that this stock has provided within the last 94 days say that it is necessary to consider alternative opportunities. The key to investment success and a key principle of economics is to seek the best alternatives.
Northern Trust (NTRS) was recommended when it closed at $47.26 on September 1st. Based on this morning’s price of $52.18, NTRS has gained 10.96% (including reinvested dividends.) By catching the stock eight days before the ex-dividend date, we were able to boost the total return from 10.41% to 10.96% a difference of 5.28%.
The annualized return on this position would be close to 43%. Selling this stock now generates a return of 4.62x greater than the amount of the dividend yield if held for a full year. Additionally, the 10.96% gain exceeds the return on a 30-year treasury purchased on September 1, 2010 by 3x.
Those not interested in following through with our sell recommendation can feel comfortable knowing that Northern Trust is a great long-term holding with a 10.96% downside cushion since our investment observation. As the price of NTRS rises, it should be noted that the stock faces significant upside resistance at $56 and $59.
As we have indicated in the purposes and function of this site, our goal is to:
  • Maximize the annual yield of each trade.
  • Reduce the time between buying and selling of each stock.
  • Exceed the annual yield of government guaranteed alternatives in each trade.
Investment observations are intended to be a starting point for investigating a quality company at a reasonable price. It is hoped that after doing the background research you can buy the stock at a lower price. Ideally the stock should be held in a tax-deferred account and should not consist of less than 20% of your holdings. Personally, we prefer holding only 2-3 stocks at a time.
For a portfolio of $10,000 with a 20% position that gains 10.96%, the impact on the entire portfolio is 2.19%. This is contrasted with the same portfolio with a 5% position that gains 10.96%, the impact on the entire portfolio is 0.548%. By choosing generally conservative dividend increasing stocks at or near a new low, the odds of success are increased in your favor making the assumed increase in risk worthwhile.
Sell recommendations are intended to deal with the short-term reality of the market. The tracking of the Sell recommendations are the worst case scenario if you happen to have bought a stock at the time the Investment Observation was made (please avoid making this mistake.) We aim for modest returns, therefore we are happy with 9-12% annualized gains.
It is always recommended that when selling a stock, one should not place stop orders, limit orders or orders after hours as detailed in our article "Automatic Orders Don't Provide Protection." This leaves the seller in the position of being vulnerable to the whims of the market makers. Instead, place your sell orders only as a market order during market hours. Some would complain that a market order during market hours might leave some profits on the table. However, we would rather leave some money on the table rather than have it taken away from us by the trades that are placed by institutions and market makers.
Please revisit New Low Observer for edits and revisions to this post. Email us.

Investment Observation: ConAgra (CAG) at $21.48

Today’s Investment Observation is on ConAgra (CAG). According to Yahoo!Finance, “ConAgra Foods, Inc. operates as a food company in North America and internationally. It operates in two segments, Consumer Foods and Commercial Foods. The Consumer Foods segment provides branded, private label, and customized food products, which are sold in various retail and foodservice channels. The Commercial Foods segment provides commercially branded foods and ingredients principally to foodservice, food manufacturing, and industrial customers.”

After a cut in 2006, ConAgra (CAG) has had a steady, albeit irregular, increase of the dividend. Prior to 2006, ConAgra had a 28-year history of consecutive dividend increases according to Mergent’s Handbookof Dividend Achievers. As recently as September 21, 2010, ConAgra announced a 15% increase of the dividend from the previous year.

In our analysis of ConAgra (CAG), we’ll first address the technical pattern of Edson Gould’s Altimeter. The altimeter suggests to us that ConAgra is reasonably undervalued in relation to the dividend. The green horizontal line in the chart below is the indicated level where ConAgra would normally be considered undervalued at $21.40 per share. On the opposite end at the overvalued range, ConAgra would trade at approximately $29.72 as indicated by the red horizontal line. The extremes of the under and over valuation are indicated in green and red text, respectively. We adjusted the altimeter to reflect the cut in dividend of 2006. This means that the percentage decrease of the dividend was applied to periods before 2006 to obtain a representative perspective on the altimeter.
According to Value Line Investment Survey dated October 29, 2010, ConAgra (CAG) is expected be around the $40 range by 2014. We opted to err on the side of caution on this matter and have taken the view that, from the current price of $21.48, we could reasonably expect that ConAgra could rise to $30 or 39.7% over the next 3-4 years. However, our investment strategy requires that if we get a 10% gain in less than a year in a tax-deferred account then we’ll consider the next best investment alternative if we can identify one at that time.

Value Line also indicated that ConAgra is fairly valued at 12 times cash flow. Using the full year cash flow figure for 2010, ConAgra should return to a fair value of $30. Again, this is far above the current price by 39.7% and in perfect alignment with Gould’s Altimeter; which shows that ConAgra’s range established since 1999 is still intact.

Dow Theory ascribes a fair value for ConAgra of $20.04 based on the peak of March 23, 2010 and the trough on December 4, 2008. The Dow Theory downside targets from the current level are:
  • $20.04
  • $17.96
  • $13.80
The downside risk, in our opinion, is 36% below the current price of $21.48. We believe that anyone considering ConAgra should carefully assess their willingness to accept such downside risk.

In a recent posting (link here), we submitted that for the “buy-and-hold” investor, a company like ConAgra would outperform, in the long run, the performance of gold and silver companies like Newmont Mining (NEM) and Coeur D’Alene (CDE); later changed to Hecla Mining (HL) for its continuous price history through the 1970s. We intentionally used the period of the gold and silver bull market to compare ConAgra to the stocks mentioned. We included the silver stocks because we have frequently written that in the past, as is the case presently, silver outperforms gold.

Critics argued that Coeur D’Alene wasn’t exactly the best-run company around. Others said that the timeframe of 1970 to 1983 was biased against precious metal stocks since the peak in gold and silver was in 1980. To answer these critics, we only used Newmont Mining at its lowest price in the period from 1970 to 1980 which occurred on December 13, 1974. We then compared the performance of ConAgra to Newmont until November 21, 1980. The chart below, courtesy of Morningstar.com, is even more astounding than the one initially created. As the chart below demonstrates, instead of outperforming Newmont by 7x, ConAgra beat Newmont by almost 17x.
The last critic standing on our comparison of Newmont Mining, Coeur D’Alene, and ConAgra said that comparing companies from 1970 to 1983 has no relevance to the current environment.  We’re hoping that such a perspective is correct and guessing that any critic making such a remark believes that inflation and interest rates will not be heading higher anytime soon.
 
Please revisit New Low Observer for edits and revisions to this post. Email us.

December 2010 Ex-Dividend Dates

Below are the approximate ex-dividend dates for the month of December for companies that appear on our Dividend Achiever, Nasdaq 100, Dow Jones Transportation Index and International Dividend Achiever Watch Lists. All companies are ranked by ex-dividend dates.
Companies that show up on our Watch Lists could be considered the equivalent of the bargain bin of high quality blue chip stocks. Because these companies have increased their dividends every year for at least 10 years in a row or are part of the Nasdaq 100 and within 20% of their respective 52-week low, you know that you’re not overpaying for a company that has demonstrated profitability and the ability to rebound from challenging times.
Symbol Name Price EPS Div/Shr Yield Pct from Yr Low Ex-Div
CHFC Chemical Financial Corp $20.93 0.71 0.8 3.80% 11.39% 12/01/10
IMO Imperial Oil Limited $36.03 2.23 0.43 1.20% 2.42% 12/01/10
PEP Pepsico, Inc. $63.92 3.97 1.92 3.00% 8.80% 12/01/10
ANAT American National Insurance $79.71 5.37 3.08 3.90% 7.51% 12/01/10
CBSH Commerce Bancshares, Inc. $37.48 2.5 0.94 2.50% 6.78% 12/06/10
CHL China Mobile Limited $49.69 4.34 1.64 3.30% 11.89% 12/06/10
FNF Fidelity National Financial $13.63 1.34 0.72 5.30% 8.17% 12/07/10
UMBF UMB Financial Corp $37.44 2.37 0.78 2.10% 17.85% 12/08/10
NTRS Northern Trust Corp $50.20 2.92 1.12 2.20% 10.81% 12/08/10
WMT Wal-Mart Stores, Inc. $53.67 4.03 1.21 2.30% 12.35% 12/08/10
KMB Kimberly-Clark Corp $61.53 4.42 2.64 4.30% 5.63% 12/08/10
VFC V.F. Corp $83.00 5.27 2.52 3.00% 19.87% 12/08/10
BDX Becton, Dickinson and Co $77.12 5.49 1.64 2.10% 16.02% 12/08/10
STFC State Auto Financial Corp $15.83 0.03 0.6 3.70% 18.13% 12/09/10
SYBT S.Y. Bancorp, Inc. $23.69 1.44 0.72 3.00% 19.65% 12/09/10
IRET Investors Real Estate Trust $8.94 0.02 0.69 7.60% 12.17% 12/12/10
SFNC Simmons First National Corp $28.75 1.63 0.76 2.60% 18.90% 12/12/10
SUBK Suffolk Bancorp $25.78 1.68 0.88 3.40% 10.22% 12/12/10
BXS BancorpSouth, Inc. $12.86 0.06 0.88 6.90% 4.81% 12/13/10
VLY Valley National Bancorp $12.71 0.76 0.72 5.60% 3.61% 12/13/10
PPDI Pharmaceutical Product Dev. $24.92 0.8 0.6 2.40% 19.46% 12/13/10
LEG Leggett & Platt $20.55 1.17 1.08 5.30% 14.87% 12/13/10
UHT Universal Health Realty Income $35.05 1.38 2.42 6.80% 18.73% 12/13/10
HI Hillenbrand Inc $19.50 1.54 0.75 3.90% 9.55% 12/13/10
OMI Owens & Minor, Inc. $28.42 1.92 0.71 2.40% 11.36% 12/13/10
MRK Merck & Company $34.69 2.59 1.52 4.40% 13.00% 12/13/10
FFIN First Financial Bankshares, Inc $48.79 2.72 1.36 2.80% 12.03% 12/13/10
RNR RenaissanceRe Holdings $60.48 13.42 1 1.60% 19.86% 12/13/10
TSS Total System Services $15.14 1.05 0.28 1.80% 12.90% 12/14/10
MCY Mercury General Corp $43.20 3.83 2.4 5.50% 19.17% 12/14/10
RLI RLI Corporation $58.14 5.52 1.16 2.00% 17.86% 12/14/10
GE General Electric $15.97 0.92 0.48 3.00% 16.15% 12/15/10
FRS Frisch's Restaurants $21.70 1.89 0.6 2.70% 19.96% 12/15/10
ECL Ecolab Inc. $48.56 2.16 0.62 1.30% 19.43% 12/16/10
CINF Cincinnati Financial Corp. $29.77 3.04 1.6 5.30% 18.56% 12/20/10
SRE Sempra Energy $49.62 2.99 1.56 3.10% 13.00% 12/26/10
OFC Corporate Office Properties $33.91 0.33 1.65 4.80% 3.75% 12/27/10
NUE Nucor Corp. $37.39 0.64 1.44 3.80% 4.70% 12/27/10
USB U.S. Bancorp $24.00 1.54 0.2 0.80% 17.42% 12/27/10
XRAY DENTSPLY International Inc. $30.73 1.85 0.2 0.60% 10.70% 12/27/10
WPC W.P. Carey & Co. $29.50 1.95 2.03 6.90% 19.48% 12/27/10
SYK Stryker Corp $50.19 3.22 0.6 1.20% 17.43% 12/27/10
IBKC IBERIABANK Corp. $50.83 5.99 1.36 2.70% 5.22% 12/27/10
CWCO Consolidated Water Co. Ltd. $8.91 0.3 0.3 3.30% 10.00% 12/28/10
LRY Liberty Property Trust $31.67 0.4 1.9 6.00% 16.52% 12/28/10
HCC HCC Insurance Holdings, Inc. Co $28.31 2.89 0.58 2.10% 18.70% 12/28/10
FULT Fulton Financial Corp. $8.76 0.54 0.12 1.40% 7.75% 12/29/10
TR Tootsie Roll Industries $26.87 0.92 0.32 1.20% 15.82% 12/29/10
BANF BancFirst Corp. $40.11 2.69 1 2.50% 15.03% 12/29/10
CAH Cardinal Health $35.52 2.71 0.78 2.20% 19.64% 12/29/10
ITW Illinois Tool Works $47.40 3.25 1.36 2.90% 17.53% 12/29/10
If you happen to be researching these companies for potential investment, it would be advisable to consider the ex-dividend date prior to possible purchases. Owning the shares of the company that you're interested in before the ex-dividend date entitles you to the upcoming dividend payment.
Owning the shares on or after the ex-dividend date means that you would have to wait at least three months before receipt of the next dividend payment. Please verify the ex-dividend date and payout ratio before committing funds to these stocks. Additionally, do not base your next long or short-term purchase on the dividend payment or yield. Instead, get as much research in as you possibly can before the ex-dividend date "just in case" you're actually interested in buying the stock. Payout ratios that exceed 100% should be considered speculative investments.
Please revisit New Low Observer for edits and revisions to this post. Email us.

Nasdaq 100 Watch List

Below are the top Nasdaq 100 companies that are within 20% of the 52-week low. This list is strictly for the purpose of researching whether or not the companies have viable business models. These companies are deemed highly speculative unless otherwise noted.

Symbol Name Price P/E EPS Yield P/B % from Low
APOL Apollo Group, Inc. $34.46 9.53 3.62 0 3.75 0.76%
CSCO Cisco Systems, Inc. $19.46 14.27 1.36 0 2.4 1.46%
ISRG Intuitive Surgical, Inc. $257.08 30.6 8.4 0 4.92 4.48%
AMGN Amgen Inc. $53.83 11.64 4.63 0 2.12 7.10%
TEVA Teva Pharma.  $50.37 15.5 3.25 1.40% 2.07 7.19%
DISH DISH Network $19.01 9.34 2.04 0 N/A 9.76%
ADBE Adobe Systems $28.40 31.7 0.9 0 2.84 11.59%
MSFT Microsoft Corp $25.37 10.91 2.33 2.50% 4.58 11.61%
SHLD Sears Holdings $66.22 27.13 2.44 0 0.84 11.84%
GRMN Garmin Ltd. $29.40 8.03 3.66 5.30% 1.93 12.60%
XRAY DENTSPLY Intl $31.40 16.99 1.85 0.60% 2.43 13.11%
FLIR FLIR Systems, Inc. $27.62 18.6 1.49 0 2.93 15.08%
PAYX Paychex, Inc. $28.81 21.48 1.34 4.40% 7.1 16.88%
ATVI Activision Inc $11.74 40.76 0.29 1.30% 1.3 18.23%
HSIC Henry Schein, Inc. $58.21 16.86 3.45 0 2.2 18.55%
GILD Gilead Sciences, Inc. $37.78 11.05 3.42 0 5.28 19.07%
CTAS Cintas Corp $27.53 18.87 1.46 1.80% 1.61 19.18%

Watch List Summary
In the Nasdaq 100 watch list of 17 companies from November 10, 2010 to the closing price of November 24,2010, the average return from all of the companies listed was –0.05%. This is compared to the NDX (Nasdaq 100 Index) which had a decline of –1.55%. Urban Outfitter (URBN) carried our watch list by rising 15.42% while office supplies company Staples (SPLS) was not far behind with a gain of 9.05%.
The laggards from the November 10, 2010 watch list were Intuitive Surgical (ISRG) with a –7.51% decline followed closely behind by Apollo Group (APOL) which fell –6.46% in APOL’s long quest to find a bottom.
Although we often take an interest in stocks with a declining trend, Apollo Group (APOL), with a declining trend over 2 years long, has not found it’s way on our Speculative Observation list. On the other hand, the steady decline of Intuitive Surgical (ISRG) does warrant additional consideration. Intuitive Surgical (ISRG) has a Dow Theory fair value from the March 2009 low to April 2010 high at $154 with the support level of $256.12 recently broken, the only remaining support levels before the fair value level is $221.90 and $187.68.
Top Five Performance Review
In our ongoing review of the Nasdaq 100 Watch List, we have taken the top five stocks on our list from November 27, 2009 and have check their performance one year later. The top five companies on that list are provided below with the closing price for November 27, 2009 and November 24, 2010.
Name 2009 2010 1yr % change
Cephalon, Inc. 55.23 65.47 18.54%
Ryanair Holdings 25.83 30.99 19.98%
Gilead Sciences 45.56 37.78 -17.08%
Genzyme Corp 51.07 71.81 40.61%
Apollo Group, Inc. 55.76 34.46 -38.20%
Average 4.77%
Nasdaq 100 1765.46 2153.91 22.00%
Nasdaq Composite 2138.44 2534.56 18.52%

As a group, the top five companies on our Nasdaq 100 list averaged a gain of 4.77% in the last year. This compares with the Nasdaq 100 Index gain of 22% and the Nasdaq Composite gain of 18.52% in the same one-year time frame. Surprisingly, only one stock, Gilead Sciences (GILD), did not achieve 10% gains within the first four months.
Of the two companies that took large losses, Apollo Group (APOL) fell –38.20% while Gilead Sciences (GILD) fell –17.08%. It is worth noting that Apollo Group (APOL) will probably be dropped from the Nasdaq 100 index on December 10th thereby adding more downside pressure to the stock.
Disclaimer
On our current list, we excluded companies that have no earnings. Stocks that appear on our watch lists are not recommendations to buy. Instead, they are the starting point for doing your research and determining the best company to buy. Ideally, a stock that is purchased from this list is done after a considerable decline in the price and extensive due diligence. We suggest that readers use the March 2009 low (or the companies' most distressed level in the last 2 years) as the downside projection for investing. Our view is to embrace the worse case scenario prior to investing. A minimum of 50% decline or the November 2008 to March 2009 low, whichever is lower, would fit that description. It is important to place these companies on your own watch list so that when the opportunity arises, you can purchase them with a greater margin of safety. It is our expectation that, at the most, only 1/3 of the companies that are part of our list will outperform the market over a one-year period.
Please revisit New Low Observer for edits and revisions to this post. Email us.

Watch List Double Take

After highlighting the performance of Sysco (SYY) during the commodity bull market from 1970 to 1983 on our recent NLO Dividend Watch List, we decided to see how another food distributor/producer stacked up against precious metal stocks.
The total return chart of ConAgra (CAG) below (courtesy of Morningstar.com) should be all you need to know about alternative investment opportunities to gold and silver stocks.  Like Sysco (SYY), ConAgra (CAG) has had incredible performance against precious metal stocks during a period when there is a lot of hype about the benefits of investing in stocks like Newmont (NEM) and Hecla Mining (HL).  If you believe that record high inflation is coming down the road and you're a long-term investor and don't mind a 4.28% dividend yield, research in ConAgra (CAG) just might be for you.
Source: Morningstar.com, date range: 11/20/1972 to 11/19/1983


Below is a chart of CAG compared only to Newmont Mining (NEM) at the very lowest price of NEM on December 13, 1974 to the high of NEM at or near the peak of gold stocks.  In this case, NEM has the bold green line while CAG has the thin red line.  Note that CAG has a total return almost 17 times that of NEM.


Please revisit New Low Observer for edits and revisions to this post. Email us.

NLO Dividend Watch List

Watch List Summary

This week's list contains 21 companies that are among some of the biggest blue-chip institutions out there. Topping this list is the giant food supplier, ConAgra (CAG). A quick glance at the one year performance review of the top five companies (see below) and you may want to consider ConAgra (CAG) as a potential investment.

In addition, there are great household names such as Kimberly-Clark (KMB), Colgate-Palmolive (CL), Pepsi (PEP), and Clorox (CLX) that we are all familiar with. Inflation themed investors can look to another major food supplier to restaurants, Sysco (SYY).  In the following article we wrote on December 17, 2008, we compared Sysco to Newmont Mining (NEM) and Couer D'Alene (CDE) from 1970 to 1983.  On a total return basis, according to Morningstar.com, Sysco gave far superior returns (4 times greater) than the leading gold and silver stocks did during a commodity boom.

The New Low team is very interested in re-purchasing Bank of Hawaii (BOH) as the banking sector is seen as out of favor. If interested, investors can refer to our original writing on Bank of Hawaii from initiation to sell recommendation with a detailed follow-up titled "The Anatomy of a Bear Market Trade."

November 19, 2010 Watch List

Symbol Name Price % Yr Low P/E EPS (ttm) Div/Shr Yield Payout Ratio
CAG ConAgra Foods, Inc. 21.48 2.19% 13.68 1.57 0.92 4.28% 59%
WABC Westamerica BanCorp.  50.50 2.98% 15.83 3.19 1.44 2.85% 45%
IBKC IBERIABANK Corp.  50.52 4.57% 8.43 5.99 1.36 2.69% 23%
GBCI Glacier BanCorp., Inc.  13.32 5.05% 21.14 0.63 0.52 3.90% 83%
VLY Valley National BanCorp.  13.01 6.14% 17.12 0.76 0.72 5.53% 95%
KMB Kimberly-Clark Corp. 61.84 6.16% 13.99 4.42 2.64 4.27% 60%
ABT Abbott Laboratories 47.40 6.30% 15.64 3.03 1.76 3.71% 58%
CLX Clorox Co. 62.93 6.73% 13.50 4.66 2.20 3.50% 47%
CBSH Commerce Bancshares, Inc.  37.59 7.09% 14.98 2.51 0.94 2.50% 37%
CL Colgate-Palmolive Co. 78.21 6.96% 18.27 4.28 2.12 2.71% 50%
LLY Eli Lilly & Co. 34.50 7.75% 7.91 4.36 1.96 5.68% 45%
BOH Bank of Hawaii Corp. 44.95 8.05% 11.83 3.80 1.80 4.00% 47%
CWT California Water Service 36.44 7.78% 19.28 1.89 1.19 3.27% 63%
WFSL Washington Federal, Inc.  15.17 8.59% 14.45 1.05 0.20 1.32% 19%
SYY Sysco Corp. 28.84 8.83% 14.87 1.94 1.04 3.61% 54%
FULT Fulton Financial Corp.  8.87 9.51% 16.43 0.54 0.12 1.35% 22%
FNFG First Niagara Financial Group 12.31 9.62% 19.54 0.63 0.60 4.87% 95%
TFX Teleflex Inc. 52.62 9.81% 12.99 4.05 1.36 2.58% 34%
PEP Pepsi Co Inc. 64.71 10.14% 16.30 3.97 1.92 2.97% 48%
EGN Energen Corp. 44.41 10.34% 11.87 3.74 0.52 1.17% 14%
PNR Pentair, Inc. 32.53 10.61% 17.87 1.82 0.76 2.34% 42%
21 Companies


Top Five Performance Review

In our ongoing review of the NLO Dividend Watch List, we have taken the top five stocks on our list from November 20, 2009 and have check their performance one year later. The top five companies on that list were Aqua America (WTR), First Financial (THFF), California Water(CWT), WGL Holding (WGL), and UGI (UGI).

Name Symbol 2009 Price 2010 Price % change
AQUA AMERICA INC WTR 15.88 21.05 32.56%
First Financial Corporation Ind THFF 27.96 31.1 11.23%
CALIFORNIA WATER SVC CWT 35.78 36.44 1.84%
WGL HOLDINGS INC WGL 31.33 37.12 18.48%
U G I CP UGI 23.36 30.16 29.11%


Average 18.64%


Dow Jones Industrial DJI 10,318.16 11,203.55 8.58%
S&P 500 SPX 1,091.38 1,199.73 9.93%

As a group, the top five companies on our Dividend List averaged a gain of 18.64% in the last year. This compares with the Dow Jones Industrial Average gain of 8.58% and the S&P500 gain of 9.93% in the same one year time frame. Again, the graph below demonstrates that all stocks achieved 10% gains within six months of being on the watch list from November of 2009.

Disclaimer

On our current list, we excluded companies that have no earnings and payout ratios in excess of 100%. Stocks that appear on our watch lists are not recommendations to buy. Instead, they are the starting point for doing your research and determining the best company to buy. Ideally, a stock that is purchased from this list is done after a considerable decline in the price and extensive due diligence. Because our list has many great companies, we urged investors to filter for companies with less than 50% payout ratio. This should minimized the risk of dividend reductions if earnings are to fall by half. If you understand the companies' history and their ability to pay the dividend, then payout ratios in excess of 50% may be considered. We suggest readers use the March 2009 low (or companies' most distressed level in the last 2 years) as the downside projection for investing. Our view is to embrace the worse case scenario prior to investing. The November 2008 to March 2009 time frame fits that description. It is important to place these companies on your own watch list so that when the opportunity arises, you can purchase them with a greater margin of safety.

Please revisit New Low Observer for edits and revisions to this post. Email us.

Answering the Critics

We've gone to exceptional lengths to answer the critics of our most recent article titled "A Comparison Between Dividend Strategies."  Please visit the comment section (located here) for thought provoking questions on our methodology and conclusions.  We certainly learned a lot in the process and hope you do as well.

Please revisit New Low Observer for edits and revisions to this post. Email us.