Market Review and Analysis

As the Dow Jones Industrial Average (DIA) approaches the 12,000 level, we believe it is necessary to review our analysis leading up to this point. There have been indications that the market would knock on the door of 12,000. And we’ve been at the forefront of this analysis very early on.
Starting as early as February 12, 2009 (article here), we warned that despite the declining trend in the markets, history has proven that declines of 40% or more tend to retrace 60% to 100% of the previous decline.
In September 2009, after reviewing the Coppock Curve (article here), we pointed out that if the market held up in October 2009 that 12,000 on the Dow would not be an unrealistic price target.
In January 2010, we mistakenly thought that the Dow had a good chance to reach 12,000 by February 2010 (article here). Although we were woefully inaccurate in the timing of our estimate, we were convinced that 12,000 as an upside target was not unreasonable.
On March 23, 2010, we came out with an article that highlighted what we thought was confirmation of a cycle low in the market on February 8th (article here). In retrospect, although it was a major low for the year 2010, it was not as significant as the July 2010 low. However, we reiterated 12,000 as the target for the Dow.
Our eyes are now trained on the next target for the market. This is where our “analysis” is put to the test. All along we’ve thought that a rise from 6,400 to 12,000 would not be very unusual. However, getting back to even, or 14,164, will be very challenging. There are many who feel that external forces have falsified the markets rise.
As far as we’re concerned, we’ve accomplished the target that was long since projected and is now upon us. As we’ve indicated in a recent article, the Dow Industrials’ upward trend has less to do with the actions of the Federal Reserve and more to do with the corrective nature of markets after a significant plunge like in the period from October 2007 to March 2009 (article here).
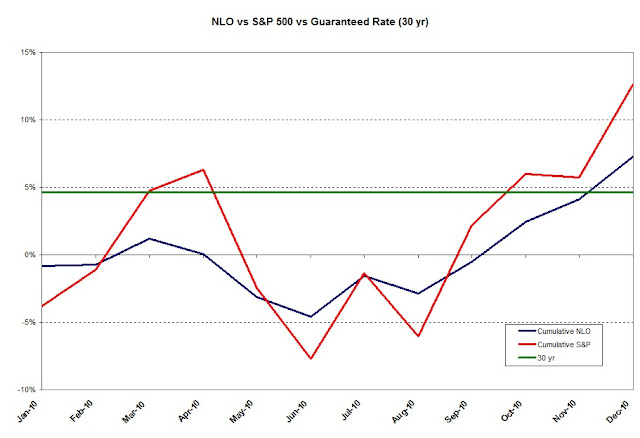
We’ve noted in the article titled “Diversification Doesn’t Matter” that declines in the Dow will be amplified in the S&P 500 and Nasdaq Composite Index (article here). Exposure to these diversified indexes through the use of index funds and ETFs will result in surprising losses that defy the theory of diversification as was the case in 2008.
We believe that as long as the price of gold keeps moving higher in conjunction with the Philadelphia Gold and Silver Index (XAU) and Dow Theory confirmations of the bullish trend continue, there is a good chance that the market will retrace 100% of the previous decline from 2007 to 2009. At times like these, the rise and fall of the price of gold may be a leading indicator for where the market might be headed. Our numerous articles on the correlation between gold and the stock market have proven to be correct for those willing to accept the data from an unemotional standpoint (article link).
Although it is not unusual for markets to retrace 100% of a prior decline of 40% or more, we’re more than willing to figuratively step aside and watch what happens next. However, we cannot help taking another stab at when, and not at what exact level, the Dow Industrials will peak. Two prior articles on the topic are the basis for our thoughts on the prospects for where the top may occur.
On June 14, 2010, we wrote an article titled, “A Market Cycle Worth Observing” (article here). In that article, we reminded readers of the consistency of 4-year cycles to provide key markers for tops and bottoms in the market. We included referenced from Charles H. Dow’s era, founder of the Wall Street Journal, from 1901 and prior. We gave examples as provide by Richard Russell from 1953 to 1979. We were even able to provide examples from the period between 1987 and 2009.
If there really are 4-year cycles, as we contend, then October 2007 would stand as the marker for the last peak in the cycle. In theory, the mid-point for the peak would be some point in 2009. For us, March 9, 2009 represents the low or mid-point for the 4-year cycle. Our estimate is that the full 4-year cycle should be completed with the Dow Jones Industrial Average peaking at some point in 2011.
According to Dow Theory, the downside target is set at 9,273.50. If this level is breached in conjunction with the Dow Transports, then we could consider a bear market has been initiated.
The second article that we derived our view of the market is dated April 11, 2010 on the topic of Dow Theory (located here). In that market analysis, we proposed, in addition to the fact that the Dow Industrials “…could go to 11,574.59 with no problem,” we outlined three hypothetical scenarios under which the Dow Industrials would reach 14,164.
In retrospect, and upon further analysis, we realized that those projections were really indications for when the market would top irrespective of the exact level that the top would occur. It seems to us that the period from January 31, 2011 to June 18, 2011 is the timeframe for when the completion of the cycle should take place.
Despite our concerns for an eminent top in the market, we will continue to buy and sell individual stocks. From our experience in 2008, gains can be obtained from individual stocks within the context of a declining trend in the market. In fact, during 2008 there were only three months where losses were registered which were June, October and November. Although these months incurred substantial losses, 2008 ended with overall gains of 14% in our portfolio (article link).


Please revisit New Low Observer for edits and revisions to this post. Email us.

Nasdaq 100 Watch List

Below are the top Nasdaq 100 companies that are within 20% of the 52-week low. This list is strictly for the purpose of researching whether or not the companies have viable business models. These companies are deemed highly speculative unless otherwise noted.
Symbol Name Trade P/E EPS Yield P/B % from Low
CEPH Cephalon, Inc. 59.64 11.14 5.35 N/A 1.81 8.44%
CSCO Cisco Systems, Inc. 20.73 15.13 1.37 N/A 2.59 9.08%
QGEN Qiagen N.V. 18.56 29.18 0.64 N/A 1.8 10.08%
TEVA Teva Pharmaceutical 52.86 16.27 3.25 1.30% 2.23 12.49%
ATVI Activision Blizzard, Inc 11.25 38.25 0.29 1.30% 1.29 13.24%
AMGN Amgen Inc. 56.97 12.31 4.63 N/A 2.27 13.35%
CELG Celgene Corporation 56.03 28.3 1.98 N/A 5.06 16.68%
GRMN Garmin Ltd. 30.79 8.42 3.66 4.90% 2.11 17.92%
INTC Intel Corporation 20.82 10.16 2.05 3.00% 2.34 18.30%
DELL Dell Inc. 13.47 12.95 1.04 N/A 3.85 18.78%

Watch List Performance Review

In our ongoing review of the Nasdaq 100 Watch List, we have taken the top five stocks on our list from the closing price of January 22, 2010 and have checked their performance one year later.  The top five companies on that list are provided below with the closing price for January 22, 2010 and January 21, 2011.

Symbol
Company
2010
2011
% change
First Solar
112.39
147.41
31.16%
Gilead Sci.
46.08
38.19
-17.12%
Genzyme
54.38
71.58
31.63%
Apollo Grp
61.19
42.35
-30.79%
Electronic Arts
16.77
15.13
-9.78%
Average Gain
1.02%
NDX
Nasdaq 100
1794.82
2268.32
26.38%

Disclaimer

Stocks that appear on our watch lists are not recommendations to buy. Instead, they are the starting point for doing your research and determining the best company to buy. Ideally, a stock that is purchased from this list is done after a considerable decline in the price and extensive due diligence. We suggest that readers use the March 2009 low (or the companies' most distressed level in the last 2 years) as the downside projection for investing. Our view is to embrace the worse case scenario prior to investing. A minimum of 50% decline or the November 2008 to March 2009 low, whichever is lower, would fit that description. It is important to place these companies on your own watch list so that when the opportunity arises, you can purchase them with a greater margin of safety. It is our expectation that, at the most, only 1/3 of the companies that are part of our list will outperform the market over a one-year period.

Federal Reserve Isn’t to Blame for the Current Market Run

The phrase “this time is different” is often associated with a blithe understanding of the past and an unwillingness to accept time tested facts. Most often this phrase is uttered at stock market tops as an indication that basic rules of economics no longer apply. Unfortunately, there is a back door reference to “this time being different” when market analysts, of the bearish perspective, make claims that this “exceptional” market run is being fuel by the Federal Reserve.

The thought is that, with all the printing of money and “quantitative easing”, the only reason that the market could possibly rise as much as it has is because of the Federal Reserve. In this piece, we’re going to show that Fed or not, the market, after a large decline of nearly -50% in one stretch, retracing +50% to +100% of the prior losses is typical of the market.

Starting with the period from 1861, the average price of the ten leading stocks (rails), based on trading volume, went from the level of 50 to as high as 141 in early 1864. The subsequent decline from 141 in 1864 to as low as 43 incurred a loss of -69% by 1877. The following rise, from 43 in 1864 to the level of 121 in 1881 was an increase of over +79%.

After the 1881 peak in the ten leading stocks at the 121 level, the stock average promptly dropped to the 65 level in 1884, a loss of over -46%. The rise in the ten leading stocks from the bottom in 1884 took the index to 102 in 1890, or an increase of +66%.

The peak of 1890 at 102 was quickly followed by a decline of the leading stocks to 60, a decline of -41%. After trading in a tight range until 1898, the leading stocks rose to 180 by 1905, a gain of +200% in eight years.

The preceding examples were derived from the book “Wall Street and the stock markets: A chronology (1644-1971)” by Peter Wyckoff on pages 38 and pages 39. For those interested, Wyckoff specifics exactly which stocks were initially included in the leading stocks and which stocks were added and dropped in the period following.

Switching to the Dow Industrials from 1906 to 1922. Below, we are republishing the data from our timely article dated February 12, 2009 titled “Misinformed Market Observations” (found here). In that article we show that declines of -40% or more resulted in rebounds of +50% to +100% of the previous decline.

  • Jan 19, 1906 to Nov. 15, 1907 decline of -48.3%
  • Nov. 15, 1907 to Nov. 19, 1909 increase of +89%
  • Sept. 30, 1912 to Dec. 24, 1914 decline of -43%
  • Dec. 24, 1914 to Nov. 21, 1916 increase of +107%
  • Nov. 21, 1916 to Dec. 19, 1917 decline of -40%
  • Dec. 19, 1917 to Nov. 03, 1919 increase of +81%
  • Nov. 3, 1919 to Aug. 24, 1921 decline of –46%
  • Aug. 24, 1921 to Oct. 14, 1922 increase of +61%

The most important element that should be taken away from all this data is that the current Federal Reserve did not exist prior to January 1914. There was no way to ascribe the gains of the market to a central bank. All iterations of a central bank with the First Bank of the United States (1791-1811) and the Second Bank of the United States (1816-1836) did not have any effect on the data sets that we have provide from the period of 1860 to 1914. In order for the claim that the current market run is based on the monetary policies of the Federal Reserve, we’d need to be able to demonstrate that the stock market would have performed differently without the existence of a Federal Reserve.

Unfortunately, those that claim “this time is different” aren’t trying hard enough to prove their claim false. A cursory review of market data during the periods from 1860 to 1914 makes it clear that declines of nearly -50% or more are likely to retrace +66% to +100% of prior declines. This pattern has been easily demonstrated in the periods after 1914. However, we’re only trying to illustrate that the acceptance of the Federal Reserve’s role as the leading cause of the current +69% retracement of the prior decline (2007-2009) is false.

Portfolio Turnover: An Important Consideration

In the article, “The Pre-Tax Costs of Portfolio Turnover” by David Blanchett dated May/June 2007 there is important discussion of the topic of portfolio turnover. Investopedia.com defines portfolio turnover as:
“A measure of how frequently assets within a fund are bought and sold by the managers. Portfolio turnover is calculated by taking either the total amount of new securities purchased or the amount of securities sold - whichever is less - over a particular period, divided by the total net asset value (NAV) of the fund. The measurement is usually reported for a 12-month time period.”
Blanchett frames the topic of portfolio turnover in the context of institutional investors such as mutual funds and/or pension funds.
According to Blanchett, the negative impact of turnover is most clearly demonstrated in four specific categories. First, through the spread between the bid and ask which was traditionally higher (more expensive) when stocks were quoted in fractions. Second, through the commissions paid for entering and exiting a transaction which is relatively low compared when using a discount brokerage. Third, through the higher cost of short-term tax rates for positions held for less than a year. Stocks held for less that a year are currently taxed as high as 35% whereas stocks held for a year or longer are currently taxed at rate of 15%. Finally, Blanchett considers the market impact of buying or selling a stock in relatively illiquid stocks which impacts the ability to enter or exist a stock on favorable terms. All of these factors negatively impact the return on a given stock as the level of turnover increases thereby reducing gains or increasing losses.
The article by Blanchett concludes that for every 100% of turnover in the portfolio there is a pre-tax loss from 19 basis points (-0.19%) to 98 basis points. Other studies mentioned in the article demonstrate that for every 100% of portfolio turnover there is a pre-tax loss of 225 bps (-2.25%).
Overall, the article by Blanchett is clear and succinct allowing for a justification as to why buy-and-hold investing is the preferred strategy for institutional fund managers. The New Low Observer portfolio is susceptible to high turnover due to the willingness to take large initial positions and sell when the stock attains a 10% gain. In addition, the size of our portfolio cannot be measured in the billions and therefore amplifies the effects of commissions and minimizes the effect of market impact. The topic of portfolio turnover is worth considering if you plan to buy and sell stocks with positions that comprise less that 5% of the portfolio.

Please revisit New Low Observer for edits and revisions to this post. Email us.

2010 Performance Review

This year was the worst performing year for the New Low Observer in the last five years since our investment approach was codified.  Despite our lackluster performance, you can see that our portfolio incurred less volatility that the S&P 500 index.  We believe this has a lot to do with our philosophy, or the lack thereof, on diversification.  Although our portfolio did not beat any of the major indexes (Dow Industrials, S&P 500, and Nasdaq Composite) we did manage to exceed the return of our primary target, the 30-year U.S. treasury. 
Below is the end of month performance chart of the NLO portfolio and the S&P 500 during 2010.  Throughout the entire year we averaged 50% of the portfolio in stocks and 50% in cash.  The period from January to June reflects partial implementation of our strategy.  The second half of the year, June to December, reflects the full use of our investment strategy.
New Low Observer performance for 2010 (http://www.newlowobserver.com/)
Our new target to beat in the coming year is the 30-year treasury yield as of January 3, 2011 at a rate of 4.39%.  Although this is a modest target, we cannot easily justify the buying and selling of stocks if we cannot exceed the return of a guaranteed rate. 
Below is the performance of our portfolio since the end of 2005:

Dow
S&P
NASDAQ
NLO
2006
16.29%
15.74%
9.52%
18.30%
2007
6.43%
5.46%
9.81%
19.80%
2008
-33.84%
-37.22%
-40.54%
14.35%
2009
18.82%
27.11%
43.89%
36.65%
2010
11.02%
14.32%
16.91%
7.14%

NLO Dividend Watch List

We began the year with a very strong market that also included a Dow Theory confirmation of the bullish trend and our watch list now contains 19 companies that are within 15% of their 52-week low.

January 14, 2011 Watch List

Symbol Name Price % Yr Low P/E EPS (ttm) Dividend Yield Payout Ratio
ABT Abbott Laboratories 46.89 5.16% 15.48 3.03 1.76 3.75% 58%
CL Colgate-Palmolive Co. 78.31 7.10% 18.30 4.28 2.12 2.71% 50%
CLX Clorox Co. 63.98 8.51% 13.76 4.65 2.20 3.44% 47%
LLY Eli Lilly & Co. 34.91 9.03% 8.01 4.36 1.96 5.61% 45%
KMB Kimberly-Clark Corp. 63.64 9.25% 14.40 4.42 2.64 4.15% 60%
CAG ConAgra Foods, Inc. 23.11 9.94% 15.51 1.49 0.92 3.98% 62%
JNJ Johnson & Johnson   62.55 10.01% 12.84 4.87 2.16 3.45% 44%
UVV Universal Corp. 39 10.29% 7.66 5.09 1.92 4.92% 38%
NWN Northwest Natural Gas Co. 45.71 11.35% 16.33 2.80 1.74 3.81% 62%
CWT California Water Service 37.68 11.45% 19.94 1.89 1.19 3.16% 63%
MRK Merck & Co., Inc 34.23 11.50% 13.22 2.59 1.52 4.44% 59%
SYY Sysco Corp. 30.45 12.82% 15.70 1.94 1.04 3.42% 54%
AWR American States Water Co. 35.24 12.95% 23.97 1.47 1.04 2.95% 71%
PEP PepsiCo Inc. 66.78 13.67% 16.82 3.97 1.92 2.88% 48%
TGT Target Corp. 55.07 14.18% 14.42 3.82 1.00 1.82% 26%
ALL Allstate Corp.   30.71 14.33% 14.49 2.12 0.80 2.61% 38%
WMT Wal-Mart Stores, Inc. 54.81 14.74% 13.57 4.04 1.21 2.21% 30%
WABC Westamerica BanCorp.  55.9 14.78% 17.52 3.19 1.44 2.58% 45%
MCY Mercury General Corp. 42.97 14.95% 11.22 3.83 2.40 5.59% 63%
19 Companies


Watch List Summary

Some of these companies have been "stuck" on our list for quite some time. Clorox (CLX) has been stuck in the $62 and $64 range for about 10 weeks. For six months Colgate (CL) has spent most of its time trading between $80 and $75.  According to Charles Dow, this biding of time by trading in a "line" creates values  (article here) and may be the first sign of accumulation by institutional investors. Moreover, if the price remains constant while the underlying fundamentals improve (i.e. earnings, dividend, cash flow, book value etc.), the shares could be deemed screaming buys. Conservative and patience investors may want to start their research on these names.

Insurance names are of particular focus by our team currently.  According to Yahoo!Finance, Allstate (ALL) sports a price to book ratio (P/B) of 0.86 while Mercury General (MCY) has a P/B of 1.27.  We are actively buying up many insurance company stocks that have exceptionally low price to book ratios on a relative basis.

Northwest Natural Gas (NWN) is again creeping towards its annual cycle of bottoming in February and March.  Our October 3, 2009 article (located here) on this topic provides what we believe is extensive reseach on the pattern of cycle bottoms for NWN going as far back as 1970. As a follow-up, another article (located here) that we did on NWN provides technical insights on Edson Gould's Altimeter by comparing the stock price movement between 1995-1997 and 2000-2009.  These elements may assist in your fundamental analysis of a great stock with a decent dividend yield.

Top Five Performance Review

In our ongoing review of the NLO Dividend Watch List, we have taken the top five stocks on our list from January 15, 2010 and have check their performance one year later. The top five companies on that list can be seen in the table below.
Name Symbol 2010 Price 2011 Price % change
Shenandoah Telecom. SHEN 17.18 19.19 11.70%
First Financial Corp. THFF 28.97 33.12 14.33%
1st Source Corp. SRCE 15.14 19.88 31.31%
Exxon Mobil XOM 69.11 77.84 12.63%
California Water CWT 37.7 37.68 -0.05%


Average 13.98%


Dow Jones Industrial DJI 10,706.99 11,787.38 10.09%
S&P 500 SPX 1,147.72 1,293.24 12.68%

While our average return was greater than the market, only two companies, First Financial (SRCE) and Shenandoah (SHEN), accomplished the 10% benchmark in less than six months. It's also interesting to note that while ExxonMobil (XOM) underperformed the market for the majority of the year, it managed to track the market at the end of the one year mark. Taking the dividend into consideration, Exxon may have outperformed the market by about one percent.

Disclaimer

On our current list, we excluded companies that have no earnings. Stocks that appear on our watch lists are not recommendations to buy. Instead, they are the starting point for doing your research and determining the best company to buy. Ideally, a stock that is purchased from this list is done after a considerable decline in the price and extensive due diligence. We suggest that readers use the March 2009 low (or the companies' most distressed level in the last 2 years) as the downside projection for investing. Our view is to embrace the worse case scenario prior to investing. A minimum of 50% decline or the November 2008 to March 2009 low, whichever is lower, would fit that description. It is important to place these companies on your own watch list so that when the opportunity arises, you can purchase them with a greater margin of safety. It is our expectation that, at the most, only 1/3 of the companies that are part of our list will outperform the market over a one-year period.

Please revisit New Low Observer for edits and revisions to this post. Email us.

Nasdaq 100 Watch List

Below are the top Nasdaq 100 companies that are within 20% of the 52-week low. This list is strictly for the purpose of researching whether or not the companies have viable business models. These companies are deemed highly speculative unless otherwise noted.
Symbol Name Price P/E EPS Yield P/B % from Low
ISRG Intuitive Surgical $267.40 31.8 $8.40 - 5.26 8.68%
CEPH Cephalon, Inc. $60.32 11.3 $5.35 - 1.81 9.67%
CSCO Cisco Systems $20.97 15.4 $1.36 - 2.62 10.37%
APOL Apollo Group, Inc. $37.98 10.5 $3.62 - 4.30 12.54%
AMGN Amgen Inc. $56.98 12.3 $4.63 - 2.24 13.37%
ERTS Electronic Arts $16.05 - -$0.48 - 2.04 14.17%
QGEN Qiagen N.V. $19.32 30.4 $0.64 - 1.89 14.59%
TEVA Teva Pharma. $54.01 16.6 $3.25 1.30% 2.22 14.94%
VRTX Vertex Pharma. $36.16 - -$3.73 - 11.31 15.71%
GRMN Garmin Ltd. $30.53 8.3 $3.66 4.80% 2.10 16.93%
INTC Intel Corporation $20.66 11.2 $1.85 3.00% 2.43 17.39%
GILD Gilead Sciences $37.50 11.0 $3.42 - 5.36 18.18%
SHLD Sears Holdings $70.18 41.9 $1.68 - 0.94 18.53%
^NDX Nasdaq 100 2,276.70
***Read our Chapter 2 review of Seth Klarman's book Margin of Safety here***

Watch List Summary
From the current watchlist we are considering the prospects for Intuitive Surgical (ISRG), Intel (INTC) and Garmin (GRMN).  Garmin is interesting simply for the fact that the moving feast known as their dividend should be announced in the coming months.  We're curious if Garmin will eliminate, raise, lower or keep the dividend the same.  As has been the case in the last four years, Garmin has paid their dividend all at once.  This will be very interesting considering the 4.80% payment. 
In the Nasdaq 100 Watch List of 15 companies from December 12, 2010 to the closing price January 7, 2011, the average return from all of the companies was +3.65%.  This is compared to the NDX (Nasdaq 100 Index) which had a gain of +2.77%.
Dish Network (DISH) registered the largest gain of +12.45%. Adobe Systems (ADBE) rose 11.60% since December 12th.  Cisco (CSCO) came in third on the list with a gain of 6.45%.
Watch List Performance Review
In our ongoing review of the Nasdaq 100 Watch List, we have taken the top four stocks on our list from the closing price of January 7, 2010 and have checked their performance one year later. The top four companies on that list are provided below with the closing price for January 7, 2010 and January 7, 2011.

Symbol Name 2010 2011 % change
GILD Gilead Sciences 44.54 37.50 -15.81%
CEPH Cephalon, Inc. 63.01 60.32 -4.27%
GENZ Genzyme Corp 53.81 71.39 32.67%
APOL Apollo Group 60.50 37.98 -37.22%
Average -6.16%
^NDX Nasdaq 100 1892.59 2276.70 20.30%
Only one stock, Genzyme (GENZ), was able to to show a positive return.  This was of little consolation as the three other stocks on our watchlist fell, on average, -19%.  The Nasdaq 100 outperformed the watchlist with a gain of 20% in the last year. 
Disclaimer
Stocks that appear on our watch lists are not recommendations to buy. Instead, they are the starting point for doing your research and determining the best company to buy. Ideally, a stock that is purchased from this list is done after a considerable decline in the price and extensive due diligence. We suggest that readers use the March 2009 low (or the companies' most distressed level in the last 2 years) as the downside projection for investing. Our view is to embrace the worse case scenario prior to investing. A minimum of 50% decline or the November 2008 to March 2009 low, whichever is lower, would fit that description. It is important to place these companies on your own watch list so that when the opportunity arises, you can purchase them with a greater margin of safety. It is our expectation that, at the most, only 1/3 of the companies that are part of our list will outperform the market over a one-year period.

Please revisit New Low Observer for edits and revisions to this post. Email us.

NLO Dividend Watch List

Watch List Summary

We end 2010 and begin 2011 with 10 companies on our Dividend Watch List. The table below provides investors with some great prospects for the new year.
December 31, 2010 Watch List

Symbol Name Price % Yr Low P/E EPS (ttm) Dividend Yield Payout Ratio
CLX Clorox Co. 63.28 7.33% 13.61 4.65 2.20 3.48% 47%
CAG ConAgra Foods, Inc. 22.58 7.42% 14.29 1.58 0.92 4.07% 58%
ABT Abbott Laboratories 47.91 7.45% 15.81 3.03 1.76 3.67% 58%
KMB Kimberly-Clark Corp. 63.04 8.22% 14.26 4.42 2.64 4.19% 60%
JNJ Johnson & Johnson   61.85 8.78% 12.70 4.87 2.16 3.49% 44%
SYY Sysco Corp. 29.40 8.93% 15.15 1.94 1.04 3.54% 54%
LLY Eli Lilly & Co. 35.04 9.43% 8.04 4.36 1.96 5.59% 45%
CL Colgate-Palmolive Co. 80.37 9.92% 18.78 4.28 2.12 2.64% 50%
CWT California Water Service 37.27 10.23% 19.72 1.89 1.19 3.19% 63%
AWR American States Water 34.47 10.48% 23.45 1.47 1.04 3.02% 71%
10 Companies


Looking at the current watch list, it appears to have good elements of a "diversified" portfolio.  Below is how we would manage the distribution of an investment portfolio of the above stocks in the coming year:
As each position achieves a 10% return within a year, we consider selling the stock and rolling the funds into cash or the next best alternative.  It could be said that the watchlist above is one of the most compelling portfolios for new investors. We've broken down the positions into industry groups so that each industry (water, big pharma, food producers/distributors, household products) gets approximately 25% of invested funds or 12.5% of the entire portfolio.  The cash is for any dividend stock (in the universe of those stocks that had a history increasing annual dividends every year for a minimum of 10 years in a row) that suddenly becomes underpriced and could be verified to be a viable going concern based on fundamental metrics.  We'd label this the portfolio for 2011. 

Top Five Performance Review

In our ongoing review of the NLO Dividend Watch List, we have taken the top five stocks on our list from January 1, 2010 and have check their performance one year later. The top five companies on that list can be seen in the table below.

Name Symbol 2009 Price 2010 Price % change
SUPERVALU Inc. SVU 12.71 9.63 -24.23%
California Water Service CWT 36.82 37.27 1.22%
Exxon Mobil Corp.   XOM 68.19 73.12 7.23%
CR Bard, Inc. BCR 77.9 91.77 17.80%
Aqua America Inc WTR 17.51 22.48 28.38%


Average 6.08%


Dow Jones Industrial DJI 10,520.10 11,577.51 10.05%
S&P 500 SPX 1,126.48 1,257.64 11.64%
It is interesting to note that we've had personal experience will all of the stocks mentioned above within the last 18 months.  Although SuperValu (SVU) shows a major decline of over -30% at one point in the last year, we were able to achieve an annualized return of nearly 400% with our recommendation and subsequent sell recommendation in the month of January 2010 (article here).  This is one instance where buy and hold wasn't the most exciting policy.
California Water (CWT) was recommended on January 3, 2010 (article here) and we suggested that, based on cycle analysis, the prospects of CWT making a substantial move above the prior high would be between 2011 and 2012.  CWT proved to be an income generater in 2010 for investors who managed to hold the stock understanding that the price probably wouldn't take off immediately.  Our downside target are still in place for anyone considering the stock.
ExxonMobil (XOM) was another recommendation that we made in January of 2010.  The stock fell 15% during the year and recovered to return 10% on a total return basis which prompted our sell recommendation in December 2010 (article here).
Bard Corp (BCR) provided annualized returns of 29% at the time of our August 2009 sell recommendation (article here). We had held the stock for approximately 4 months with satisfactory results.  As noted in all or our recommendations, we seek modest annualized returns of between 9% and 12%.  Therefore, accomplishing 29% allows us to take advantage of other opportunities that may exist at the time.
AquaAmerica (WTR) was a runaway success in the past year considering the performance of the market overall and that a water utility is only expected to provide income to investors.  As indicated in the chart above, WTR's total return exceeded over 30% (dividends plus appreciation).  In December 2010, we provided our sell recommendation of AquaAmerica (article here) after garnering an annualized total return of nearly 80%.

Disclaimer

On our current list, we excluded companies that have no earnings. Stocks that appear on our watch lists are not recommendations to buy. Instead, they are the starting point for doing your research and determining the best company to buy. Ideally, a stock that is purchased from this list is done after a considerable decline in the price and extensive due diligence. We suggest that readers use the March 2009 low (or the companies' most distressed level in the last 2 years) as the downside projection for investing. Our view is to embrace the worse case scenario prior to investing. A minimum of 50% decline or the November 2008 to March 2009 low, whichever is lower, would fit that description. It is important to place these companies on your own watch list so that when the opportunity arises, you can purchase them with a greater margin of safety. It is our expectation that, at the most, only 1/3 of the companies that are part of our list will outperform the market over a one-year period.

Please revisit New Low Observer for edits and revisions to this post. Email us.

January 2011 Ex-Dividend Dates

Below are the approximate ex-dividend dates for the month of January 2011 for companies that appear on our Dividend Achiever, Nasdaq 100, Dow Jones Transportation Index and International Dividend Achiever Watch Lists. All companies are ranked by ex-dividend dates.

Companies that show up on our Watch Lists could be considered the equivalent of the bargain bin of high quality blue chip stocks. Because these companies have increased their dividends every year for at least 10 years in a row or are part of the Nasdaq 100 and within 20% of their respective 52-week low, you know that you’re not overpaying for a company that has demonstrated profitability and the ability to rebound from challenging times.


Symbol Name Price % from Low Yield Div/Shr EPS Ex-Div
SSS Sovran Self Storage, Inc. $37.22 19.60% 4.90% $1.80 $1.11 1/4/2011
JPM JP Morgan Chase $42.21 20.05% 0.50% $0.20 $3.59 1/4/2011
SYY Sysco Corporation $29.35 8.74% 3.60% $1.04 $1.94 1/5/2011
AXP American Express $42.64 16.50% 1.70% $0.72 $3.07 1/5/2011
GBCI Glacier Bancorp, Inc. $15.39 19.88% 3.30% $0.52 $0.64 1/5/2011
MDT Medtronic Inc. $37.16 20.65% 2.40% $0.90 $2.89 1/5/2011
UVV Universal Corp $41.01 15.98% 4.60% $1.92 $5.09 1/6/2011
WGL WGL Holdings $36.24 16.90% 4.20% $1.51 $2.47 1/6/2011
PGN Progress Energy Inc $43.55 17.58% 5.70% $2.48 $3.08 1/6/2011
FUL H. B. Fuller $20.70 12.07% 1.30% $0.28 $1.48 1/10/2011
ABT Abbott Lab $47.77 7.12% 3.70% $1.76 $3.03 1/12/2011
CL Colgate-Palmolive $80.18 9.66% 2.60% $2.12 $4.28 1/19/2011
CLX Clorox $63.31 7.38% 3.50% $2.20 $4.65 1/25/2011
NWN Northwest Natural Gas $46.91 14.28% 3.70% $1.74 $2.80 1/25/2011
TCB TCF Financial $14.94 15.81% 1.40% $0.20 $1.00 1/25/2011
EV Eaton Vance Corp $30.23 18.09% 2.30% $0.72 $1.40 1/25/2011
LSTR Landstar System $40.89 17.30% 0.50% $0.20 $1.64 1/26/2011
CAG ConAgra Foods $22.57 7.37% 4.10% $0.92 $1.58 1/27/2011
WSC Wesco Financial $367.58 15.47% 0.40% $1.64 $10.20 1/31/2011

If you happen to be researching these companies for potential investment, it would be advisable to consider the ex-dividend date prior to possible purchases. Owning the shares of the company that you're interested in before the ex-dividend date entitles you to the upcoming dividend payment.

Owning the shares on or after the ex-dividend date means that you would have to wait at least three months before receipt of the next dividend payment. Please verify the ex-dividend date and payout ratio before committing funds to these stocks. Additionally, do not base your next long or short-term purchase on the dividend payment or yield. Instead, get as much research in as you possibly can before the ex-dividend date "just in case" you're actually interested in buying the stock. Payout ratios that exceed 100% should be considered speculative investments.

Please revisit New Low Observer for edits and revisions to this post. Email us.

Seth Klarman Review: Margin of Safety-Chapter 2

The following is a line for line analysis of chapter two of Seth Klarman's book Margin of Safety. we're providing the concept or idea that we think is being conveyed followed by the quote or concept and page where you can find the citation. Additionally, we follow-up with our thoughts on the concept. We hope to review the complete book one chapter at a time.
According to GuruFocus.com, "Seth Klarman is a value investor and Portfolio Manager of the investment partnership The Baupost Group. Founded in 1983, The Baupost Group now manages $7 billion, and has averaged returns of nearly 20% annually since their inception. Seth Klarman is the author of the book 'Margin of Safety' which sells for over $1000."
Chapter Two 
  • Wall Street is Plagued by Conflict of Interest
    • As Wall Street pursues its various activities, however, it frequently is plagued by conflicts of interest and a short-term orientation. Investors need not condemn Wall Street for this as long as they remain aware of it and act with cautious skepticism in any interactions they may have.” (page 20)
        • It should be assumed that a conflict of interest is par for the course when crossing paths with Wall Street. Therefore, we needn’t be upset or worried when companies, acting in accordance with the goals of Wall Street, conduct business in a similar fashion. As investors we need to plan our strategies around the worst outcomes that have been the result of Wall Street “activities.”
  • Wall Street Compensation
    • Wall Streeters get paid primarily for what they do, not how effectively they do it.” (page 20)
        • Again, this extends to corporations that play the Wall Street game. If “The Street” feels that stock buybacks are an effective way to increase shareholder value then the corporations will do it. Although we have sat in on VC meetings where the head of a company explicitly said that share buyback are worthless as a strategy for increasing shareholder value.
  • Create a New Product, Generate a Higher Fee
    • Sometimes the lust for underwriting fees drives Wall Street to actually create underwriting clients for the sole purpose of having securities to sell.” (page 22)
        • The creation of ETFs, which were supposed to more effectively compete with Index Funds or supplant sector funds, seems to fit the bill in this regards since there is considerable question of whether the ETFs actually hold the asset they claim to be in possession of; either stock or commodities (article here). Now, with ETFs veering away from tracking indexes and sectors while allowing “fund managers,” we openly wonder what the difference between an ETF and the product it is supposed to replace. In our opinion, the primary difference, based on SEC filings on the matter, is collecting a fee without actual ownership of an asset. Thereby rendering the small “management fee” of an ETF into super profit in comparison to the traditional mutual fund and index fund.
  •  Buyer Gullibility is the Key
    • The periodic boom in closed-end mutual-fund issuance is a useful barometer of market sentiment; new issues abound when investors are optimistic and markets are rising. Wall Street firms after all do not force investors to buy these funds. They simply stand ready to issue a virtually limitless supply since the only real constraint is the gullibility of the buyers.” (page 24)
        • Thankfully, none of the products that are consumed by the retail investor are done forcibly. However, this goes back to the idea that Klarman mentions about avoiding market fads in the introduction of his book…“The important point is not merely that junk bonds were flawed (although they certainly were) but that investors must learn from this very avoidable debacle to escape the next enticing market fad that will inevitably come along (page xvii). All too often, investors ignore history which often reveals how easily a fad can take off. In the following quote, Klarman implies that a good rule of thumb on determining what a market fad is based on how long the product has been in existence, “Although newly issued junk bonds were a 1980s invention and were thus untested over a full economic cycle, they became widely accepted as a financial innovation of great importance…” (page 14). We would add to that rule of thumb by including that the more removed from actual ownership the less incentive there is to invest.
  •  Up Front Fees lead to Short-Term Focus
    • Brokers, traders, and investment bankers all find it hard to look beyond the next transaction when the current one is so lucrative regardless of merit.” (page 24)
        • The concept of market share often leads to the belief that the other firm is going to eat your lunch. This ignores the fact that the other firm isn’t using a qualitative standard for entering into such transactions. This leads to all firms chasing any opportunity for a fee at the expense of the company, the industry and the customers.
  •  A Bullish Bias Forgets Risk
    • …with so much attention being paid to the upside, it is easy to lose sight of the risk.” (page 26)
        • In our approach to any investment that is made, the priority is always on the likelihood of loss. The focus on loss requires the expectation that an investment will decline in value and having a reasonable strategy in place to deal with such scenarios before the investment is made. This makes our Investment Observations seem less enthusiastic as compared to someone who might think that a particular stock is reasonably undervalued.
  •  Declines must be orderly, increases can run amuk
    • Any downturn, according to the regulatory mentality [government regulators], should be free of panic. (Disorderly rising markets are of no evident concern)” (page 26).
        • This is best demonstrated when circuit breakers were introduced for the New York Stock Exchange after the crash of 1987. In an ironic twist, circuit breakers were never triggered based on downside movement of the NYSE in the period from 2007 to 2009. So much for the effort to protect investors with circuit breakers. Another example of regulator bias against the downside is the requirement and/or effort to reintroduce the uptick rule for short sellers without a commensurate downtick rule for investors going long a stock.
  •  Undervalued conditions get resolved, Overvalued conditions can persist
    • Correcting a market overvaluation is more difficult than remedying an undervalued condition. With an undervalued stock, for example, a value investor can purchase more and more shares until control is achieved or, better still, until the entire company is owned at a bargain price. If the value assessment was accurate, this is an attractive outcome for the investor. By contrast, overvalued markets are not easily corrected; short selling, as mentioned earlier, is not an effective antidote. In addition, overvaluation is not always apparent to investors, analysts, or managements. Since security prices reflect investors’ perceptions of reality and not necessarily reality itself, overvaluation may persist for a long time”(page 28).
        • This paragraph is the singular reason not to utilize the momentum investor’s approach of buying stocks that have made new highs. This is the method CNBC’s Cramer or Investor Business Daily’s William O’Neil tend to espouse. Whenever we seek out stocks at or near a new low, we’re trying to verify if the fundamentals of the company coincide with the price action of the stock.
  •  Always opt for the conservative estimate
    • The fad becomes dangerous, however, when share prices reach levels that are not supported by the conservatively appraised values of the underlying business” (page 34).
        • In our opinion, conservative estimates, as they relate to a stock at a new 52-week high is always lower. For a stock within 10% or 15% of the high, the high is the upside limit with expectations of a downside target. For a stock at a new low, our conservative expectation is 10% to 15% higher with a target at the next lowest technical level. If the stock is 10% or 15% above the low then we conservatively expect a possible 10% increase with the downside at least to the new low level. The same could be said for expectations for any of the fundamental attributes of a company. However, we tend to use the next lowest full year figures available or worst case figures that are not in the negative. This is the way to conservatively consider the prospects of any company at the same time always mindful of the risk of loss regardless of our confidence in our conservatism.
Please revisit New Low Observer for edits and revisions to this post. Email us.

Applied Material Analysis on the Mark

On March 23rd of this year we went into detail with our individual analysis of Applied Material (AMAT) in an article titled “Research Request: Applied Material (AMAT).” At the time, Applied Material (AMAT) was trading at $13.24. In a section of the article titled “So What Would We Do?” we outlined our investment strategy on Applied Material.
Although we didn’t think that Applied Material (AMAT) was a “buy” at the time, we did give steps on how to go about buying the stock. The last paragraph of the article said the following:
“For anyone who believes that this is an opportunity that can't be missed, I recommend allocating 15% of your portfolio into this name. On top of that, do a two part purchase. First buy 7.5% now and if the shares fall another 20% buy the remaining 7.5% later. This way, the cost basis of the stock would require only a 10% rise to break even. Again, it is not likely that we'll buy AMAT since the alternatives provide exceptional opportunity with less downside risk.”
Based on the two-part purchase strategy that we mentioned, the average purchase price would have been $11.92. The gain for the stock would be 17.45% so far. Had only one purchase been made based on a decline of 20% from the $13.24 level, the total gain would be 32.20%.

We hope that our work on this topic has proven to be profitable for those who regularly read our site.  For those who have taken advantage of this investment opportunity, please re-read our March 22nd and March 23rd postings for indicated upside resistance levels and potential exit points.

Please revisit New Low Observer for edits and revisions to this post. Email us.

Wrong Time to Recommend Stocks Proves to be Correct

In an article that we wrote in January of this year, titled “Wrong Time For Recommendations,” we commented that the stocks suggested by TheStreet.com for potential investments were reckless at best. The companies that were on the list of TheStreet.com’s “Five Small Cap Stocks to Own Now" and their performance are found below.

Company Symbol 21-Jan-10 23-Dec-10
Change
InterOil IOC $79.05 $72.95
-7.72%
Sharps Compliance SMED $9.48 $4.47
-52.85%
China Green Agriculture CGA $14.9
$9.44
-36.64%
Sourcefire FIRE $22.84 $24.85
8.80%
Hi-Tech Pharmacal HITK $23.94 $25.03
4.55%
Average Return
-16.77%
With less than a month to go before a full year has passed since our original article was published, there does exist the possibility these companies can still provide close to the market return (due to their highly volatile nature.) However, we still believe that any widely followed website like TheStreet.com should not recommend stocks that have risen a minimum of 300% as potential purchase candidates.  We felt, and still feel, that “it is irresponsible to tell investors that they should buy something that outperformed the market by 15 times.”
As the New Year approaches, be wary of stock recommendations of companies that have significantly outperformed the market in the previous year. Such recommendations will result in below market returns.
Please revisit New Low Observer for edits and revisions to this post. Email us.

ConAgra Counterpoint

We love corporate news that is bad. There are few times when anything can be learned through good news, at least not as much as what can be learned with “bad” news.
Recently there was an article titled “Nothing Appetizing About ConAgra” published on Investopedia.com that was unrelenting in the bad news regarding the future prospects of our recent Investment Observation on the same company. So thorough, and yet concise, was the article that we feel it is a must read.
Along with all the negative prospects for ConAgra, there was one morsel of information which happens to confirm our view of what ConAgra might be worth. In the sixth paragraph of the article, it says the following:
Assuming that private equity buyers could wring some efficiencies and cost savings from this business, a deal worth $28 to $30 could be achievable.”
In our Investment Observation of ConAgra (CAG) dated December 1, 2010, we indicated that using several different approaches, we were able to arrive at a “fair value” of $30. All things cannot go our way with our investment recommendations, so if we were to assume the stock to rise at least to the midpoint between the current price of $22.40 and the expected fair value of $30, then we’d get a gain of 17%. Despite having opposite views on the prospects for the company, there is common ground as to the possible valuation of the company.
We’re reticent to believe that taking the company private, which will then lead to taking the company public at some point down the road, will truly cure what ails ConAgra (CAG). In fact, the history of private equity, from one man's perspective, has been abysmal for companies ensnared in such transactions. The recent book by Josh Kosman titled The Buyout of America details the history of such deals and the subsequent impact on the respective company and their employees.
As we’ve shown in the example of Wilmington Trust (WL), market analyst estimates, including our own, can be usurped by realities beyond our purview. Therefore, despite our take on the prospects for this company, we still recommend “Nothing Appetizing About ConAgra.” It provides the right antidote to our recommendation to consider ConAgra (CAG) as a possible investment candidate.

Please revisit New Low Observer for edits and revisions to this post. Email us.

Sell ExxonMobil (XOM) at the Market

It is now time to recommend that ExxonMobil (XOM) be sold at the market. The stock has performed modestly since the Investment Observation was issued on January 25, 2010. It is highly recommended that anyone who bought the stock based on our insight should re-read the posting. Shortly after our recommendation, XOM fell 15% before heading higher.

In the pursuit of "seeking fair profits" the returns that this stock has provided within the last 333 days say that it is necessary to consider alternative opportunities. The key to investment success and a key principle of economics is to seek the best alternatives.

ExxonMobil (XOM) was recommended when it closed at $65.90 on January 25th. Based on yesterday's closing price of $72.80, XOM has gained 10.47%. If we include reinvested dividends then the gain was 14.84%.

In our observation of the stock on January 25th we were specific in how long the shares might decline and by what percentage we expected the stock to fall further. We said the following:

“…based on the prior Coppock Curve indications, XOM is expected to remain unchanged or fall for another three to six months by about 11% to 18%.”

Five months later, ExxonMobil reached the final bottom on July 2nd at a price of $55.94. As mentioned before, this was a decline of 15% from date of the Investment Observation.

In addition to giving a specific time frame for where the stock would go, we gave a strategy for if you wanted to buy the stock at the January 25th price. The strategy that we outline said the following:

If we were to invest in stocks the way that Charles H. Dow would then we would buy half of the intended amount now and purchase the second half if the price declines. For example, let's say that you wanted to invest $13,180 in this company. What you would do is buy $6,590 worth of stock now (approximately 100 shares) and hold the stock if the price goes up. If the stock goes down then you would invest the remaining $6,590 at the next level that you felt was ideal. This approach works well regardless of the market that you're in as long as you set aside the amount that you intend to invest before making the first purchase. Also, after making the first investment never invest the second half somewhere else.”

Based on the quality of the observation and a strategy for the investment, readers of this site should have gains that exceed our worst case scenario gain of 14%.  The maximum possible gain on this position, including dividends, is 30.42%.  We hope that there are those who took advantage of this opportunity. 

The annualized return on this position would be close to 14.84% assuming that only purchase was made at the time of the initial Investment Observation. Selling this stock now generates a return of 5.56x greater than the amount of the dividend yield if held for a full year. Additionally, the 14.84% gain exceeds the return on a 30-year treasury purchased on January 25, 2010 by 3.25x.

Those not interested in following through with our sell recommendation can feel comfortable knowing that XOM is a great long-term holding with a 14.84% downside cushion since our investment observation. As the price of XOM rises, it should be noted that the stock faces significant upside resistance at $75, $80 and $95.

As we have indicated in the purposes and function of this site, our goal is to:
  • Maximize the annual yield of each trade.
  • Reduce the time between buying and selling of each stock.
  • Exceed the annual yield of government guaranteed alternatives in each trade.
Investment observations are intended to be a starting point for investigating a quality company at a reasonable price. It is hoped that after doing the background research you can buy the stock at a lower price. Ideally the stock should be held in a tax-deferred account and should not consist of less than 20% of your holdings. Personally, we prefer holding only 2-3 stocks at a time.

For a portfolio of $10,000 with a 20% position that gains 14.84%, the impact on the entire portfolio is a little over 2%. This is contrasted with the same portfolio with a 5% position that gains 14.84%, the impact on the entire portfolio is slightly over half a percent (0.50). By choosing conservative dividend increasing stocks at or near a new low, the odds of success are increased in your favor making the assumed increase in risk worthwhile.

Sell recommendations are intended to deal with the short-term reality of the market. The tracking of the Sell recommendations are the worst case scenario if you happen to have bought a stock at the time the Investment Observation was made (please avoid making this mistake.) We aim for modest but consistent returns, therefore we are happy with 9-12% annual gains.

It is always recommended that when selling a stock, one should not place stop orders, limit orders or orders after hours as detailed in our article "Automatic Orders Don't Provide Protection." This leaves the seller in the position of being vulnerable to the whims of the market makers. Instead, place your sell orders only as a market order during market hours. Some would complain that a market order during market hours might leave some profits on the table. However, we would rather leave some money on the table rather than have it taken away from us by the trades that are placed by institutions and market makers.

Please revisit New Low Observer for edits and revisions to this post. Email us.

NLO Dividend Watch List

Watch List Summary

This week's list contains 10 companies that are concentrated in the drug, household goods and food sector of the economy.  In addition, eight of the 10 companies have market caps of over $8 billion. Topping this list is a popular household name, Clorox (CLX). ConAgra (CAG) is one of our favorite names right now and we're reiterating that anyone interested in the stock to revisit our write up on it. Our latest Investment Observation was on Eli Lilly (LLY), a major pharmaceutical company. LLY is the 7th company on our list this week.

December 17, 2010 Watch List

Symbol Name Price % Yr Low P/E EPS Dividend Yield Payout Ratio
CLX Clorox Co. 62.54 6.07% 13.42 4.66 2.20 3.52% 47%
TCB TCF Financial Corp. 13.77 6.74% 13.77 1.00 0.20 1.45% 20%
CAG ConAgra Foods, Inc. 22.49 6.99% 14.32 1.57 0.92 4.09% 59%
KMB Kimberly-Clark Corp. 62.74 7.71% 14.19 4.42 2.64 4.21% 60%
ABT Abbott Laboratories 48.40 8.54% 15.97 3.03 1.76 3.64% 58%
SYY Sysco Corp. 29.30 8.60% 15.10 1.94 1.04 3.55% 54%
LLY Eli Lilly & Co. 35.01 9.34% 8.03 4.36 1.96 5.60% 45%
JNJ Johnson & Johnson   62.54 9.99% 12.84 4.87 2.16 3.45% 44%
CL Colgate-Palmolive Co. 81.00 10.78% 18.93 4.28 2.12 2.62% 50%
WFSL Washington Federal, Inc.  15.50 10.95% 14.76 1.05 0.20 1.29% 19%
10 Companies


Top Five Performance Review

In our ongoing review of the NLO Dividend Watch List, we have taken the top five stocks on our list from December 18, 2009 and have checked their performance one year later. The top five companies on that list can be seen in the table below.

Name Symbol 2009 Price 2010 Price % change
SUPERVALU INC SVU 12.48 8.76 -29.81%
CALIFORNIA WATER CWT 36.66 38.38 4.69%
EXXON MOBIL CP XOM 68.21 72.17 5.81%
AQUA AMERICA INC WTR 17.29 22.21 28.46%
UMB Financial Corp. UMBF 37.94 41.43 9.20%


Average 3.67%


Dow Jones Industrial DJI 10,328.89 11,491.91 11.26%
S&P 500 SPX 1,102.47 1,243.91 12.83%

This week, our top five didn't come close to the Dow Jones Industrial Average and the S&P 500. While we can't defend the long-term viability of Supervalu (SVU) at this time, we can point to the fact that SVU rose almost 40% in just 3 months after being on the December 18, 2009 list. We also issued an Investment Observation on this stock on January 6, 2010 when SuperValu (SVU) was trading just below $13. After holding the shares for 9 days, we issued a Sell Recommendation on January 15, 2010 which provided us with a 10% gain for an annualized return of nearly 400%.

It should be noted that three of the five stocks achieved 10% gains within 7 months after being on the list December 18, 2009 watch list.  SuperValu (SVU) accomplished 10% on January 12th (125% annualized), UMB Financial (UMBF) accomplished 10% on January 20th (nearly 96% annualized) and AquaAmerica (WTR) achieved 10% on July 21st (nearly 15% annualized). 

As mentioned with every sell recommendation, our goal is to maximize the annual yield of each trade so if we can obtain a 10% gain in less than a year (the approximate historical annual market return) then we are satisfied. Those who wish to hold for the "long-term" may also benefit from our method of buying quality dividend paying stocks near a new low.

Disclaimer
On our current list, we excluded companies that have no earnings. Stocks that appear on our watch lists are not recommendations to buy. Instead, they are the starting point for doing your research and determining the best company to buy. Ideally, a stock that is purchased from this list is done after a considerable decline in the price and extensive due diligence. We suggest that readers use the March 2009 low (or the companies' most distressed level in the last 2 years) as the downside projection for investing. Our view is to embrace the worse case scenario prior to investing. A minimum of 50% decline or the November 2008 to March 2009 low, whichever is lower, would fit that description. It is important to place these companies on your own watch list so that when the opportunity arises, you can purchase them with a greater margin of safety. It is our expectation that, at the most, only 1/3 of the companies that are part of our list will outperform the market over a one-year period.

Please revisit New Low Observer for edits and revisions to this post. Email us.