
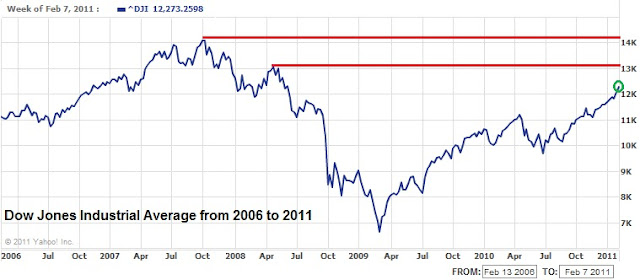
The market rallied strong and finish the week on a positive note. We can't help but feel bullish going into next week after the S&P 500 worked its way passed the 1,304.28 mark prior to March 11 (when the earthquake struck Japan). We will have to wait and see if the market can continue its upward momentum and give us another Dow Theory re-confirmation of the cyclical bull market within a secular bear market.
March 25, 2011 Watch List
Our watch list this week contains 28 companies that are within 11% of their 52-week low.
| Symbol | Name | Price | % Yr Low | P/E | EPS (ttm) | Dividend | Yield | Payout Ratio |
| SJW | SJW Corp. | 22.65 | 1.80% | 17.42 | 1.30 | 0.69 | 3.05% | 53% |
| SYY | Sysco Corp. | 27.86 | 2.69% | 14.36 | 1.94 | 1.04 | 3.73% | 54% |
| WABC | Westamerica BanCorp. | 50.13 | 2.94% | 15.62 | 3.21 | 1.44 | 2.87% | 45% |
| PPL | PP&L Corporation | 24.57 | 3.45% | 11.38 | 2.16 | 1.40 | 5.70% | 65% |
| TGT | Target Corp. | 49.95 | 3.57% | 12.49 | 4.00 | 1.00 | 2.00% | 25% |
| JNJ | Johnson & Johnson | 58.98 | 3.73% | 12.34 | 4.78 | 2.16 | 3.66% | 45% |
| HCBK | Hudson City Bancorp, Inc. | 9.87 | 3.79% | 9.06 | 1.09 | 0.60 | 6.08% | 55% |
| MCY | Mercury General Corp. | 38.83 | 4.13% | 13.97 | 2.78 | 2.40 | 6.18% | 86% |
| CHFC | Chemical Financial Corp. | 19.62 | 4.42% | 22.30 | 0.88 | 0.80 | 4.08% | 91% |
| PEP | PepsiCo Inc. | 63.98 | 6.07% | 16.32 | 3.92 | 1.92 | 3.00% | 49% |
| MRK | Merck & Co., Inc | 32.57 | 6.09% | 116.32 | 0.28 | 1.52 | 4.67% | 543% |
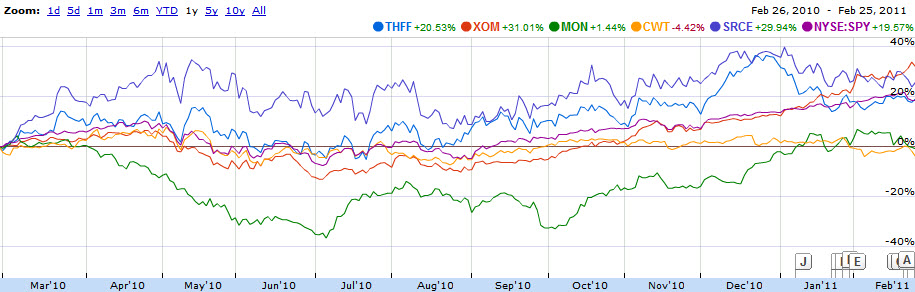
| CWT | California Water Service | 36.1 | 6.77% | 19.94 | 1.81 | 1.23 | 3.41% | 68% |
| HGIC | Harleysville Group Inc. | 32.37 | 6.80% | 13.38 | 2.42 | 1.44 | 4.45% | 60% |
| TRH | Transatlantic Holdings, Inc. | 47.41 | 7.55% | 7.66 | 6.19 | 0.84 | 1.77% | 14% |
| LLY | Eli Lilly & Co. | 34.48 | 7.68% | 7.53 | 4.58 | 1.96 | 5.68% | 43% |
| ABT | Abbott Laboratories | 48.03 | 7.71% | 16.23 | 2.96 | 1.92 | 4.00% | 65% |
| BMI | Badger Meter, Inc. | 39.65 | 8.81% | 20.76 | 1.91 | 0.56 | 1.41% | 29% |
| PRK | Park National Corp. | 64.37 | 8.92% | 14.27 | 4.51 | 3.76 | 5.84% | 83% |
| KMB | Kimberly-Clark Corp. | 65.1 | 9.28% | 14.63 | 4.45 | 2.80 | 4.30% | 63% |
| AWR | American States Water Co. | 34.16 | 9.35% | 19.30 | 1.77 | 1.04 | 3.04% | 59% |
| WMT | Wal-Mart Stores, Inc. | 52.35 | 9.59% | 11.74 | 4.46 | 1.46 | 2.79% | 33% |
| CL | Colgate-Palmolive Co. | 80.15 | 9.61% | 18.60 | 4.31 | 2.32 | 2.89% | 54% |
| AVP | Avon Products, Inc. | 27.43 | 9.72% | 19.73 | 1.39 | 0.92 | 3.35% | 66% |
| VLY | Valley National BanCorp. | 13.55 | 9.89% | 16.73 | 0.81 | 0.72 | 5.31% | 89% |
| NWN | Northwest Natural Gas Co. | 46.07 | 9.95% | 16.88 | 2.73 | 1.74 | 3.78% | 64% |
| BOH | Bank of Hawaii Corp. | 47.25 | 10.04% | 12.43 | 3.80 | 1.80 | 3.81% | 47% |
| WEYS | Weyco Group, Inc. | 24.59 | 10.32% | 21.38 | 1.15 | 0.64 | 2.60% | 56% |
| RLI | RLI Corp. | 56.39 | 10.87% | 9.40 | 6.00 | 1.16 | 2.06% | 19% |
| 28 Companies | ||||||||
Watch List Summary
On the top of our list this week is San Jose, CA-based water utility SJW Corp. (SJW). The stock has been under pressure this week. The current yield of 6% is attractive but with nearly $30B of debt and only $650M of cash on hand, it may not be worth the risk/reward.
Target (TGT) is another name with tremendous upside potential gauging by the relative dividend yield establish by IQTrend. Historically, shares are undervalue at 1% yield. With the stock trading nearly 2%, it has the potential to double, all else being equal.
Another name we'd like to highlight is Abbott Lab (ABT). We go back to our 2009 analysis of the company and find some interesting qualitative changes. The stock was trading at 3.4% yield and roughly $47. Today, with a price of $48, ABT would yield 4%. We see that the stock offers more value at $48 than at $47.
Top Five Performance Review
In our ongoing review of the NLO Dividend Watch List, we have taken the top five stocks on our list from March 26, 2010 and have checked their performance one year later. The top five companies on that list can be seen in the table below.
| Symbol | Name | 2010 Price | 2011 Price | % change |
| XOM | Exxon Mobil Corp. | 66.54 | 83.62 | 25.67% |
| FPL* | FPL Group, Inc. | 47.81 | 54.10 | 13.16% |
| MON | Monsanto Co. | 71.10 | 70.76 | -0.48% |
| TMP | Tompkins Financial Corp. | 37.75 | 41.34 | 9.51% |
| BRO | Brown & Brown, Inc. | 17.81 | 25.09 | 40.88% |
| Average | 17.75% | |||
| DJI | Dow Jones Industrial | 10,850.36 | 12,220.59 | 12.63% |
| SPX | S&P 500 | 1,166.59 | 1,313.80 | 12.62% |
*FPL is now NEE

The performance of our top five stocks topped the overall market by 5%. Thanks to two key performer, Exxon (XOM) and Brown & Brown (BRO).
Disclaimer
On our current list, we excluded companies that have no earnings. Stocks that appear on our watch lists are not recommendations to buy. Instead, they are the starting point for doing your research and determining the best company to buy. Ideally, a stock that is purchased from this list is done after a considerable decline in the price and extensive due diligence. We suggest that readers use the March 2009 low (or the companies' most distressed level in the last 2 years) as the downside projection for investing. Our view is to embrace the worse case scenario prior to investing. A minimum of 50% decline or the November 2008 to March 2009 low, whichever is lower, would fit that description. It is important to place these companies on your own watch list so that when the opportunity arises, you can purchase them with a greater margin of safety. It is our expectation that, at the most, only 1/3 of the companies that are part of our list will outperform the market over a one-year period.


