Cree (CREE): One Year After

It's been one year since we wrote about high-flying and high-multiple stock, Cree (CREE). At the time of our first article, Cree was untouchable at 60x trailing earnings. Our take on the stock was not well received based on the commentaries in the article on SeekingAlpha - "Cree Inc. Is Overpriced." While it was too short to take any credit for our view in June, our follow up work in August seemed even more controversial to many. One comment by a reader of our article on Cree even went so far as to offer us an alternative strategy. The reader said:

"My recommendation to your readers would be to buy Cree as if you were buying Google in 2002-03. Short Veeco (VECO) and Aixtron (AIXG) against them if you want to be net neutral the sector."

As reflected in the chart below, anyone who followed the reader's strategy would have gotten crushed as Cree fell -51%, Veeco rost +31% and Aixtron jumped +25%.

In our previous articles, we expressed the view that multiples were going to contract as competition heated up. One year later, a recent report from Bloomberg on LEDs suggested that price will "plummet" by 2015 reconfirming our thesis. But let's back up and dig into the fundamental numbers and see what we can learn.

Back in June 2010, the consensus of analysts had predicted that Cree would earn somewhere between $0.66 to $1.68. However, Cree ended up earning $1.71, beating the highest estimate. The 2011 estimates in June 2010 were even more bullish. The earnings estimates ranged from $1.68 to $2.30. Since then, that range has tighten considerably. Analysts now expect Cree to earn anywhere from $1.66 to $1.78. Even more outrageous was a commenter's prediction of Cree earning $4.50.

The chart below depicts a graphic picture of the stock's fundamental and price collapse. How can we explain this phenomenon? We're not quite sure. But based on many news feeds about the price of LEDs falling, companies entering the space, and bullish comments on Cree, it was apparent to us that it should be something investors needed to avoid. The risk/reward profile wasn't going to be good from our assessment.

Cree Price Stock Chart

Now that the price of this stock has fallen by 50%, what's the next move? At this point, any investor interested in buying Cree should start running the numbers. The stock's risk/reward profile has reversed course and it may be worth considering. The P/E is now at 20x, which is very close to its historical low of 18. Many analysts have turned bearish on the shares (46% have either hold, sell, or underperformed). Some analysts even expect Cree earnings to fall to $1.61 in 2012.

Despite many of the negative concerns, Cree carries no debt and typically has very strong free-cash flow. The book value continued to rise during the price collapse. As a result, Cree is now trading at 1.67x book, almost as low as the 2009 low (around 1.19x book). A technology company with great IP such as Cree could easily get taken out at 2x book value. Its competitor Toyoda Gosei (TGOSY.PK) currently trades at 2x book.

It appears that our view on Cree has come full circle. This company makes great products but in our view was a bad investment one year ago. Now that everyone appears to be against the company, we can no longer ignore the value attributes of Cree. Although we believe that there is still some downside risk, we recommend considering this stock's compelling fundamental attributes for your next technology stock investment.

References:
It's a Matter of Economics, Cree is Overpriced (6/3/10) - New Low
LED's Bright Prospects Could Dim (6/3/2010) - MarketWatch
From Macro to Micro, Cree Follow Up (8/11/10) - New Low
LED Lighting Prices to ‘Plummet’ By 2015, VantagePoint Says (6/16/11) - Bloomberg
Please consider donating to the New Low Observer. Thank you.

Biogen Management Should Provide Proper Sell Signal

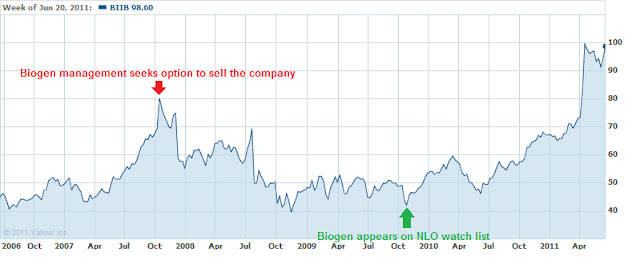
In recent articles we’ve noted that, based on the price action, Biogen Idec (BIIB) is worthy of selling. Biogen continues to register new highs after first showing up on our Nasdaq 100 watch list on October 30, 2009. The performance of Biogen Idec since October 2009 has been over 135%.

It is worth noting that the last time Biogen (BIIB) was at a high on October 15, 2007, the board of directors approved a plan to put the company up for sale. Biogen retained Goldman Sachs and Merrill Lynch to act as advisors for any eventual deal. The announcement of the intent to sale the company came after-hours on Friday October 12, 2007. After-hour trading of Biogen stock pushed the price up over 18% resulting in the high for the stock the following Monday.

Our interpretation of management’s desire to sell “at the top” in 2007 reflects that they didn’t expect the price to go much higher and with a market that had plenty of liquidity the best option would be to seek alternatives. The management of Biogen was accurate in their choice and timing. Biogen stock fell by over 50% after the announcement of the sale of the company.

For current holders of Biogen stock, we’d be paying close attention to the management team for indications of a merger or sale of the company. Any indication of managment "cashing out" should provide ample insider information about the expectations going forward.

Source:
Bowe, Christopher, and James Politi. "Biogen shares soar as group considers sale." Financial Times. Saturday October 13, 2007.

 
Please consider donating to the New Low Observer. Thank you.

In the News: June 18, 2011

Please consider donating to the New Low Observer. Thank you.

Nasdaq 100 Watch List: June 17, 2011

Below are the Nasdaq 100 companies that are within 20% of the 52-week low. This list is strictly for the purpose of researching whether or not the companies have viable business models. Although these companies are very risky, they provide significant opportunity to outperform the market in the coming year.
Symbol Name Trade P/E EPS Yield P/B % from low
URBN Urban Outfitters, Inc. 28.27 18.53 1.53 0.00% 3.44 0.60%
MRVL Marvell Technology 13.79 10.92 1.26 0.00% 1.72 0.95%
CSCO Cisco Systems, Inc. 15.05 11.75 1.28 1.60% 1.76 1.83%
RIMM Research In Motion 35.33 5.57 6.34 0.00% 2.06 1.90%
SPLS Staples, Inc. 15.05 12.23 1.23 2.70% 1.48 2.03%
AKAM Akamai Technologies 29.47 31.19 0.95 0.00% 2.49 2.72%
MSFT Microsoft 24.00 9.53 2.52 2.70% 3.78 5.57%
BRCM Broadcom 31.77 16.03 1.98 1.10% 2.95 6.25%
TEVA Teva Pharmaceutical 47.76 12.84 3.72 1.60% 1.85 6.46%
FSLR First Solar, Inc. 118.83 16.96 7.01 0.00% 2.87 6.67%
ATVI Activision Blizzard, Inc 11.10 25.69 0.43 1.50% 1.25 7.56%
INFY Infosys Technologies 61.64 23.53 2.62 1.40% 5.75 8.66%
QGEN Qiagen N.V. 19.16 33.03 0.58 0.00% 1.77 13.64%
YHOO Yahoo! Inc. 14.78 17.36 0.85 0.00% 1.5 14.18%
GOOG Google Inc. 500.37 19.43 25.75 0.00% 3.3 15.39%
AMGN Amgen Inc. 58.34 12.13 4.81 0.00% 2.18 16.08%
LLTC Linear Technology 31.51 13.36 2.36 3.00% 18.15 16.57%
PCAR PACCAR Inc. 46.12 29.01 1.59 1.00% 2.98 19.48%

 Watch List Performance Review

The performance of our watch list after one year is to remind us of the possible outcome of investing in the stocks on our list.  It is hoped that we can gain greater insight in the investing process and refine that process as we go along. 
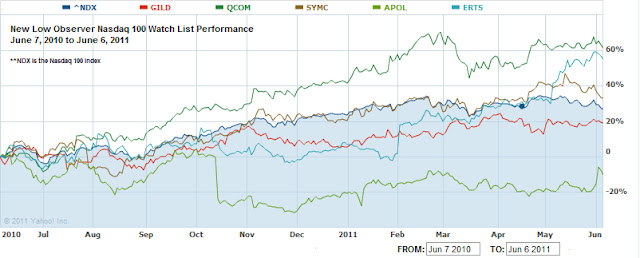
Below is the performance of the top five stocks on our Nasdaq 100 watch list from June 6, 2010 of last year.
Symbol Name 2010 2011 % change
GILD Gilead Sciences, Inc. 34.71 40.91 17.86%
SYMC Symantec Corporation 13.92 18.44 32.47%
ERTS Electronic Arts Inc. 15.81 23.8 50.54%
APOL Apollo Group, Inc. 51.48 44.71 -13.15%
QCOM QUALCOMM 35.3 56.48 60.00%
Average 29.54%
^NDX Nasdaq 100 1832.04 2274.48 24.15%

As a group, the top five from our list last year did fairly well by exceeding the index by more than 5%.  The only stock to decline was Apollo (APOL). Qualcomm (QCOM) was clearly the standout in the performance ranking of our watch list.  Likewise, Electronic Arts (ERTS) managed to crank out returns just north of 50% in the last year. 
It is important to note that, at the time, these stocks were not favored very highly in terms of expected growth of the stock price.  In fact, as our watch list was being posted in June 2010, many Wall Street analysts were actively downgrading these stocks.  Considering that the entire list from last year gained an average return of 21.51%, the outcome was quite reasonable.
    
Please consider donating to the New Low Observer. Thank you.

Transatlantic Holdings (TRH) Is Making Waves

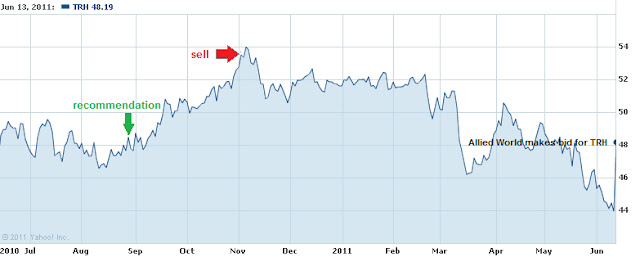
On August 27, 2010, we recommended that investors consider the purchase of Transatlantic Holdings (TRH). In our assessment of TRH, we felt that the stock had a good chance of rising to $67 within 3 years. On the extreme end of overvaluation, we felt that Transatlantic Holdings (TRH) could be worth between $84 and $162. In the same article we said the following:
“…our investment strategy requires that if we get a 10% gain in less than a year in a tax-deferred account then we’re considering the next best investment alternative.”
Our aversion to excessive gains had paid off. On November 2, 2010 we recommended that holders of Transatlantic Holdings (TRH) sell their shares with a gain of 10.78% in approximately 68 days. As demonstrated in the chart below, such a recommendation came within two days of the high for the last year. After our recommendation to sell, TRH fell from $53.52 to $44.00 in the following 7 months.
Now, Transatlantic Holdings (TRH) is in the cross hairs of Allied World Holdings (AWH). With TRH selling comfortably below book value and AWH’s takeover offer also coming in below book value there is serious opportunity for TRH to move considerably higher. TRH sports a book value that is estimated between $66 and $79 per share depending on the source you chose. With the battle for the company that is expected to come over TRH, we can expect that if a merger or takeover does occur it should start at the $66 level which is in stark contrast to Allied World Holdings' offer of $51.50.
As soon as the deal was announced, Transatlantic’s largest shareholder, Davis Selected Advisors LP, indicated that they might oppose the deal because they believe that the $51.50 offer is too low (Bloomberg article here). Not far behind Davis Advisors, Tweedy Browne Co. has said that they’re also against a merger that prices TRH below book value (Bloomberg article here).
Our most recent Dividend Watch List (June 12, 2011) made specific reference to Transatlantic Holdings as a potential investment opportunity. We believe that as the market goes through its corrective phase, purchases of TRH, a company that has increased the dividend for over 20 years in a row, would be reasonably rewarded.
Please consider donating to the New Low Observer. Thank you.

Monsanto (MON) Chart: 1929 to 1937

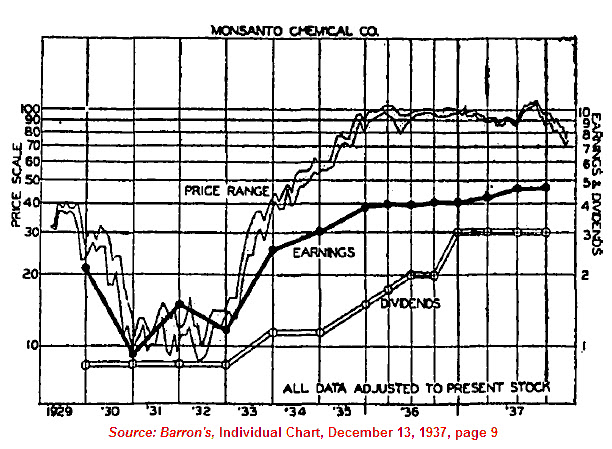
Below is an excerpt from a 1937 issue of Barron’s showing the price history of Monsanto (MON) from 1929 to 1937. The high price set in 1929 at $40 was marked down over 75% in 1932. Subsequent price movement brought the stock of Monsanto back to the 1929 high by the end of year 1933. By late 1935, Monsanto (MON) was just short of $100 a share.
We’re not totally clear about the specific dynamics that allowed for the price rise of MON at the market bottom. However, prior experience with the market decline from 2007 to 2009 and research of markets like 1837, 1857, 1866, 1873, 1884, 1893, 1907, 1929 and 1973 has shown us that the reaction to the devastating forces of stock price deflation is nearly equal in magnitude and timing.
We found this chart in line with our previous articles titled “Dow Jones’ Decline Largely Impacted by Index Changes” and “After the Crash, Recovery was Faster Than Most People Think” on the topic that the decline and recovery of many stocks was much quicker than most would imagine after 1929. In the case of Monsanto, the stock is shown to have recovered much quicker than previously indicated.

Richard Russell Review: Wrong About the Industrial Production Index

On June 6th, Richard Russell wrote an article on the Financial Sense website titled “Are We Fated to Live 1929-1930 All Over Again?” In that article, Russell discussed the Barron’s Monthly Index of Physical Volume of Industrial Production [BMIPVIP] reflecting on the movements of the index as compared to the Dow Jones Industrial Average in the period from the peak of the stock market in 1929 to the bottom in 1932.

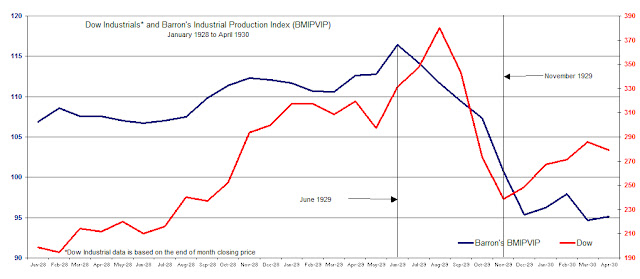
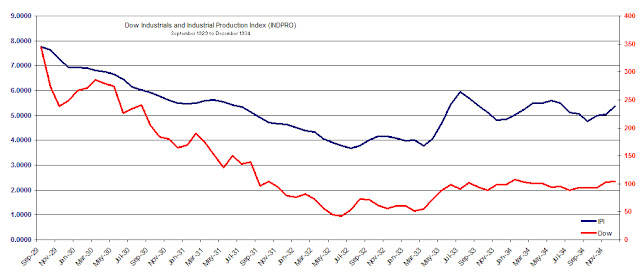
Richard Russell pointed out that from November 1929 Barron’s Monthly Index of Physical Volume of Industrial Production [BMIPVIP] gave ample warning that the direction of the U.S. economy was still headed lower despite the rebound of the Dow Jones Industrial Average from November 1929 to April 1930 as depicted in the chart below.

Source: Persons, Warren. Barron's. May 15, 1933; pg. 18
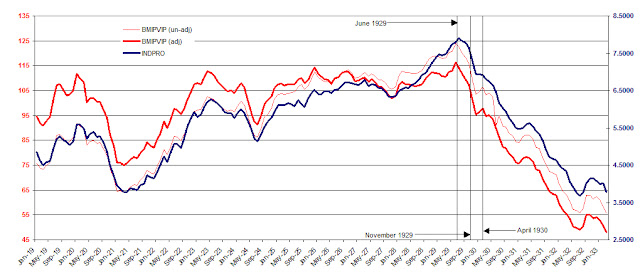
Because the BMIPVIP was discontinued in 1938, we’ve used the closest approximation which is the Federal Reserve’s Industrial Production Index (INDPRO) found at the St. Louis Federal Reserve website.  In order to make a comparison to the two indexes, we checked the performance of the INDPRO to the BMIPVIP.  Below is the chart of the Barron’s adjusted and unadjusted BMIPVIP index and the Federal Reserve’s INDPRO from 1919 to 1933.

 It can clearly be seen that the Federal Reserve’s index (INDPRO), which is still in use today, can be used to measure against the Dow Jones Industrial Average.  Whenever the Barron’s index zigged the Fed’s index zigged, whenever the Barron’s index zagged so too did the Fed’s index.  We believe that using the Fed’s Industrial Production Index is the best and most consistent approximation to compare to 1929 to 1934 (shown below) as well as today’s market.

source: Person, Warren. Barron's. May 15, 1933. pg. 18.


According to Russell, the BMIPVIP hit its high in the month of June 1929.  This was a full 3 months before the peak in the Dow Industrials in September 1929.  The Federal Reserve index actually peak in July 1929 however, this was still ample enough time to gain inferences from the index’s movement.

Russell correctly observed that the BMIPVIP was critical in the evaluation of whether or not the economy and the stock market were on a rebound.  The great Dow Theorist Robert Rhea first introduced the use of Barron’s Industrial Production Index in his book Dow’s Theory Applied to Business and Banking.  Rhea used BMIPVIP as a means to confirm the signal provided by Dow Theory which contributed to his accurate call of a market bottom in July 1932.

Richard Russell’s point was that even though the stock market rallied strongly after the initial crash from the September 1929 high to the November 1929 low, the subsequent rebound was unsustainable when viewed from the perspective of the BMIPVIP or the INDPRO.  Unfortunately for Russell, his analysis of the BMIPVIP index and the Dow Jones Industrial Average comes to the wrong conclusion when attempting to bring actions of the past to market activity of the present.

Russell closes his article with the following thoughts:

“After April 1930, the post-crash rally ended, and a great bear market began. As the market turned down again, the US economy crumbled. By July 1930, Barron's Index of Industrial Activity had fallen to 85.5. The Great Depression was on.

“And I'm wondering about the comparison with today's action. Recently, we've seen the Dow climbing steadily from its March 2009 low, all the while with the economy neutral to weak. Then we see the Dow hitting a high last month in May with business today sluggish and even weaker than it was in January.

“And I'm wondering, ‘Are we fated to live 1929-1930 all over again?’ Is the stock market rally of March 2009 to May 2011 a repeat of the stock market rally of November 1929 to April 1930? In both instances, business weakened as the market climbed higher.

“But the scary part is that in 1930 when the Dow broke support, the Great Depression began and Barron's Business Index continued to plunge. Let's keep an eye on the March 2011 lows -- Dow......11613.30 and Transports ....4950.17.”

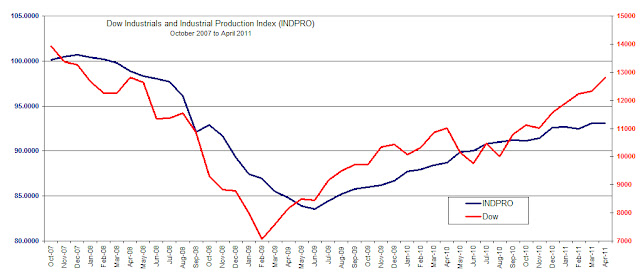
We’re disappointed that Russell’s remarks are uninformed and misleading with the intent of creating fear. First, Russell withholds the data necessary to test whether his assessment is accurate. Next, Russell implies that the Dow Industrials of today may be rising in spite of the Industrial Production Index falling. However, the Fed’s INDPRO has been in perfect alignment with the rise of the Industrial Average since 2007 as shown in the chart below.

Finally, Russell closes his article with an attempt at drawing the events of the past to the present.  Russell's effort lacks all substance when he speaks of targets for the Dow Industrials to watch for but doesn't introduce the Industrial Production Index nor it's relationship to 1929 and today. 

While the true test may come when the Dow Industrials and Industrial Production Index (INDPRO) attempt to exceed the prior high of 2007, there is little indication that Russell’s assessment is correct.

Please consider donating to the New Low Observer. Thank you.

NLO Dividend Watch List: June 10, 2011

The recent market correction has expanded our list.  Since our list grew to more than 50 companies within 11% of the low, we decided to reduce our list to 5% of the low.  Our list still produced 33 quality companies.  The following are stocks on our list that are within 6% of their 52-week low.

June 10, 2011 Watch List

Symbol Name Price % Yr Low P/E EPS (ttm) Dividend Yield Payout Ratio
WEYS Weyco Group, Inc.  22.32 -0.36% 19.41 1.15 0.64 2.87% 56%
TRH Transatlantic Holdings, Inc. 44.01 0.25% 14.38 3.06 0.88 2.00% 29%
CHFC Chemical Financial Corp.  18.13 0.33% 16.48 1.10 0.80 4.41% 73%
TGT Target Corp. 46.7 0.39% 11.42 4.09 1.20 2.57% 29%
SFNC Simmons First National Corp.  24.38 0.83% 11.34 2.15 0.76 3.12% 35%
WABC Westamerica BanCorp.  47.66 1.60% 14.99 3.18 1.44 3.02% 45%
TMP Tompkins Financial Corp. 36.58 1.81% 11.69 3.13 1.36 3.72% 43%
SJW SJW Corp. 22.32 2.01% 17.44 1.28 0.69 3.09% 54%
CMA Comerica, Inc. 33.78 2.02% 18.56 1.82 0.40 1.18% 22%
STBA S&T BanCorp., Inc.  16.98 2.04% 14.64 1.16 0.60 3.53% 52%
BRK-A Berkshire Hathaway Inc. CL 'A' 111,045 2.08% 16.87 6580.82 N/A N/A N/A
UBSI United Bankshares, Inc.  22.57 2.17% 13.60 1.66 1.20 5.32% 72%
HTLF Heartland Financial USA, Inc.  13.41 2.29% 12.53 1.07 0.40 2.98% 37%
ANAT American National Insurance 76 2.51% 12.86 5.91 3.08 4.05% 52%
HGIC Harleysville Group Inc.  31.11 2.64% 11.15 2.79 1.44 4.63% 52%
MDP Meredith Corp. 29.72 2.77% 10.43 2.85 1.02 3.43% 36%
NWN Northwest Natural Gas Co. 43.9 2.98% 16.76 2.62 1.74 3.96% 66%
NTRS Northern Trust Corp.  46.76 3.23% 17.25 2.71 1.12 2.40% 41%
GBCI Glacier BanCorp., Inc.  13.29 3.47% 22.53 0.59 0.52 3.91% 88%
SYBT S.Y. BanCorp., Inc.  23.33 3.73% 13.64 1.71 0.72 3.09% 42%
BXS BanCorp.South Inc. 12.14 4.30% 75.88 0.16 0.04 0.33% 25%
UVV Universal Corp. 37 4.64% 6.83 5.42 1.92 5.19% 35%
AVP Avon Products, Inc. 27.36 4.75% 16.89 1.62 0.92 3.36% 57%
C Citigroup Inc  37.92 4.75% 12.39 3.06 0.04 0.11% 1%
BMI Badger Meter, Inc. 35.61 4.80% 20.12 1.77 0.56 1.57% 32%
TDS Telephone and Data Systems 30.23 4.82% 23.25 1.30 0.47 1.55% 36%
BKH Black Hills Corp. 29.16 4.93% 17.78 1.64 1.46 5.01% 89%
GS Goldman Sachs Group, Inc.   135.92 4.96% 14.89 9.13 1.40 1.03% 15%
CWT California Water Service 35.59 5.14% 19.34 1.84 0.62 1.74% 34%
MCY Mercury General Corp. 39.26 5.28% 14.43 2.72 2.40 6.11% 88%
HHS Harte-Hanks, Inc. 8 5.40% 10.13 0.79 0.32 4.00% 41%
TCB TCF Financial Corp. 13.62 5.58% 13.76 0.99 0.2 1.47% 20%
PRK Park National Corp. 62.57 5.87% 13.87 4.51 3.76 6.01% 83%
33 Companies


Watch List Summary

Weyco (WEYS) topped out list again. The company is typically undervalue at 2.2% dividend yield.  The current yield implies that this company is undervalued by 30%. Current cost pressures may be coming from the commodity side, leather cost.  But once the company passes that cost down to the consumer, that variable cost could be key to future margin expansion.

Transatlantic Holdings (TRH) is a re-insurer and may be under pressure because of the recent catastrophic headlines.  Currently trading 30% below book value, TRH may provide sufficient margin of safety for patient investors.

You may note that Berkshire Hathaway (BRK) is on this list but doesn't pay any dividend.  We view BRK as a no-load fund that all investors should consider holding.  There's no better time to buy this company than at or near the low.

Top Five Performance Review

In our ongoing review of the NLO Dividend Watch List, we have taken the top five stocks on our list from June 11, 2010 and have checked their performance one year later. The top five companies on that list can be seen in the table below.

Symbol Name 2010 Price 2011 Price % change
SVU SUPERVALU Inc. 12.24 8.49 -30.64%
FRS Frisch's Restaurants, Inc 20.55 21.34 3.84%
CWT California Water Service 34.91 35.59 1.95%
GS Goldman Sachs Group, Inc.   135.64 135.92 0.21%
UMBF UMB Financial Corp.  37.58 40.46 7.66%


Average -3.40%


DJI Dow Jones Industrial 10,211.07 11,951.91 17.05%
SPX S&P 500 1,091.60 1,270.98 16.43%

Disclaimer:
On our current list, we excluded companies that have no earnings. Stocks that appear on our watch lists are not recommendations to buy. Instead, they are the starting point for doing your research and determining the best company to buy. Ideally, a stock that is purchased from this list is done after a considerable decline in the price and extensive due diligence. We suggest that readers use the March 2009 low (or the companies' most distressed level in the last 2 years) as the downside projection for investing. Our view is to embrace the worse case scenario prior to investing. A minimum of 50% decline or the November 2008 to March 2009 low, whichever is lower, would fit that description. It is important to place these companies on your own watch list so that when the opportunity arises, you can purchase them with a greater margin of safety. It is our expectation that, at the most, only 1/3 of the companies that are part of our list will outperform the market over a one-year period.

Please consider donating to the New Low Observer. Thank you.

In the News: June 10, 2011

Please consider donating to the New Low Observer. Thank you.

In the News

How to Get a Special Dividend at Barron’s
The Security I like Best (PDF) by Warren Buffett
College is a scam at MarketWatch
Is Farmland A Smart Hedge Against Inflation?  at Gonzalo Lira
Fidelity and Putnam Among Fund Families Duped by Longtop at Morningstar
The U.S. Postal Service Nears Collapse at BusinessWeek
Prospects Climb at Ryanair at Barron’s
Hedge-fund secrets to beat the market at MarketWatch
Jim Cramer Calls LinkedIn IPO Action A Sham at MarketWatch
The Invisible Stock Bubble at SmartMoney
Will Illumina Find New Life At 50-Day Line? at Investor’s Business Daily
As Lenders Hold Homes in Foreclosure, Sales Are Hurt at NYT
Fleckenstein Doesn't See Technology Industry `Bubble' (Video) at Bloomberg
Facing Up to End of 'Easy Oil' at WSJ
Clearing Firm Rattles Investors at Barron’s
Tag, You're It! Too Big to Fail Risk Transferred, Not Eliminated at The Atlantic
Next Danger: "Splash Crash" at Barron’s
Death Derivatives: Wall Street’s Latest Ill-Advised Maneuver at Minyanville
Biggs Buying as S&P 500 Profit Forecasts Rise Most in a Year at Bloomberg
Berkley Forms New London Unit at Zacks
May Not Be Bearish Enough on China Real Estate: Chanos at Bloomberg
Hartford Sells Unit to CenterState at Zacks
The Dow at 115: Its Close Relationship to GDP at WSJ
Dow Theory: Still Sending a Bullish Signal? at WSJ
Target Says ‘Limited Number’ of Buyers for Card Portfolio at Bloomberg
Farmers Will Do Well at SeekingAlpha

Watch List Notes

It was reported on May 24, 2011 that Carl Icahn sold a large portion of his Biogen Idec (BIIB).  This pretty much closes the initiation of Mr. Icahn’s position in Biogen Idec (BIIB) which was started back in June 2007.  The average compounded annual gain for Mr. Icahn over the four-year period was slightly above 20%.  However, based on Biogen Idec (BIIB) being on our Watch List of October ,with our sell recommendation of Biogen Idec (BIIB) on April 21, 2011, the compounded annualized gain was 77%.
Carl Icahn Buys Biogen Idec at GuruFocus June 2007

Carl Icahn Sells 2.6 Million Shares in Biogen as Other Execs Sell at Barron’s May 2011
October 2009 Nasdaq List at NLO
April 2011 Sell BIIB/Buy TEVA at NLO

Please consider donating to the New Low Observer. Thank you.

NLO Dividend Watch List: May 27, 2011

The excitement from several IPOs couldn't push the market higher and the market remained flat for another week.  Most of the major indexes including the S&P500, Dow Jones Industrial Average, and Nasdaq 100 remained unchanged or slightly down.  Our watch list this week grew from 24 to 29 companies.  The following are stocks on our list that are within 11% of their 52-week low.

May 27, 2011 Watch List

Symbol Name Price % Yr Low P/E EPS (ttm) Dividend Yield Payout Ratio
HTLF Heartland Financial USA, Inc.  14.09 2.32% 13.17 1.07 0.40 2.84% 37%
TGT Target Corp. 49.37 2.36% 12.07 4.09 1.00 2.03% 24%
CHFC Chemical Financial Corp.  19.29 2.66% 17.54 1.10 0.80 4.15% 73%
ANAT American National Insurance 76.74 3.51% 12.98 5.91 3.08 4.01% 52%
WABC Westamerica BanCorp.  49.87 3.62% 15.68 3.18 1.44 2.89% 45%
HGIC Harleysville Group Inc.  31.56 4.12% 11.31 2.79 1.44 4.56% 52%
SJW SJW Corp. 22.8 4.20% 17.81 1.28 0.69 3.03% 54%
WEYS Weyco Group, Inc.  23.23 4.22% 20.20 1.15 0.64 2.76% 56%
HHS Harte-Hanks, Inc. 8.43 4.33% 10.67 0.79 0.32 3.80% 41%
BXS BanCorp.South Inc. 12.81 4.40% 80.06 0.16 0.04 0.31% 25%
TRH Transatlantic Holdings, Inc. 46.36 4.84% 15.15 3.06 0.84 1.81% 27%
NWN Northwest Natural Gas Co. 44.97 5.56% 17.16 2.62 1.74 3.87% 66%
SFNC Simmons First National Corp.  25.62 5.96% 11.92 2.15 0.76 2.97% 35%
NTRS Northern Trust Corp.  48.45 6.95% 17.88 2.71 1.12 2.31% 41%
GS Goldman Sachs Group, Inc.   138.66 7.07% 15.19 9.13 1.40 1.01% 15%
TMP Tompkins Financial Corp. 38.56 7.32% 12.32 3.13 1.36 3.53% 43%
SYBT S.Y. BanCorp., Inc.  24.24 7.78% 14.18 1.71 0.72 2.97% 42%
UBSI United Bankshares, Inc.  23.9 8.19% 14.40 1.66 1.20 5.02% 72%
CMA Comerica, Inc. 35.91 8.46% 19.73 1.82 0.40 1.11% 22%
BANF BancFirst Corp.  38.1 9.26% 13.51 2.82 1.00 2.62% 35%
MDP Meredith Corp. 31.6 9.27% 11.09 2.85 1.02 3.23% 36%
BMI Badger Meter, Inc. 37.14 9.30% 20.98 1.77 0.56 1.51% 32%
BOH Bank of Hawaii Corp. 46.98 9.41% 13.09 3.59 1.80 3.83% 50%
AWR American States Water Co. 34.42 10.18% 20.01 1.72 1.12 3.25% 65%
CTBI Community Trust BanCorp. 27.02 10.29% 11.65 2.32 1.22 4.52% 53%
CALM Cal-Maine Foods, Inc. 28.93 10.29% 9.27 3.12 1.88 6.50% 60%
CWT California Water Service 37.37 10.53% 20.31 1.84 1.23 3.29% 67%
MCY Mercury General Corp. 41.3 10.75% 15.18 2.72 2.40 5.81% 88%
GBCI Glacier BanCorp., Inc.  14.24 10.90% 24.14 0.59 0.52 3.65% 88%
29 Companies


Watch List Summary

On top of our list is Heartland Financial (HTLF).  This small cap, south-west regional bank, was eighth on our list two weeks back.  It's currently trading at 7% discount to its book value.  That is very low on a relative basis for a company that typically trades around 1.4x book value for the past five years.  Buying the company now would be just as cheap as buying it at the March 09' low based on the dividend yield (2.84% vs 2.95%).
Next on our list is Target (TGT).  After trading up to $52 two weeks ago, the shares traded down after the quarterly earning report.  It was announced that, as of March 31, 2011, Pershing Square (Bill Ackman) sold all of its TGT holding after shareholders rejected a board of directors nominated by the hedge-fund manager.  We believe Pershing Square's exit was the cause of the recent price declined.  We don't know how long it would take to unwind this large position.  However, we'd guess that it took three months which TGT was trading around $60.  Shares of TGT declined 16.5% since the beginning of the year.  On a relative dividend yield perspective, TGT is a great value trading at double its historical undervalue range of 1%.
Another company we'd like to highlight is American National Insurance (ANAT).  This life insurance and annuity provider is trading at a deep discount.  The current price-to-book is at 0.55 which is far from the 5-year average of 0.8.  To compensate patient investors, ANAT pays 4% in dividends which is higher than the usual 3% over the past 5 years.  Current headline risk remains as natural disasters continue to spread.  We don't know how much natural disasters are going to affect ANAT.  However, we believe it might be a good risk/reward proposition at this level.
Top Five Performance Review
In our ongoing review of the NLO Dividend Watch List, we have taken the top five stocks on our list from May 28, 2010 and have checked their performance one year later. The top five companies on that list can be seen in the table below.

Symbol Name 2010 Price 2011 Price % change
VIVO Meridian Bioscience 17.48 23.3 33.30%
FII Federated Investors 22.21 25.33 14.05%
LLY Eli Lilly & Co. 32.79 37.85 15.43%
XOM Exxon Mobil Corp.   60.46 82.63 36.67%
ADM Archer Daniels Midland 25.27 32.21 27.46%


Average 25.38%


DJI Dow Jones Industrial 10,136.63 12,441.58 22.74%
SPX S&P 500 1,089.41 1,331.10 22.18%

Our top five blew past the market by a good margin.  In addition to capital appreciation, most of these stocks pay great dividends.  Archer Daniels Midland (ADM), at the time, paid the smallest dividend yield of the group with yield of 2.37%.  While not great, that was considered undervalued according to ADM's historical relative dividend yield of 2%.  The best performer was Exxon Mobile (XOM), the largest oil and gas producer.  While many people would think it's impossible for a giant such as XOM to move substantially higher, this data proves otherwise. The runner up is one of our favorite stocks, Meridian Bioscience (VIVO).  This medical equipment supplier and a long time dividend achiever has no debt and carries a market cap of $955M.  When it appeared at the low, many people were skeptical of its ability to grow.  One year later, that concern is now behind the company and those who were skeptical missed the opportunity to buy VIVO at the low (within 1.1% of the 52wk low at the time) while sporting a 4.35% yield.

Disclaimer:

On our current list, we excluded companies that have no earnings. Stocks that appear on our watch lists are not recommendations to buy. Instead, they are the starting point for doing your research and determining the best company to buy. Ideally, a stock that is purchased from this list is done after a considerable decline in the price and extensive due diligence. We suggest that readers use the March 2009 low (or the companies' most distressed level in the last 2 years) as the downside projection for investing. Our view is to embrace the worse case scenario prior to investing. A minimum of 50% decline or the November 2008 to March 2009 low, whichever is lower, would fit that description. It is important to place these companies on your own watch list so that when the opportunity arises, you can purchase them with a greater margin of safety. It is our expectation that, at the most, only 1/3 of the companies that are part of our list will outperform the market over a one-year period.

Please consider donating to the New Low Observer. Thank you.

In the News

Please consider donating to the New Low Observer. Thank you.

In the News


We’re still on the hunt for the causes of the May 6, 2010 flash crash (Flash Crash Follies).  The more we dig the more we realized that such a crash on a greater scale with more lasting and far reaching negative consequences will be felt as the universe of ETFs grows.

To arrive at our conclusion, along with all the other articles we’ve submitted on the topic, we’ve pulled the earliest reference to a “flash crash” in the article titled, “Gone in 60 seconds: ETF holders lost $20M; Pricing glitch produces big winners, big losers.”  Of course, at the time, December 17, 2004, it was called a “pricing glitch” and not a flash crash.  However, all of the features exhibited in that crash of the Nasdaq 100 Index Tracking Stock (QQQ), now known as an ETF, was very much a characteristic of what happen on May 6, 2010. 

One quote that we especially enjoyed from the January 24, 2005 article was the quote by Nasdaq vice-president Chris Concannon who said:
"In the early QQQ trading, there were very few liquidity providers facilitating trading. That obviously changed immediately, and we will never see something like this happen again.'' 
Apparently, never has come much sooner than previously thought.

The solution to the problem of future flash crashes is to do away with all ETF and derivative related products for retail investors.  However, we understand the blithe nature of such a proposition.  To remedy this thought and to facility the investor’s desire to take advantage of future price discrepancies (speculate), we have thought openly of placing limit orders to buy 30% to 50% below the prevailing price of the Nasdaq 100 ETF or other ETFs that we’d like to own if the price was right. 

Our use of limit orders to buy would be with the understanding that if the desired price target isn’t hit then our request would not be filled.  Unless you have a marginable account, you’d have to be very clear that cash has been set aside for the quantity and approximate price that you’d make your purchase.  Additionally, our discussion of the use of automated orders and ETFs stand in apparent contradiction to our writings on the respective topics (article on automated order here) (articles on ETFs here).
Please consider donating to the New Low Observer. Thank you.

Nasdaq 100 Watch List: May 21, 2011

Below are the Nasdaq 100 companies that are within 19% of the 52-week low. This list is strictly for the purpose of researching whether or not the companies have viable business models. Although these companies are very risky, they provide significant opportunity to outperform the market in the coming year.

<> 

Symbol
Name
Price
P/E
EPS
Yield
P/B
% from low
Staples, Inc.
$16.37
13.53
1.21
2.40%
1.72
0.00%
Cisco Systems, Inc.
$16.53
12.9
1.28
1.40%
1.94
1.16%
Research In Motion
$43.52
6.86
6.34
0.00%
2.58
2.33%
Marvell Technology
$14.34
10.7
1.34
0.00%
1.72
3.39%
Microsoft Corp.
$24.49
9.73
2.52
2.60%
3.9
7.74%
Akamai Tech.
$34.20
36.19
0.95
0.00%
2.76
8.30%
Urban Outfitters
$31.51
20.65
1.53
0.00%
3.96
8.54%
Teva Pharmaceutical
$49.87
13.41
3.72
1.60%
1.94
11.17%
Broadcom Corp.
$33.51
16.91
1.98
1.10%
3.12
12.07%
Activision
$11.60
26.85
0.43
1.40%
1.32
15.88%
Infosys
$62.91
24.01
2.62
0.70%
5.85
18.07%
Qiagen
$20.05
34.57
0.58
0.00%
1.87
18.92%


Watch List Summary

Is Staples (SPLS) going to add one more notch to the Stadium Effect theory (pdf link)?  This theory says that after a company acquires the naming rights to a major league sports team, the stock of such a company typically underperforms the market (if it doesn't go out of business altogether).  Staples (SPLS) is at the very low as of the close of market on Friday May 20, 2011.  We're not bold enough to jump on board this stock at the moment, and this is saying a lot for a couple of guys who relish purchases at a new low.

Watch List Top 5 Performance Review

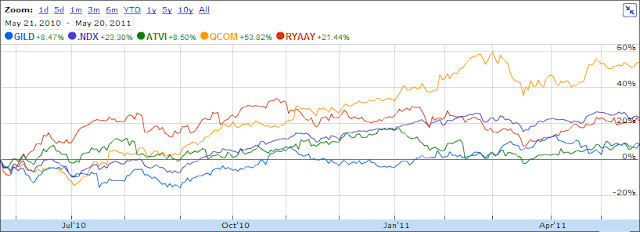
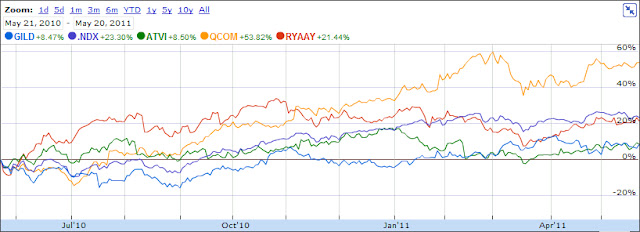
In our review of the watch list dated May 21, 2010, we found that all the stocks had gains while three of the top 5 outperformed the Nasdaq 100.  Qualcomm (QCOM), Gilead Sciences (GILD) and Genzyme (GENZ) was among our favorites at the time the list was published.  Ryanair (RYAAY) was a surprise to us since the airline industry is known for failure and bankruptcy.

Symbol Name 2010 2011 gain/loss
GILD Gilead Sciences 36.57 40.98 12.06%
RYAAY Ryanair 23.14 30.02 29.73%
QCOM QUALCOMM 35.89 57.38 59.88%
ATVI Activision 10.24 11.6 13.28%
GENZ Genzyme 49.41 acquired 51.02%
Average gain 33.19%
^NDX Nasdaq 100 1822.77 2351.43 29.00%
percentage change in chart is approximate only


In the News
We couldn't help but notice the article from Barron's titled "Price War Brewing on Cigarettes?" and the Seeking Alpha article titled "Cigarette Stocks Burning Up to New Highs." 
The Barron's article suggests that margins will be squeezed as competition for market share increases.  the companies mentioned by Barron's are Imperial Tobacco (ITYBY), Philip Morris (PM), British American Tobacco (BTI) and Altria (MO).
The SeekingAlpha article says that despite the fact that cigarette stocks are at a new high, there is still room to grow on the upside.  The companies mentioned in the Seeking Alpha are Lorrillard (LO), Altria (MO), Philip Morris (PM) and Reynolds American (RAI).   
We're on the side of Barron's.  As a price war breaks out, the earnings will be lower than expected and that will translate in a decline in the stock price.  We'll check back a year from now to see what the performance of the cigarette manufacturers look like.

Please consider donating to the New Low Observer. Thank you.

In The News

Please consider donating to the New Low Observer. Thank you.