The market continues to struggle to move higher. Most major indexes are virtually flat for the week. Our watch list this week contains 24 companies that are within 11% of their 52-week low. The following is our list for Friday the 13th.
May 13, 2011 Watch List
| Symbol | Name | Price | % Yr Low | P/E | EPS (ttm) | Dividend | Yield | Payout Ratio |
| SJW | SJW Corp. | 22.44 | 0.85% | 17.53 | 1.28 | 0.69 | 3.07% | 54% |
| WEYS | Weyco Group, Inc. | 22.98 | 3.10% | 19.98 | 1.15 | 0.64 | 2.79% | 56% |
| WABC | Westamerica BanCorp. | 49.64 | 3.14% | 15.61 | 3.18 | 1.44 | 2.90% | 45% |
| HHS | Harte-Hanks, Inc. | 8.75 | 3.92% | 11.08 | 0.79 | 0.32 | 3.66% | 41% |
| CHFC | Chemical Financial Corp. | 19.67 | 4.68% | 17.88 | 1.10 | 0.80 | 4.07% | 73% |
| HGIC | Harleysville Group Inc. | 31.93 | 5.34% | 11.44 | 2.79 | 1.44 | 4.51% | 52% |
| BXS | BanCorp.South Inc. | 12.93 | 5.38% | 80.81 | 0.16 | 0.04 | 0.31% | 25% |
| HTLF | Heartland Financial USA, Inc. | 14.6 | 6.03% | 13.64 | 1.07 | 0.40 | 2.74% | 37% |
| SFNC | Simmons First National Corp. | 25.68 | 6.20% | 11.94 | 2.15 | 0.76 | 2.96% | 35% |
| BMI | Badger Meter, Inc. | 36.14 | 6.36% | 20.42 | 1.77 | 0.56 | 1.55% | 32% |
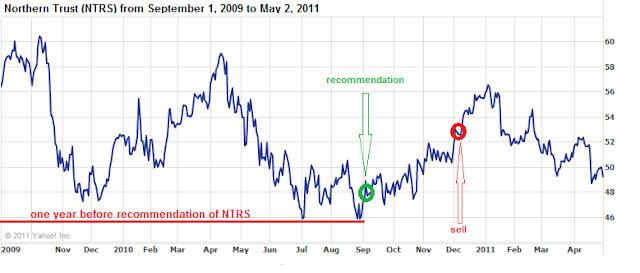
| NTRS | Northern Trust Corp. | 48.24 | 6.49% | 17.80 | 2.71 | 1.12 | 2.32% | 41% |
| TGT | Target Corp. | 51.52 | 6.82% | 12.88 | 4.00 | 1.00 | 1.94% | 25% |
| CALM | Cal-Maine Foods, Inc. | 28.04 | 6.90% | 8.99 | 3.12 | 1.88 | 6.70% | 60% |
| AWR | American States Water Co. | 33.52 | 7.30% | 18.94 | 1.77 | 1.12 | 3.34% | 63% |
| SYBT | S.Y. BanCorp., Inc. | 24.05 | 7.90% | 14.06 | 1.71 | 0.72 | 2.99% | 42% |
| TRH | Transatlantic Holdings, Inc. | 47.75 | 8.33% | 15.60 | 3.06 | 0.84 | 1.76% | 27% |
| CWT | California Water Service | 36.81 | 8.87% | 20.34 | 1.81 | 1.23 | 3.34% | 68% |
| WFSL | Washington Federal, Inc. | 15.27 | 9.31% | 21.81 | 0.70 | 0.24 | 1.57% | 34% |
| NWN | Northwest Natural Gas Co. | 45.87 | 9.47% | 16.80 | 2.73 | 1.74 | 3.79% | 64% |
| SHEN | Shenandoah Telecom | 16.98 | 9.55% | 22.34 | 0.76 | 0.33 | 1.94% | 43% |
| MCY | Mercury General Corp. | 40.87 | 9.60% | 15.03 | 2.72 | 2.40 | 5.87% | 88% |
| CMA | Comerica, Inc. | 36.39 | 9.91% | 19.99 | 1.82 | 0.40 | 1.10% | 22% |
| CTBI | Community Trust BanCorp. | 26.95 | 9.98% | 11.62 | 2.32 | 1.22 | 4.53% | 53% |
| TMP | Tompkins Financial Corp. | 39.72 | 10.55% | 12.69 | 3.13 | 1.36 | 3.42% | 43% |
| 24 Companies | ||||||||
Watch List Summary
SJW Corp. or San Jose Water (SJW) remain at the top of our list but the price fell just slightly compared to our last posting. Again, the previous time this company appeared on our dividend watch list back on December 18, 2009. At that time, SJW was trading at $21.93 and had a P/E ratio of 24.42. SJW is now trading with a P/E ratio of 17.7 and a dividend yield of 3.05% despite having a higher absolute price. These numbers reflect that the company is able to consistently grow their earnings while increasing their dividends. After being on our list in December 2009, SJW rose above $27 and has steadily maintained a rising trend above $24 until recently.
Going down the list, we'd like to highlight Simmons First National (SFNC). Our view of the company remains unchanged. It is a play on farmland boom we expect to see down the road. Read more on SFNC in our Investment Observation.
Target (TGT) is another name that the New Low team is focusing on. With gas price above $4 for the most of the country, the retail sector may not be the place to be. But with Target's ability to bring their private label brand, Up & Up, with a variety of products, we think this is an overlooked area. In addition, the credit card division within Target could possibly be a hidden value. The 2% yield is at a historical high for the company and we think this is a good risk-reward opportunity.
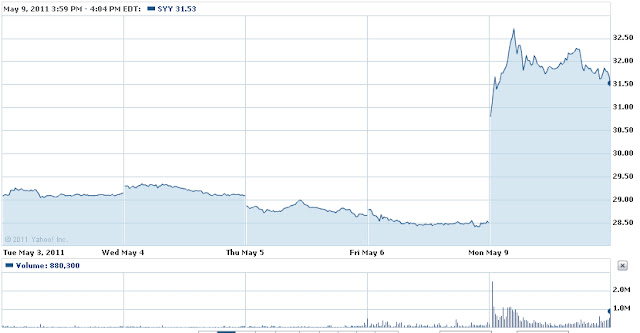
This week we say goodbye to Sysco Foods (SYY) from our watch list. It had been on our watch list since the beginning of the year and we've pounded the table several times about this stock. Despite the negativity about pricing, the latest earnings report displayed the company's ability to manage the challenging environment. For more on Sysco, click here.
Top Five Performance Review
In our ongoing review of the NLO Dividend Watch List, we have taken the top five stocks on our list from May 14, 2010 and have checked their performance one year later. The top five companies on that list can be seen in the table below.
| Symbol | Name | 2010 Price | 2011 Price | % change |
| MON | Monsanto Co. | 54.61 | 63.79 | 16.81% |
| LLY | Eli Lilly & Co. | 33.92 | 38.95 | 14.83% |
| FRS | Frisch's Restaurants, Inc | 21.01 | 21.85 | 4.00% |
| FII | Federated Investors Inc | 23.16 | 26.14 | 12.87% |
| HSC | Harsco Corp. | 27.56 | 33.65 | 22.10% |
| Average | 14.12% | |||
| DJI | Dow Jones Industrial | 10,620.16 | 12,595.75 | 18.60% |
| SPX | S&P 500 | 1,135.68 | 1,337.77 | 17.79% |
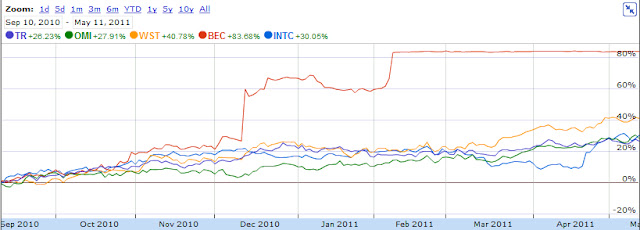
There are some interesting things to take from this chart. First, noticed the ability for Harso (HSC) to rally from -30% to almost up 30%. This company is in the steel / basic material sector and as we know, the sector has done quite well. Monsanto (MON) may have tagged along for the ride. Although there was heavy criticism of MON's key product, Roundup, that didn't stop the stock from rising above 30%. With basic material costs rising, it's no wonder that Frisch's Restaurant (FRS) suffered. A 15% hike in dividend back in September didn't do much either. Typically, this stock is consider undervalued at 3% yield. Our May watch list had FRS yielding 2.5%.
Disclaimer:
On our current list, we excluded companies that have no earnings. Stocks that appear on our watch lists are not recommendations to buy. Instead, they are the starting point for doing your research and determining the best company to buy. Ideally, a stock that is purchased from this list is done after a considerable decline in the price and extensive due diligence. We suggest that readers use the March 2009 low (or the companies' most distressed level in the last 2 years) as the downside projection for investing. Our view is to embrace the worse case scenario prior to investing. A minimum of 50% decline or the November 2008 to March 2009 low, whichever is lower, would fit that description. It is important to place these companies on your own watch list so that when the opportunity arises, you can purchase them with a greater margin of safety. It is our expectation that, at the most, only 1/3 of the companies that are part of our list will outperform the market over a one-year period.