The excitement from several IPOs couldn't push the market higher and the market remained flat for another week. Most of the major indexes including the S&P500, Dow Jones Industrial Average, and Nasdaq 100 remained unchanged or slightly down. Our watch list this week grew from 24 to 29 companies. The following are stocks on our list that are within 11% of their 52-week low.
May 27, 2011 Watch List
| Symbol |
Name |
Price |
% Yr Low |
P/E |
EPS (ttm) |
Dividend |
Yield |
Payout Ratio |
| HTLF |
Heartland Financial USA, Inc. |
14.09 |
2.32% |
13.17 |
1.07 |
0.40 |
2.84% |
37% |
| TGT |
Target Corp. |
49.37 |
2.36% |
12.07 |
4.09 |
1.00 |
2.03% |
24% |
| CHFC |
Chemical Financial Corp. |
19.29 |
2.66% |
17.54 |
1.10 |
0.80 |
4.15% |
73% |
| ANAT |
American National Insurance |
76.74 |
3.51% |
12.98 |
5.91 |
3.08 |
4.01% |
52% |
| WABC |
Westamerica BanCorp. |
49.87 |
3.62% |
15.68 |
3.18 |
1.44 |
2.89% |
45% |
| HGIC |
Harleysville Group Inc. |
31.56 |
4.12% |
11.31 |
2.79 |
1.44 |
4.56% |
52% |
| SJW |
SJW Corp. |
22.8 |
4.20% |
17.81 |
1.28 |
0.69 |
3.03% |
54% |
| WEYS |
Weyco Group, Inc. |
23.23 |
4.22% |
20.20 |
1.15 |
0.64 |
2.76% |
56% |
| HHS |
Harte-Hanks, Inc. |
8.43 |
4.33% |
10.67 |
0.79 |
0.32 |
3.80% |
41% |
| BXS |
BanCorp.South Inc. |
12.81 |
4.40% |
80.06 |
0.16 |
0.04 |
0.31% |
25% |
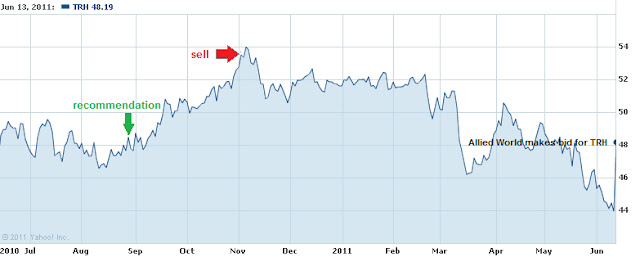
| TRH |
Transatlantic Holdings, Inc. |
46.36 |
4.84% |
15.15 |
3.06 |
0.84 |
1.81% |
27% |
| NWN |
Northwest Natural Gas Co. |
44.97 |
5.56% |
17.16 |
2.62 |
1.74 |
3.87% |
66% |
| SFNC |
Simmons First National Corp. |
25.62 |
5.96% |
11.92 |
2.15 |
0.76 |
2.97% |
35% |
| NTRS |
Northern Trust Corp. |
48.45 |
6.95% |
17.88 |
2.71 |
1.12 |
2.31% |
41% |
| GS |
Goldman Sachs Group, Inc. |
138.66 |
7.07% |
15.19 |
9.13 |
1.40 |
1.01% |
15% |
| TMP |
Tompkins Financial Corp. |
38.56 |
7.32% |
12.32 |
3.13 |
1.36 |
3.53% |
43% |
| SYBT |
S.Y. BanCorp., Inc. |
24.24 |
7.78% |
14.18 |
1.71 |
0.72 |
2.97% |
42% |
| UBSI |
United Bankshares, Inc. |
23.9 |
8.19% |
14.40 |
1.66 |
1.20 |
5.02% |
72% |
| CMA |
Comerica, Inc. |
35.91 |
8.46% |
19.73 |
1.82 |
0.40 |
1.11% |
22% |
| BANF |
BancFirst Corp. |
38.1 |
9.26% |
13.51 |
2.82 |
1.00 |
2.62% |
35% |
| MDP |
Meredith Corp. |
31.6 |
9.27% |
11.09 |
2.85 |
1.02 |
3.23% |
36% |
| BMI |
Badger Meter, Inc. |
37.14 |
9.30% |
20.98 |
1.77 |
0.56 |
1.51% |
32% |
| BOH |
Bank of Hawaii Corp. |
46.98 |
9.41% |
13.09 |
3.59 |
1.80 |
3.83% |
50% |
| AWR |
American States Water Co. |
34.42 |
10.18% |
20.01 |
1.72 |
1.12 |
3.25% |
65% |
| CTBI |
Community Trust BanCorp. |
27.02 |
10.29% |
11.65 |
2.32 |
1.22 |
4.52% |
53% |
| CALM |
Cal-Maine Foods, Inc. |
28.93 |
10.29% |
9.27 |
3.12 |
1.88 |
6.50% |
60% |
| CWT |
California Water Service |
37.37 |
10.53% |
20.31 |
1.84 |
1.23 |
3.29% |
67% |
| MCY |
Mercury General Corp. |
41.3 |
10.75% |
15.18 |
2.72 |
2.40 |
5.81% |
88% |
| GBCI |
Glacier BanCorp., Inc. |
14.24 |
10.90% |
24.14 |
0.59 |
0.52 |
3.65% |
88% |
| 29 Companies |
|
|
|
|
|
|
|
Watch List Summary
On top of our list is Heartland Financial (HTLF). This small cap, south-west regional bank, was eighth on our list two weeks back. It's currently trading at 7% discount to its book value. That is very low on a relative basis for a company that typically trades around 1.4x book value for the past five years. Buying the company now would be just as cheap as buying it at the March 09' low based on the dividend yield (2.84% vs 2.95%).
Next on our list is Target (TGT). After trading up to $52 two weeks ago, the shares traded down after the quarterly earning report. It was
announced that, as of March 31, 2011, Pershing Square (Bill Ackman) sold all of its TGT holding after shareholders rejected a board of directors nominated by the hedge-fund manager. We believe Pershing Square's exit was the cause of the recent price declined. We don't know how long it would take to unwind this large position. However, we'd guess that it took three months which TGT was trading around $60. Shares of TGT declined 16.5% since the beginning of the year. On a relative dividend yield perspective, TGT is a great value trading at double its historical undervalue range of 1%.
Another company we'd like to highlight is American National Insurance (ANAT). This life insurance and annuity provider is trading at a deep discount. The current price-to-book is at 0.55 which is far from the 5-year average of 0.8. To compensate patient investors, ANAT pays 4% in dividends which is higher than the usual 3% over the past 5 years. Current headline risk remains as natural disasters continue to spread. We don't know how much natural disasters are going to affect ANAT. However, we believe it might be a good risk/reward proposition at this level.
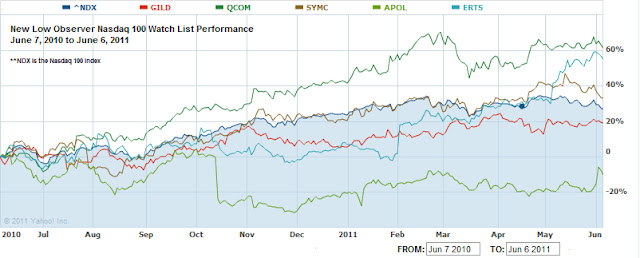
Top Five Performance Review
In our ongoing review of the NLO Dividend Watch List, we have taken the top five stocks on our list from
May 28, 2010 and have checked their performance one year later. The top five companies on that list can be seen in the table below.
| Symbol |
Name |
2010 Price |
2011 Price |
% change |
| VIVO |
Meridian Bioscience |
17.48 |
23.3 |
33.30% |
| FII |
Federated Investors |
22.21 |
25.33 |
14.05% |
| LLY |
Eli Lilly & Co. |
32.79 |
37.85 |
15.43% |
| XOM |
Exxon Mobil Corp. |
60.46 |
82.63 |
36.67% |
| ADM |
Archer Daniels Midland |
25.27 |
32.21 |
27.46% |
|
|
|
Average |
25.38% |
|
|
|
|
|
| DJI |
Dow Jones Industrial |
10,136.63 |
12,441.58 |
22.74% |
| SPX |
S&P 500 |
1,089.41 |
1,331.10 |
22.18% |
Our top five blew past the market by a good margin. In addition to capital appreciation, most of these stocks pay great dividends. Archer Daniels Midland (ADM), at the time, paid the smallest dividend yield of the group with yield of 2.37%. While not great, that was considered undervalued according to ADM's historical relative dividend yield of 2%. The best performer was Exxon Mobile (XOM), the largest oil and gas producer. While many people would think it's impossible for a giant such as XOM to move substantially higher, this data proves otherwise. The runner up is one of our favorite stocks, Meridian Bioscience (VIVO). This medical equipment supplier and a long time dividend achiever has no debt and carries a market cap of $955M. When it appeared at the low, many people were skeptical of its ability to grow. One year later, that concern is now behind the company and those who were skeptical missed the opportunity to buy VIVO at the low (within 1.1% of the 52wk low at the time) while sporting a 4.35% yield.
Disclaimer:
On our current list, we excluded companies that have no earnings. Stocks that appear on our watch lists are not recommendations to buy. Instead, they are the starting point for doing your research and determining the best company to buy. Ideally, a stock that is purchased from this list is done after a considerable decline in the price and extensive due diligence. We suggest that readers use the March 2009 low (or the companies' most distressed level in the last 2 years) as the downside projection for investing. Our view is to embrace the worse case scenario prior to investing. A minimum of 50% decline or the November 2008 to March 2009 low, whichever is lower, would fit that description. It is important to place these companies on your own watch list so that when the opportunity arises, you can purchase them with a greater margin of safety. It is our expectation that, at the most, only 1/3 of the companies that are part of our list will outperform the market over a one-year period.
Please consider donating to the New Low Observer. Thank you.
