Category Archives: Nasdaq 100 Watch List

Nasdaq 100 Watch List: June 26, 2015

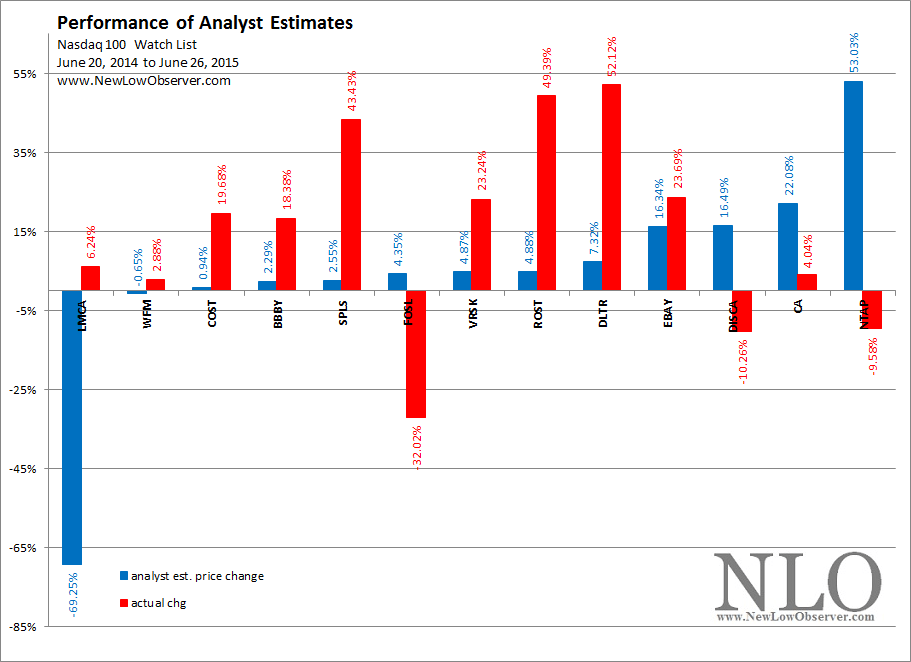
Below is the performance of the stocks from our June 20, 2014 Nasdaq 100 watch list compared to the Nasdaq 100 Index gain of +17.84% over the last year.

Symbol 2014 2015 actual chg
LMCA 35.07 37.26 6.24%
WFM 39.22 40.35 2.88%
COST 115.36 138.06 19.68%
BBBY 60.07 71.11 18.38%
SPLS 11.19 16.05 43.43%
FOSL 105.6 71.79 -32.02%
VRSK 60.46 74.51 23.24%
ROST 33.65 50.27 49.39%
DLTR 53.68 81.66 52.12%
EBAY 49.34 61.03 23.69%
DISCA 37.71 33.84 -10.26%
CA 28.73 29.89 4.04%
NTAP 35.79 32.36 -9.58%

Below is the analyst estimates from last year compared to the actual performance of the stocks.

image

At the extremes we see that Liberty Media (LMCA), Whole Foods (WFM), Fossil (FOSL), Discovery Communications (DISCA) and NetApp (NTAP) went in opposite directions of the analysts.  At the same time, the expectations for the remaining stocks didn’t quite come as close as anticipated.  The lone exception is Ebay (EBAY) which was expected to gain +16.34% as opposed to +23.69% of actual change.

Nasdaq 100 Watch List

Below is the latest list of stocks that we believe present the best investment opportunities from the Nasdaq 100 Index.

Nasdaq 100 Watch List: June 5, 2015

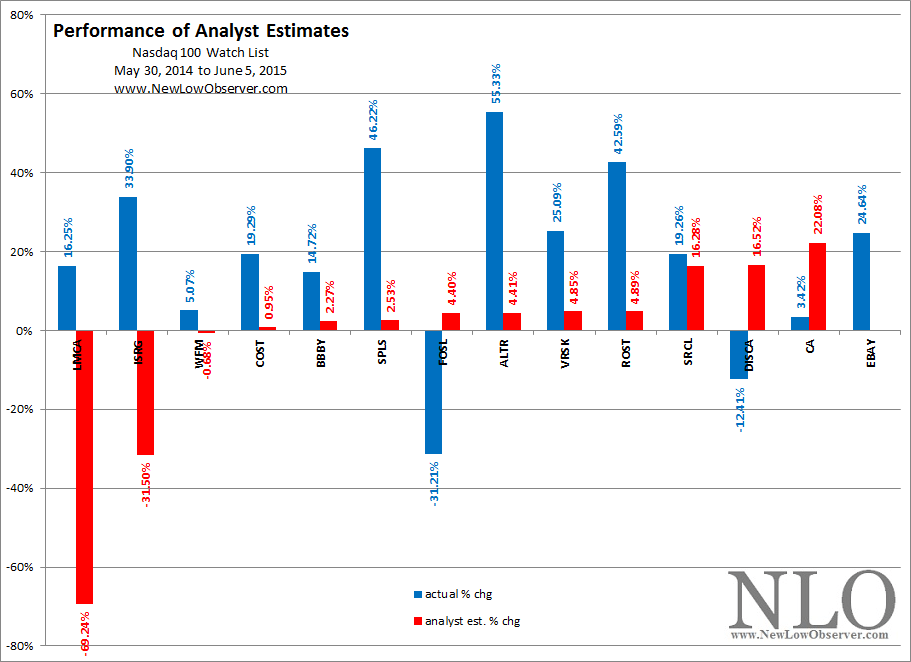
Below are the analyst estimates (in red) from our May 30, 2014 Nasdaq 100 Watch List and the actual performance of the stocks (blue).

image

The actual performance continues to reflect our theory that, at the time of the estimates, the analysts are likely to be too pessimistic of those stocks that have recently fallen on hard times while too optimistic for the stocks that have performed “better.”  Keep in mind that the list of stocks that we follow are already considered to be unloved.  However, the analyst estimates are routinely far off the mark.

The following was our commentary on the watch list last year:

“As we head into the month of June, we have to expect that LMCA and ISRG are the most likely to provide upside surprises as these stocks are considered by most analysts to underperform the market by a wide margin.”

As expected, LMCA and ISRG went in the opposite direction of the analyst estimates. Liberty Media gained +16.25% instead of falling –69.24% while Intuitive Surgical (ISRG) gained +33.90% instead of falling –31.50%.

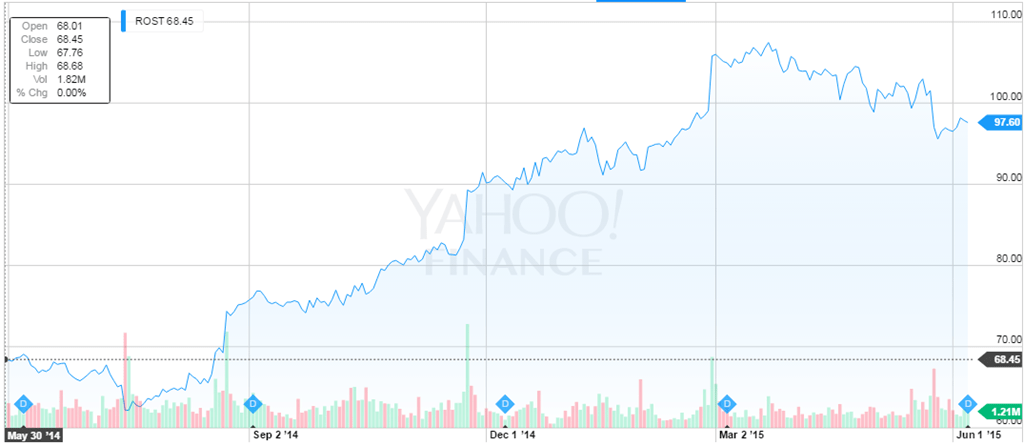
Our specific stock of interest was Ross Stores (ROST).  Of ROST, we said the following:

“If a repeat of the previous decline were to occur, we should expect $61.49 to appear on our radar before a meaning[ful] attempt at the old high.  We would not be buyers of the stock at the present time, however, the extreme upside target for this stock is $113.19 based on the work of Gould.”

Since our May 30, 2014 posting, ROST declined to $61.83 (within 1% of our estimated downside target) before climbing as high as $108.91 (within 4% of our estimated upside target) by March 24, 2015.

image 

Nasdaq Watch List

Below are the Nasdaq 100 companies that are on our radar.

Nasdaq 100 Watch List: May 8, 2015

Performance Review

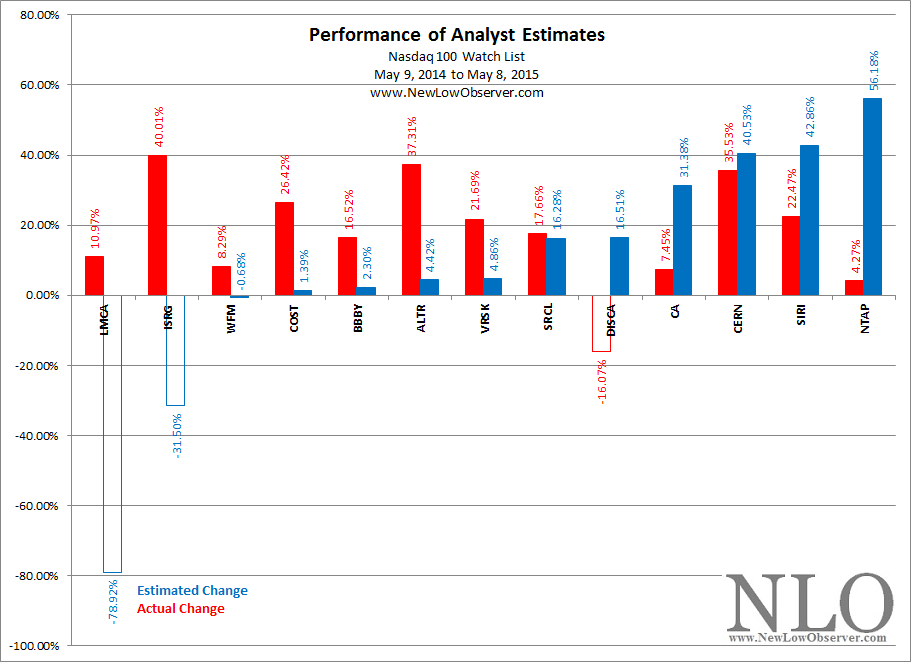
Below is the performance of the Nasdaq 100 watch list from May 9, 2014:

Symbol Name 2014 2015 % change
DISCA Discovery Comm. 37.33 31.33 -16.07%
BBBY Bed Bath & Beyond Inc. 61.31 71.44 16.52%
ISRG Intuitive Surgical, Inc. 353.06 494.32 40.01%
NTAP NetApp, Inc. 34.19 35.65 4.27%
EBAY eBay Inc. 50.54 58.82 16.38%
ALTR Altera Corp. 32.38 44.46 37.31%
WFM Whole Foods Market, Inc. 39.32 42.58 8.29%
SIRI Sirius XM Holdings Inc. 3.16 3.87 22.47%
VRSK Verisk Analytics, Inc. 60.53 73.66 21.69%
COST Costco Wholesale 115.39 145.88 26.42%
LMCA Liberty Media Corp. 34.18 37.93 10.97%
SRCL Stericycle, Inc. 113.90 134.01 17.66%
CERN Cerner Corporation 50.19 68.02 35.53%
CA CA Technologies 29.41 31.60 7.45%

The average gain of the entire list was +17.78% while the top five stocks (DISCA, BBBY, ISRG, NTAP, EBAY) gained an average of +12.22%.  This compares with the gain for the Nasdaq 100 index of +23.41% in the same 1-year time period.

image

As has frequently been the case, analyst expectations were too optimistic for stocks on the far right (DISCA, CA, CERN, SIRI, NTAP) where the average gains of +10.73%.  Likewise, the view was too pessimistic for stocks on the far left (LMCA, ISRG, WFM, COST, BBBY) which averaged +20.44% in the above chart.

The absolute change in Liberty Media (LMCA) and Intuitive Surgical (ISRG) was the most extreme.  Liberty Media saw its p/e ratio expand from 20 to 72 while ISRG’s p/e ratio increased from 26 to 39.  The increase in the p/e ratio should be expected with the increase in price.  However, value oriented investors would have overlooked these stocks simply because of the high p/e ratios and the expectation of lower earnings by analysts in 2014.

Watch List: May 8, 2015

Below are the Nasdaq 100 stocks of interest:

Continue reading

Nasdaq 100 Watch List: April 24, 2015

Performance Review

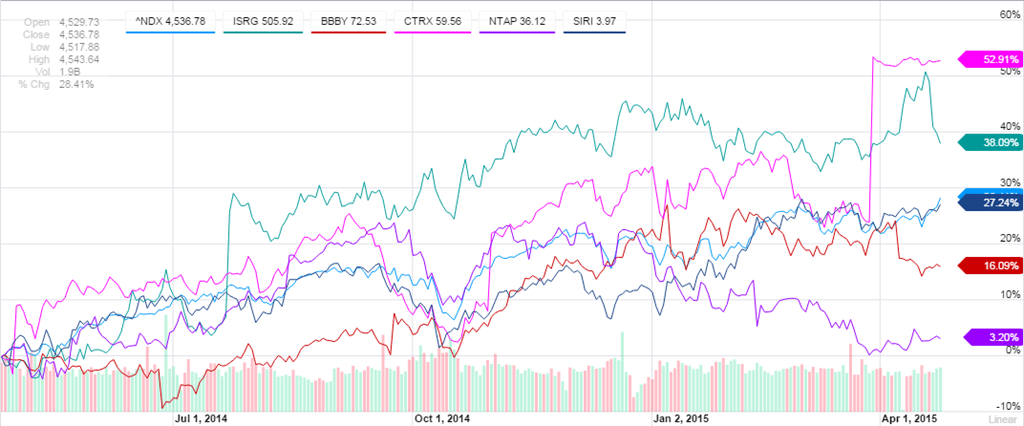
Below is the performance of our April 25, 2014 watch list.

Symbol Name 2014 2015 % chg
BBBY Bed Bath & Beyond Inc. 62.48 72.53 16.09%
CTRX Catamaran Corporation 38.95 59.56 52.91%
SIRI Sirius XM Holdings Inc. 3.12 3.96 26.92%
NTAP NetApp, Inc. 35.00 36.12 3.20%
ISRG Intuitive Surgical, Inc. 366.37 505.92 38.09%
DISCA Discovery Comm 39.14 32.71 -16.43%
VRSK Verisk Analytics, Inc. 57.81 72.68 25.72%
COST Costco Wholesale 115.01 148.12 28.79%
ALTR Altera Corp. 33.09 40.89 23.57%
SRCL Stericycle, Inc. 113.96 136.94 20.16%
CERN Cerner Corporation 49.51 73.32 48.09%
ROST Ross Stores Inc. 67.77 104.38 54.02%
MAT Mattel, Inc. 37.99 30.20 -20.51%
DLTR Dollar Tree, Inc. 51.36 81.14 57.98%

The average return for the entire list was +25.62% compared to the Nasdaq 100 index gaining +28.41% in the same period of time.  The top five stocks on our list (BBBY, CTRX, SIRI, NTAP, ISRG) gained +27.44% in the last year (excluding dividends).

image

As is common with our watch lists, a stock is being acquired at what we believe is a premium.  CTRX is being acquired by UnitedHealth (UNH), a Dow Jones Industrial Average component.  At the time of our watch list last year, CTRX was within 3% of the low.  Additionally, the announcement of the purchase by UNH followed the pattern of many companies buying the intended target after a gain over of +24% within the year and +177% within the last 5 years.

Nasdaq 100 Watch List: April 24, 2015

Below are the 9 Nasdaq 100 stocks that we think are worth your consideration:

Nasdaq 100 Watch List: April 10, 2015

Performance Review

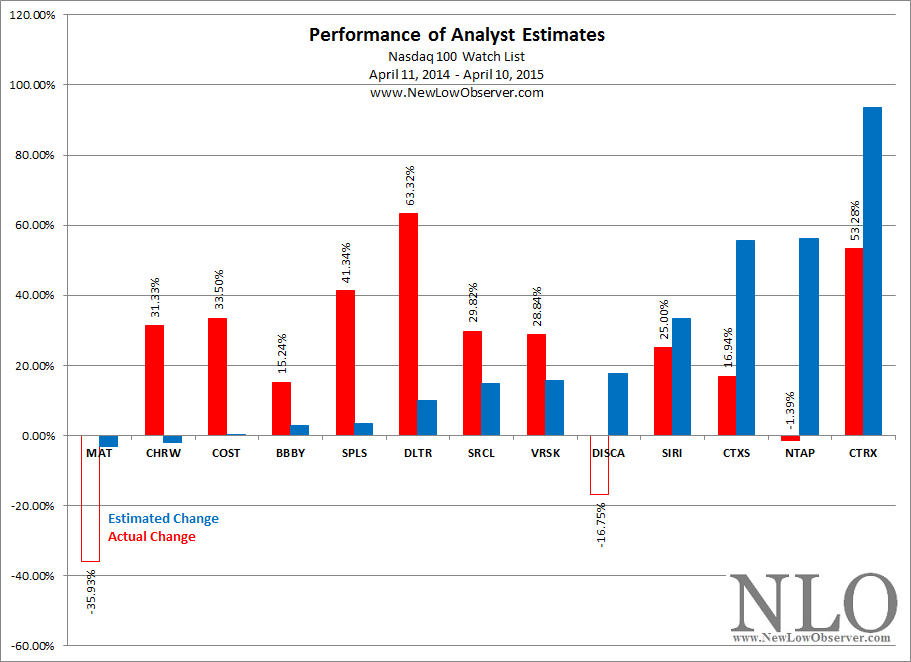
Below is the performance of the stocks from the April 11, 2014 Nasdaq 100 watch list compared to the Nasdaq 100 Index gain of +28.29%.  The entire list gained +23.49% while the top five stocks gained +31.76%.

Symbol Name 2014 2015 % chg
SHLD Sears Holdings 32.62 42.93 31.61%
BBBY Bed Bath & Beyond 63.72 73.43 15.24%
CTRX Catamaran Corp. 38.89 59.61 53.28%
VRSK Verisk Analytics, Inc. 56.55 72.86 28.84%
SRCL Stericycle, Inc. 109.33 141.93 29.82%
SIRI Sirius XM Holdings Inc. 3.16 3.95 25.00%
CTXS Citrix Systems, Inc. 54.56 63.8 16.94%
DISCA Discovery Comm. 39.69 33.04 -16.75%
SPLS Staples, Inc. 11.83 16.72 41.34%
MAT Mattel, Inc. 37.82 24.23 -35.93%
COST Costco Wholesale 112.08 149.63 33.50%
CHRW CH Robinson Worldwide 54.87 72.06 31.33%
DLTR Dollar Tree, Inc. 50.74 82.87 63.32%
LBTYA Liberty Global plc 38.56 52.55 36.28%
NTAP NetApp, Inc. 35.97 35.47 -1.39%

The actual change versus the analyst estimated change is represented below.

image

Worth noting is that of the top five stocks expected to outperform, none of the stocks exceeded the analyst expectations.  Alternatively, of the five stocks to perform the worst, four of the five stocks substantially out performed the analyst expectations.

Nasdaq Watch List

Below are the Nasdaq 100 companies that are on our radar.

Nasdaq 100 Watch List: March 27, 2015

Performance Review

Below is the performance of the nine stocks from our March 14, 2014 Nasdaq 100 watch list compared to the performance of the Nasdaq 100 Index gain of +20.50% over the last year.

symbol Name 2014 2015 % chg
CTSH Cognizant Technology Solutions 50.25 63 25.37%
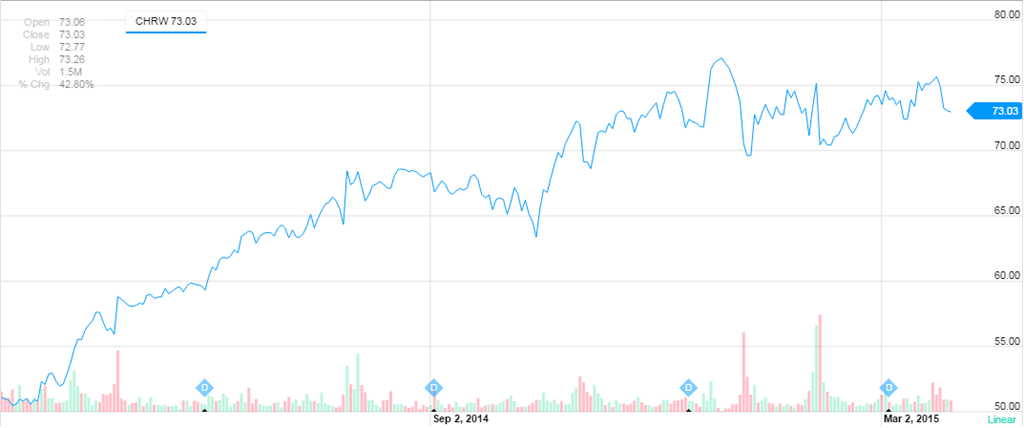
CHRW CH Robinson Worldwide Inc. 51.14 73.03 42.80%
SYMC Symantec Corporation 20.16 23.35 15.82%
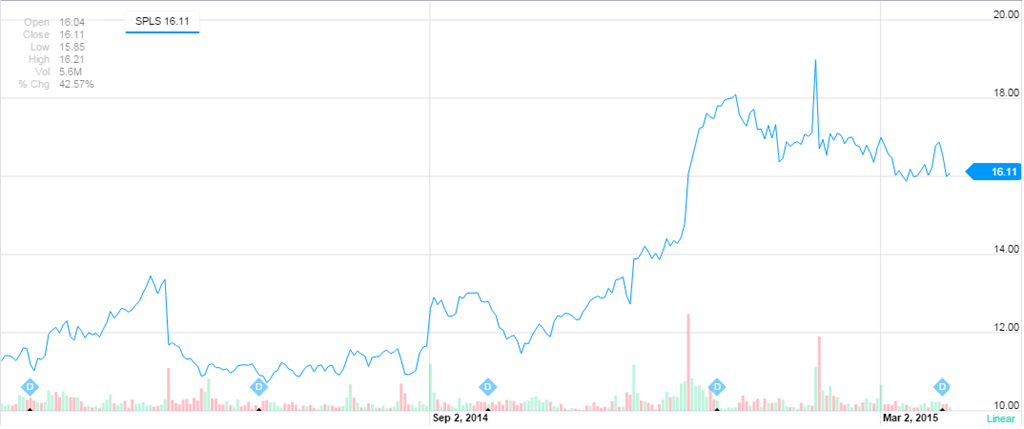
SPLS Staples, Inc. 11.3 16.11 42.57%
CTRX Catamaran Corporation 45.87 48.32 5.34%
MAT Mattel, Inc. 37.28 22.61 -39.35%
CSCO Cisco Systems, Inc. 21.35 27.13 27.07%
average 17.09%

The listed stocks only averaged gains of +17.09% in the last year.  However, the top five stocks averaged gains of +26.38%.  The two top performing stocks, CH Robinson Worldwide and Staples, were highlighted as being of interest to as the time (we bought shares of CHRW).  Of CHRW, we said the following:

“According to Edson Gould’s Altimeter, Robinson Worldwide is trading at an equivalent price to the 2009 low.”

The Altimeter appeared to reflect the fact that the stock was reasonably valued.  CHRW was up as much as +50% in the last year.

image

Regarding Staples (SPLS), we said:

“After bottoming in the last half of 2012, Staples increased by +52% before collapsing to the current level.  Dow Theory suggests that this is a classic retest of the prior lows.”

Since the March 2014 posting, Staples (SPLS) has increased as much as +68%.

image

Nasdaq 100 Watch List

Nasdaq 100 Watch List: February 20, 2015

Below are the seven Nasdaq 100 companies that are on our radar.  We will be adding to our current position in one of the stocks listed below.

Nasdaq 100 Watch List: February 6, 2015

Performance Review

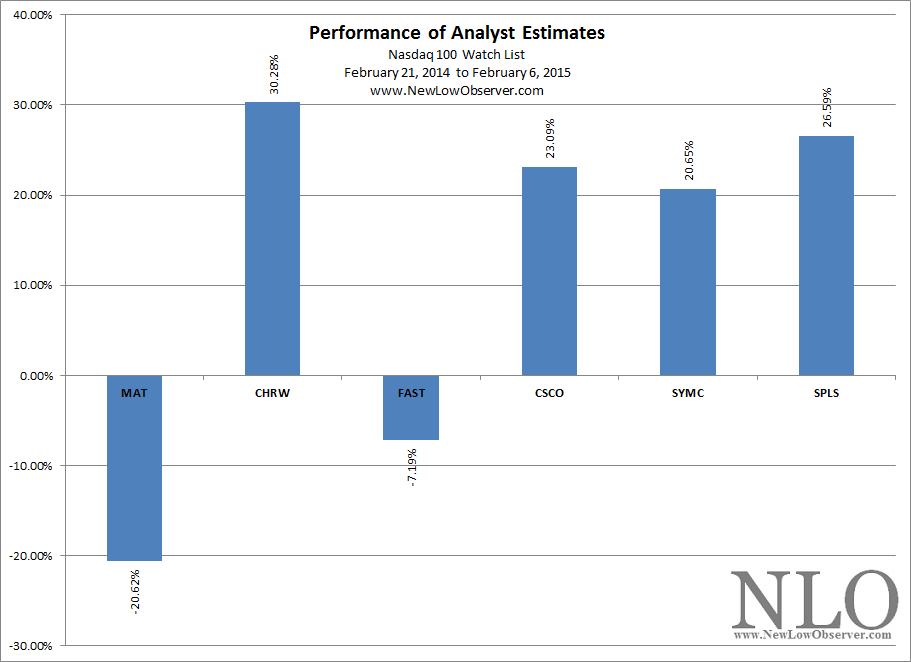
Below is the performance of the six stocks from the February 21, 2014 Nasdaq 100 watch list compared to the Nasdaq 100 Index gain of +15.46%.

Symbol

Name

2014 2015 change
SYMC Symantec Corporation $20.53 $24.77 20.65%
MAT Mattel, Inc. $35.55 $28.22 -20.62%
CHRW CH Robinson Worldwide $54.12 $70.51 30.28%
FAST Fastenal Company $45.61 $42.33 -7.19%
SPLS Staples, Inc. $13.09 $16.57 26.59%
CSCO Cisco Systems, Inc. $22.13 $27.24 23.09%

The average gain for all of the stocks was +12.13%.  Symantec (SYMC) was the stock of interest at the time.  Our thoughts on SYMC were, “…we don’t see why the stock couldn’t decline a bit further until April or May.” In fact, SYMC declined as low as $17.95, a drop of –12.57%.  However, the final low occurred in late March instead of the April/May projection.

At the time of the posting from last year, we outlined the analyst estimated price change for six stocks on our watch list.  The projections were as follows:

image

The actual performance after one year is displayed below.

image

On the whole, it appears that the analysts were correct about the overall trend for the stocks on our watch list.  two of three were (MAT, CHRW and FAST) were expected to be a mixed bag while three of three (CSCO, SYMC and SPLS) were expected to have price increases.

February 6, 2015 Watch List

Below are the 14 Nasdaq 100 companies that are on our radar.  As readers know, we have recently  taken a sizable position in one of the stocks on this list.

Nasdaq 100 Watch List: January 23, 2015

Analyst Estimates

Below are the price projections based on analyst earnings estimates for the stocks on our recent Nasdaq 100 Watch List dated January 9, 2015.  These estimates project the 1 year price change for the respective stocks.

Nasdaq 100 Watch List: January 9, 2015

Performance Review

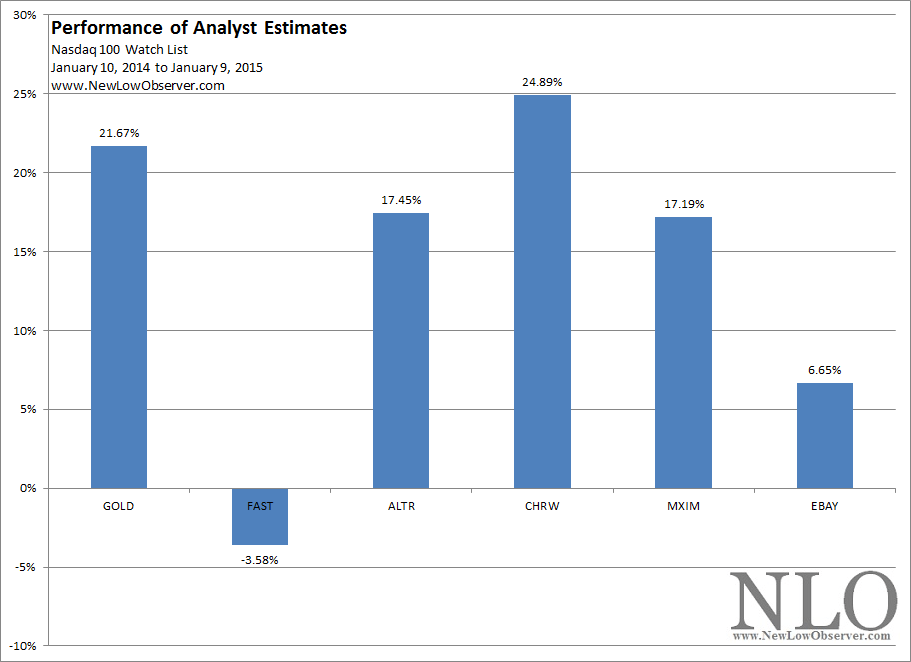
Below is the performance of the seven stocks from the January 10, 2014 Nasdaq 100 watch list compared to the performance of the Nasdaq 100 Index in the last year.

Symbol Name 2014 2015 % change
ALTR Altera Corp. 31.47 36.96 17.45%
SHLD Sears Holdings 36.71 34.3 -6.56%
GOLD Randgold Resources 61.57 74.91 21.67%
MXIM Maxim Integrated Products 28.15 32.99 17.19%
CHRW CH Robinson Worldwide 57.7 72.06 24.89%
EBAY eBay Inc. 52.16 55.63 6.65%
FAST Fastenal Company 47.7 45.99 -3.58%
  Average change 11.10%
         
  Nasdaq 100     18.18%

As a group, the stocks on our list underperformed the Nasdaq 100 by a wide margin. The first five stocks on our list averaged a gain of +14.92%.  Two stocks that we took positions in at the time were Altera (ALTR) and Randgold (GOLD).

Analyst Review

The chart below is what the analysts suggested the stocks would do…

image

…This is the graphical representation of what actually happened.

image

The observation of the data should be clear, the analysts expected declines for the coming year and the opposite occurred.  The projections were that Randgold (GOLD) would decline by nearly –50% and the stock increased by +21.67%.  From our perspective, the analysts provide a reasonable sound board for what to anticipate, as has been demonstrated with our Canadian and U.S. Watch Lists.

Nasdaq 100 Watch List: January 9, 2015

Below are the nine Nasdaq 100 companies that are on our radar.

Nasdaq 100 Watch List: December 26, 2014

Performance Review

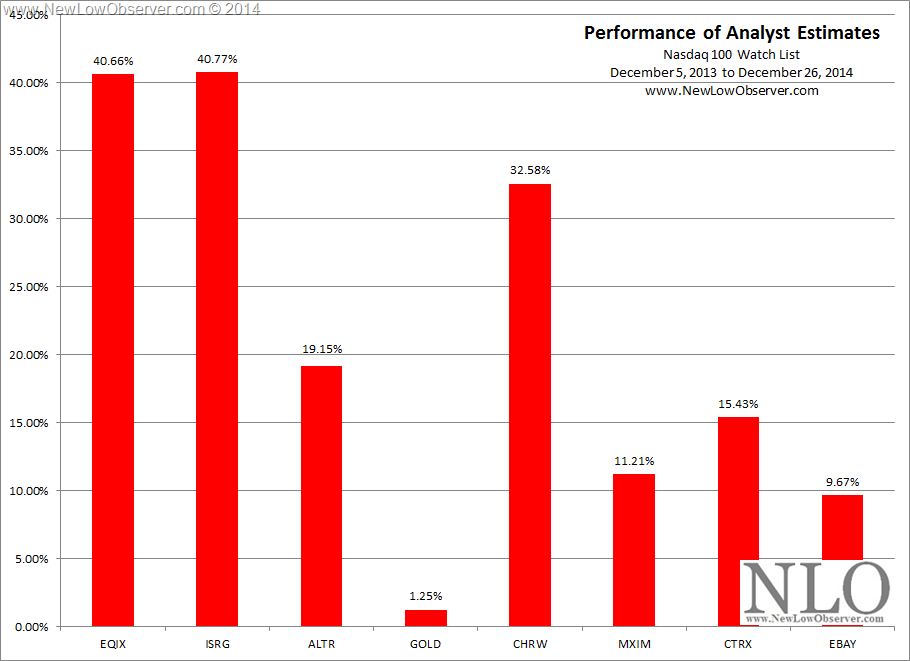
The December 6, 2013 watch list contained the following companies and resulted in the accompanying 1-year results:

Symbol 2013 2014 % change
CTRX 44.99 51.93 15.43%
ALTR 32.12 38.27 19.15%
ISRG 377.38 531.24 40.77%
MXIM 28.46 31.65 11.21%
CHRW 57.89 76.75 32.58%
EBAY 52.01 57.04 9.67%
EQIX 165.48 232.76 40.66%
GOLD 65.44 66.26 1.25%

The companies on our watch list from last year gained an average of +21.34% as compared to the Nasdaq 100 which gained +23.11%.  Our analyst estimate section of the watch list from last year shows what the stock on our list were expected to do over the following 12 months.

image

All of the stocks were expected to decline in value, overall.  However, what is most striking about the one year performance is that while companies on the far left were expected to do the worst those on the far right were expected to the best (sort of).  Below is the actual one year performance:

image

A side by side comparison will demonstrate that (again) the trend of performance favors those stocks that have been pinned with the worst expectations.

Nasdaq 100 Watch List: December 26, 2014

The following stocks are on our radar and should be on yours:

Nasdaq 100 Watch List: December 5, 2014

Performance Review

Below is the watch list from December 6, 2013 and the subsequent performance over the last year:

Symbol Name 2013 2014 % change
CTRX Catamaran  44.99 51.25 13.91%
ALTR Altera Corp. 32.12 37.93 18.09%
ISRG Intuitive Surgical, Inc. 377.38 508.86 34.84%
MXIM Maxim Integrated 28.46 31.36 10.19%
CHRW CH Robinson Worldwide 57.89 74.63 28.92%
EBAY eBay Inc. 52.01 54.81 5.38%
EQIX Equinix, Inc. 165.48 231.68 40.00%
GOLD Randgold Resources 65.44 64.85 -0.90%
Average change 18.80%
Nasdaq 100 Index 23.04%

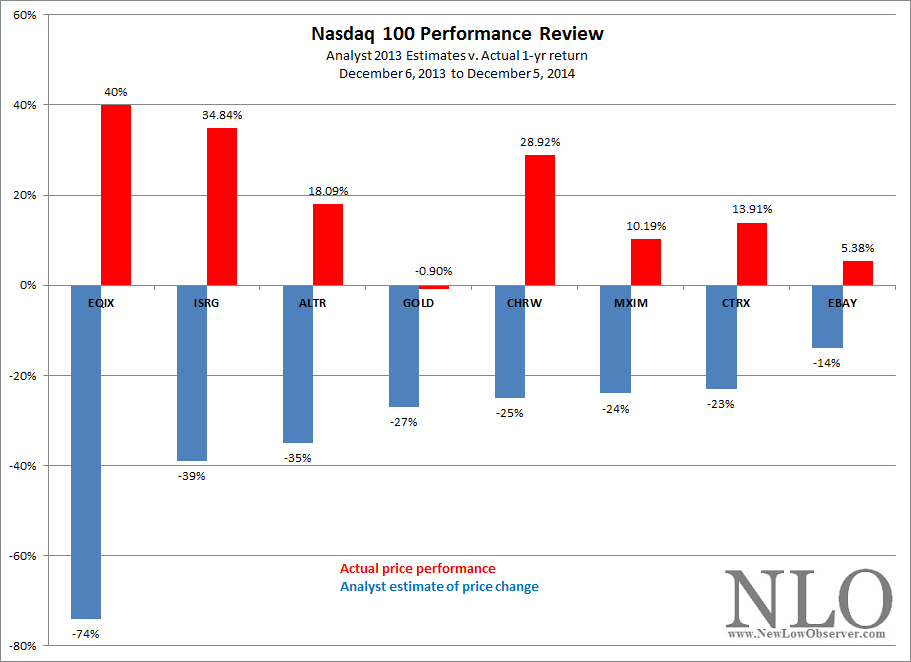
Below is the chart of analyst estimated returns from December 6, 2013 compared to the performance one year later:

image

In the example above, we see that, in general, the stocks performed in opposition to what analysts had anticipated.  It is important to note that we routinely recommend that investors consider the stocks that have the worst prospects first based on analyst estimates.  After appropriate due diligence, stocks deemed unacceptable risks should be eliminated.

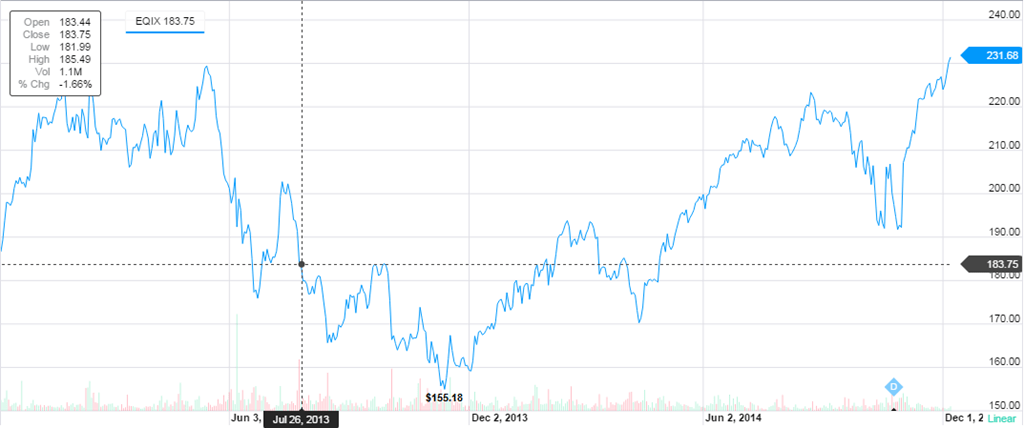
As has been the case for some time, analyst estimates have fallen far from the mark when assessing the prospects for stocks.  At the time, Equinix (EQIX) was considered by analysts to have the worst prospects.  As it happens, Equinix managed to gain the most among the stocks that we tracked last year.  For our part, we had EQIX on our radar as early as July 26, 2013.  We said the following of the stock:

“A stock that is establishing a significant technical pattern is Equinix (EQIX).  It seems that Equinix is developing a ‘head and shoulder’ formation.  this suggests that a further decline below $176 will result in a minimum decline to the conservative downside target of $158.37.  We would consider a review of EQIX fundamentals at or below $110.”

Our concern for downside risk resulted in being too cautious.  However, after our July 26, 2013 commentary, EQIX declined from $183.75 to the Edson Gould SRL conservative downside target of $158.37.  Once achieving the low at $155, EQIX started to make the long climb higher.

image

Nasdaq 100 Watch List: December 5, 2014

The following are the stocks that are on our watch list with Analyst Estimates:

Nasdaq 100 Watch List: August 26, 2014

Below is our watch list with the estimated price targets for the remainder of the year.

Continue reading

Nasdaq 100 Review

Below is the one year performance of our August 23, 2013 Nasdaq 100 Watch List stocks (8/23/2013 to 8/26/2014):

Symbol Name 2013 2014 % change
SHLD Sears Holdings Corp 39.6 34.67 -12.45%
EQIX Equinix, Inc. 170.01 217.25 27.79%
TEVA Teva Pharmaceutical 38.3 52.22 36.34%
CHRW Robinson Worldwide 57.2 68.45 19.67%
EXPE Expedia Inc. 48.84 87.43 79.01%
NUAN Nuance Comm. 19.31 17.17 -11.08%
MXIM Maxim Integrated 27.71 30.91 11.55%
BRCM Broadcom Corp. 25.24 38.81 53.76%
ISRG Intuitive Surgical 390.09 478.68 22.71%
NWSA News Corporation 15.75 17.62 11.87%
Avg. % change 23.92%
NDX Nasdaq 100 Index 30.26%

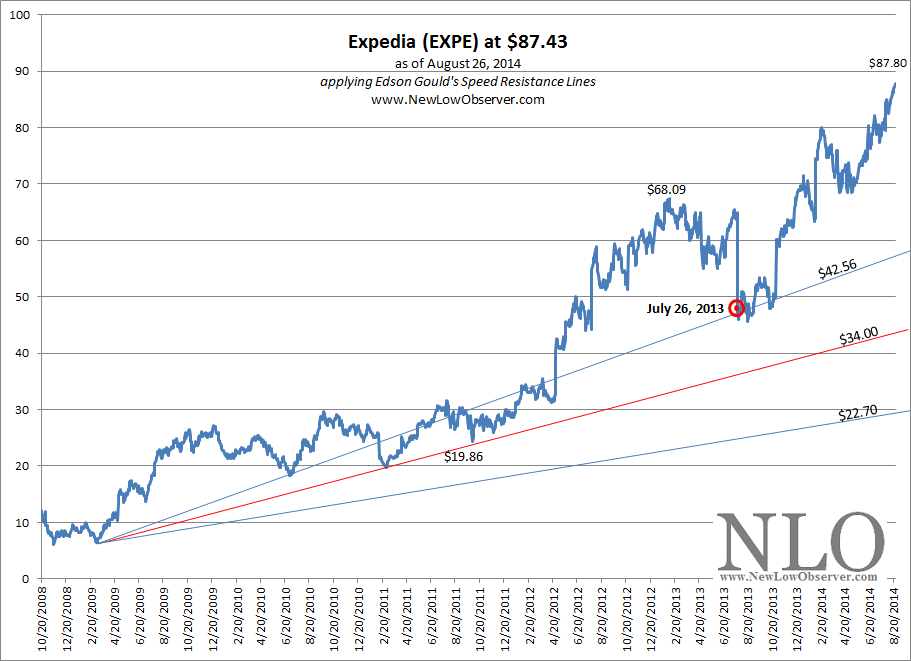
The watch list of stocks gained +23% versus a gain of +30% in the Nasdaq 100 Index.  The best performing stock, with gains of +79%, was Expedia which was a strong interest stock featured on our July 26, 2013 watch list.  At the time, we said the following:

Travel website operator Expedia (EXPE) has suddenly dropped in on our watch list with a –27.38% decline in the stock price on Friday July 26, 2013.  We’re not sure that a –28% decline in quarterly earnings requires a –27% decline in the stock price.  This type of activity suggests that since June 2012, investors had not sufficiently assessed the prospects of the company before acquiring the stock.  Extreme swings in the price indicate that there is more downside risk.

Applying Edson Gould’s Speed Resistance Lines gives us a conservative downside target of $42.56 and an extreme downside target of $22.70.

Our expectation is that there is a good chance that Expedia will decline to the $34 level.  Once falling below $34, Expedia should be reviewed on a fundamental basis as a going concern.  There may be significant opportunity for this stock as the performance has been in line with industry competitors.

As is often the case, we were too conservative in believing that EXPE would achieve the rising $34.00 level.  Instead, EXPE fell exactly to the rising $42.56 level and moved higher from there (updated chart below).

image

Another strong interest stock in the same July 26, 2013 posting, Equinix (EQIX) also fell only as low as the conservative downside target.  From the peak price of $229.02, EQIX spent only four trading days below $158.37.  It has been nothing but an uphill climb since.

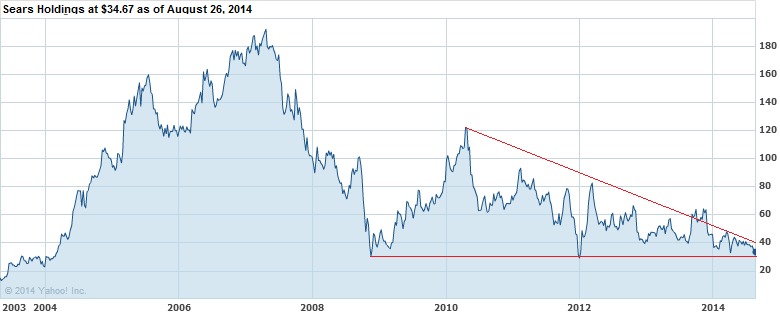
The worst performing stock was Sears Holdings (SHLD).  Sears has essentially traded with descending peaks since 2007 with price support at around $30.  A break below $30 could result in significant loss for any remaining shareholders.  Private equity firms must be circling Sears at the prospect of a decline below the long-term support.

image

The strong interest stock from the August 23, 2013 watch list was Maxim Integrated Products (MXIM). At the time we said of MXIM:

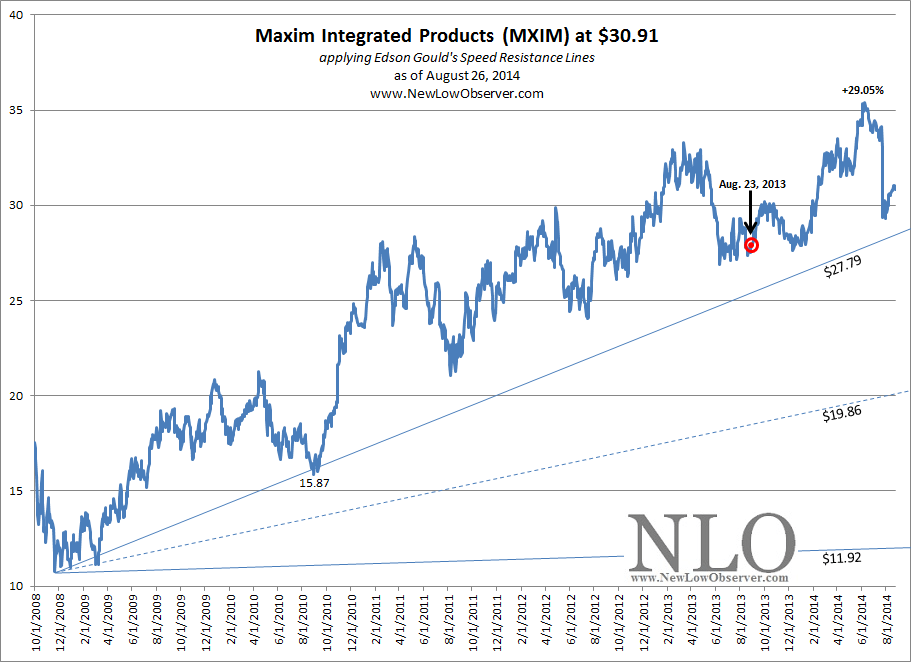
“The stock of most interest to us is Maxim Integrated Products (MXIM).  Maxim has had a great run since our March 20, 2010 highlight of the chip sector as potential investment candidates (found here).  In the chart below, since the 2008 trough, Maxim has maintained a consistent ability to rebound from the conservative downside target of $26.97.  However, if the stock cannot hold the line at $26.91, then we expect that the stock will fall to the $19.03 level.  The extreme downside target is $11.10, however, we don’t expected this to be achieved.  Potential investments at the current level along with stepped up amounts of capital at $19.03 and $15.87 is recommended.”

Since August 23, 2013, Maxim increased as much as +29.05% before falling to a 1-year gain of “only” +11%.  If we include the dividend of 3.80%, the total return would be +15% for the last year.  Below is the updated SRL for MXIM with new conservative and extreme downside targets.

image

Although Maxim has fallen considerably since the June 2014 peak, we’re only willing to re-consider the stock after falling at or below the rising $27.79 level.

Investment Consideration

To put all of the gains (and losses) into perspective, we like to compare any profits with the historical market return.  Below are the annualized compounded annual growth rates (CAGR) for the last 50, 40, 30, 20 and 10 years (adjusted for inflation) [source].

years CAGR
50 5.90%
40 5.80%
30 8.42%
20 6.71%
10 6.67%

If an investor can achieve two times (2x) the 30-year CAGR in a single year, it is worth considering alternative investment opportunities while selling the principal and allowing the profits to compound in those stocks that pay a dividend.