Below is a chart of NetApp (NTAP) from 1996 to 2019 reflecting the year-over-year (YoY) percentage change.
-
Topics
Archives
-
-
Recent Posts
-
-
-
-

Below is a chart of NetApp (NTAP) from 1996 to 2019 reflecting the year-over-year (YoY) percentage change.
Performance Review
Below is the performance of the Nasdaq 100 watch list from May 9, 2014:
| Symbol | Name | 2014 | 2015 | % change |
| DISCA | Discovery Comm. | 37.33 | 31.33 | -16.07% |
| BBBY | Bed Bath & Beyond Inc. | 61.31 | 71.44 | 16.52% |
| ISRG | Intuitive Surgical, Inc. | 353.06 | 494.32 | 40.01% |
| NTAP | NetApp, Inc. | 34.19 | 35.65 | 4.27% |
| EBAY | eBay Inc. | 50.54 | 58.82 | 16.38% |
| ALTR | Altera Corp. | 32.38 | 44.46 | 37.31% |
| WFM | Whole Foods Market, Inc. | 39.32 | 42.58 | 8.29% |
| SIRI | Sirius XM Holdings Inc. | 3.16 | 3.87 | 22.47% |
| VRSK | Verisk Analytics, Inc. | 60.53 | 73.66 | 21.69% |
| COST | Costco Wholesale | 115.39 | 145.88 | 26.42% |
| LMCA | Liberty Media Corp. | 34.18 | 37.93 | 10.97% |
| SRCL | Stericycle, Inc. | 113.90 | 134.01 | 17.66% |
| CERN | Cerner Corporation | 50.19 | 68.02 | 35.53% |
| CA | CA Technologies | 29.41 | 31.60 | 7.45% |
The average gain of the entire list was +17.78% while the top five stocks (DISCA, BBBY, ISRG, NTAP, EBAY) gained an average of +12.22%. This compares with the gain for the Nasdaq 100 index of +23.41% in the same 1-year time period.
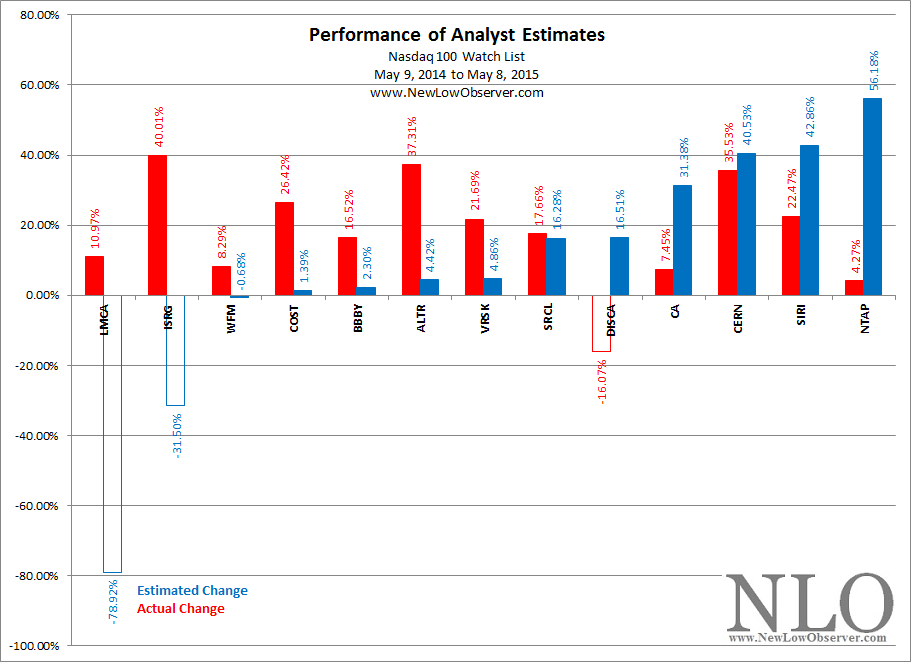
As has frequently been the case, analyst expectations were too optimistic for stocks on the far right (DISCA, CA, CERN, SIRI, NTAP) where the average gains of +10.73%. Likewise, the view was too pessimistic for stocks on the far left (LMCA, ISRG, WFM, COST, BBBY) which averaged +20.44% in the above chart.
The absolute change in Liberty Media (LMCA) and Intuitive Surgical (ISRG) was the most extreme. Liberty Media saw its p/e ratio expand from 20 to 72 while ISRG’s p/e ratio increased from 26 to 39. The increase in the p/e ratio should be expected with the increase in price. However, value oriented investors would have overlooked these stocks simply because of the high p/e ratios and the expectation of lower earnings by analysts in 2014.
Watch List: May 8, 2015
Below are the Nasdaq 100 stocks of interest:
Performance Review
Below is the performance of our April 25, 2014 watch list.
| Symbol | Name | 2014 | 2015 | % chg |
| BBBY | Bed Bath & Beyond Inc. | 62.48 | 72.53 | 16.09% |
| CTRX | Catamaran Corporation | 38.95 | 59.56 | 52.91% |
| SIRI | Sirius XM Holdings Inc. | 3.12 | 3.96 | 26.92% |
| NTAP | NetApp, Inc. | 35.00 | 36.12 | 3.20% |
| ISRG | Intuitive Surgical, Inc. | 366.37 | 505.92 | 38.09% |
| DISCA | Discovery Comm | 39.14 | 32.71 | -16.43% |
| VRSK | Verisk Analytics, Inc. | 57.81 | 72.68 | 25.72% |
| COST | Costco Wholesale | 115.01 | 148.12 | 28.79% |
| ALTR | Altera Corp. | 33.09 | 40.89 | 23.57% |
| SRCL | Stericycle, Inc. | 113.96 | 136.94 | 20.16% |
| CERN | Cerner Corporation | 49.51 | 73.32 | 48.09% |
| ROST | Ross Stores Inc. | 67.77 | 104.38 | 54.02% |
| MAT | Mattel, Inc. | 37.99 | 30.20 | -20.51% |
| DLTR | Dollar Tree, Inc. | 51.36 | 81.14 | 57.98% |
The average return for the entire list was +25.62% compared to the Nasdaq 100 index gaining +28.41% in the same period of time. The top five stocks on our list (BBBY, CTRX, SIRI, NTAP, ISRG) gained +27.44% in the last year (excluding dividends).
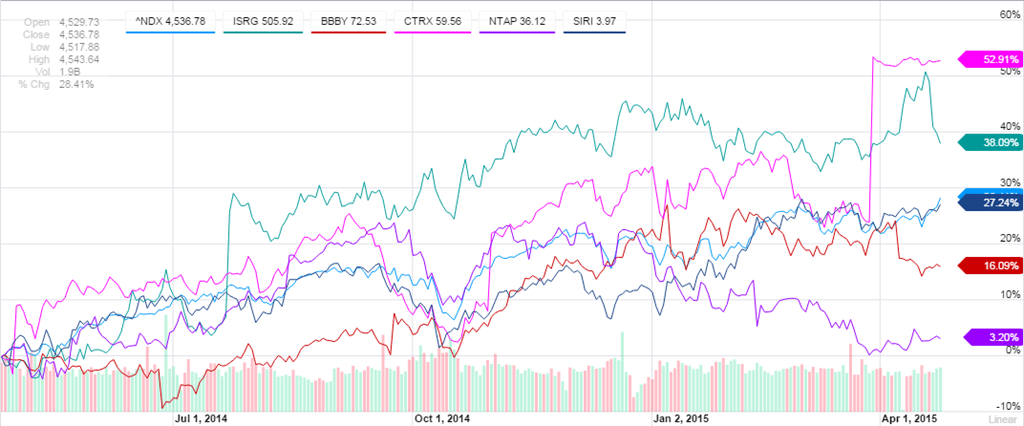
As is common with our watch lists, a stock is being acquired at what we believe is a premium. CTRX is being acquired by UnitedHealth (UNH), a Dow Jones Industrial Average component. At the time of our watch list last year, CTRX was within 3% of the low. Additionally, the announcement of the purchase by UNH followed the pattern of many companies buying the intended target after a gain over of +24% within the year and +177% within the last 5 years.
Nasdaq 100 Watch List: April 24, 2015
Below are the 9 Nasdaq 100 stocks that we think are worth your consideration:
Below are the Nasdaq 100 companies that are within 10% of their respective 52-week lows. Stocks that appear on our watch lists are not recommendations to buy. Instead, they are the starting point for doing your research and determining the best company to buy. Ideally, a stock that is purchased from this list is done after a considerable decline in the price and rigorous due diligence.
| Symbol | Name | Price | P/E | EPS | Yield | P/B | payout ratio | % from low |
| WCRX | Warner Chilcott plc | 11.31 | 7.75 | 1.46 | 4.3 | -4.31 | 34% | 2.53% |
| BIDU | Baidu, Inc. | 88.47 | 20.08 | 4.42 | - | 8.33 | - | 3.23% |
| VOD | Vodafone | 25.87 | - | -0.55 | 4 | 1.13 | -185% | 3.69% |
| BBBY | Bed Bath & Beyond Inc. | 57.79 | 13.43 | 4.3 | - | 3.31 | - | 4.01% |
| MCHP | Microchip Tech | 30.22 | 28.72 | 1.05 | 4.7 | 2.96 | 134% | 4.36% |
| INTC | Intel Corporation | 20.1 | 8.78 | 2.29 | 4.5 | 2.01 | 39% | 4.68% |
| ALTR | Altera Corp. | 31.08 | 17.41 | 1.79 | 1.2 | 3.04 | 22% | 5.24% |
| MSFT | Microsoft Corporation | 26.63 | 14.45 | 1.85 | 3.5 | 3.26 | 50% | 5.72% |
| CTXS | Citrix Systems, Inc. | 60.13 | 32.85 | 1.83 | - | 3.69 | - | 6.31% |
| NVDA | NVIDIA Corporation | 11.95 | 14.92 | 0.8 | 2.5 | 1.58 | 38% | 7.17% |
| EXPD | Expeditors Int'l of WA | 36.78 | 22.97 | 1.6 | 1.5 | 3.76 | 35% | 7.46% |
| SPLS | Staples, Inc. | 11.37 | - | -0.01 | 3.9 | 1.23 | -4400% | 7.85% |
| FLEX | Flextronics Int'l | 5.9 | 8.04 | 0.73 | - | 1.61 | - | 7.86% |
| KLAC | KLA-Tencor Corp. | 46.53 | 11.34 | 4.11 | 3.4 | 2.3 | 39% | 7.87% |
| ATVI | Activision | 11.28 | 14.59 | 0.78 | 1.6 | 1.15 | 23% | 8.23% |
| AMAT | Applied Materials | 10.76 | 125.35 | 0.09 | 3.3 | 1.82 | 400% | 8.34% |
| DLTR | Dollar Tree, Inc. | 40.28 | 16.21 | 2.49 | - | 5.99 | - | 8.66% |
| APOL | Apollo Group Inc. | 20.18 | 5.8 | 3.48 | - | 2.47 | - | 9.86% |
| ^NDX | NASDAQ-100 | 2,649.12 | - | - | - | - | - | 23.16% |
Watch List Summary
We’ve highlighted the chip sector stocks to put emphasis on the fact that, as an industry group, the sector may be at or near a low. The last time we made this observation of the chip sector was on March 20, 2010 based on the closing price of March 19, 2010 (found here). The average return of the chips stocks on that watch list was +21.95% as compared to the Philadelphia Semiconductor Index (SOX) gain of +17.86% over the following year. After the first year had passed (March 18, 2011-present), the same semiconductors stocks have average a loss of –8.98% as compared to the SOX index decline of –10.67% (see chart below).
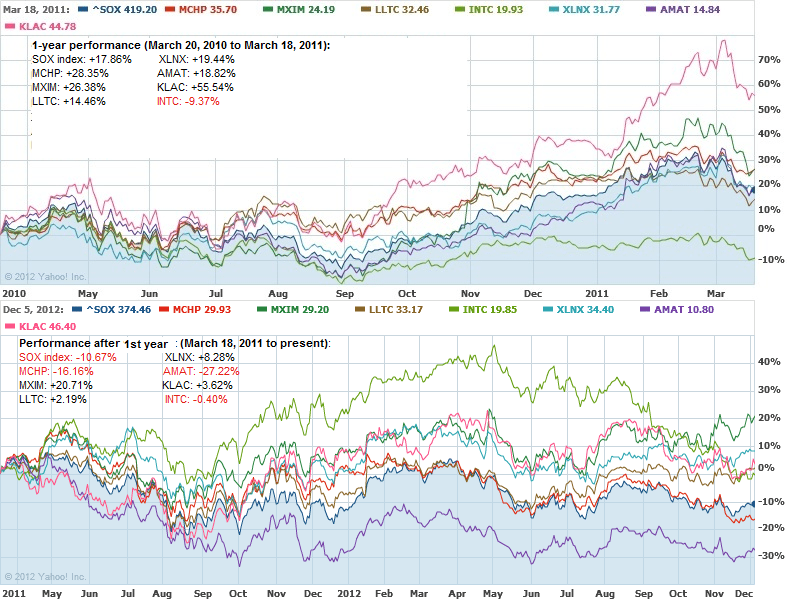
Within the first year (March 20,2010-March 18, 2011), all of the stocks on our list except Intel (INTC) managed to achieve gains of over +20% before falling lower. After the first year had passed (March 18, 2011-present), only MXIM and KLAC were able to achieve gains of +20% while INTC was the only stock to rise above +40%. Depending on the timing of the purchase, we wouldn’t be surprised to see the same performance of the chip related stocks on our current watch list.
Watch List Performance Review
In our ongoing review of the Nasdaq 100 Watch List, we have taken the top five stocks from our list of November 18, 2011 (found here) and have checked their performance one year later. The companies on that list are provided below with the closing prices from November 17, 2011 to November 16, 2012.
| Symbol | Name | 2011 | 2012 | % change |
| CTRP | Ctrip.com | 26.67 | 17.58 | -34.08% |
| BMC | BMC | 36.26 | 38.73 | 6.81% |
| NTAP | NetApp | 35.73 | 30.26 | -15.31% |
| QGEN | Qiagen | 13.71 | 17.16 | 25.16% |
| CHRW | Robinson Worldwide | 65.65 | 59.16 | -9.89% |
| Average | -5.46% | |||
| ^NDX | Nasdaq 100 | 2272.09 | 2534.16 | 11.53% |
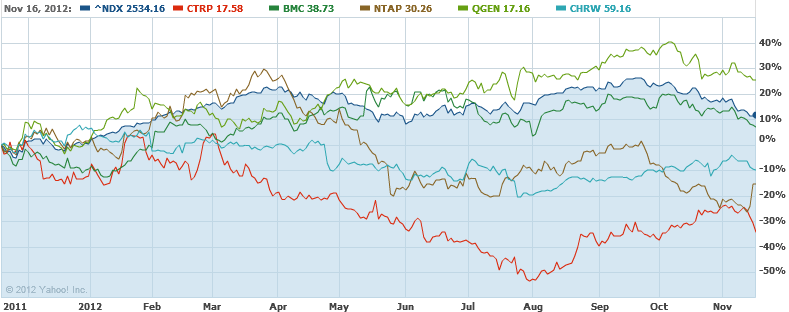
As can easily be seen by the table above, after one year the top five stocks severely underperformed the representative Nasdaq 100 index. However, three of the five stocks gained +10% or more within the first six months.
The disastrous performance of Ctrip.com (CTRP), declining over –50%, was highlighted well in advance in our December 16, 2011 posting (found here). At that time (CTRP at $23.10) we said the following:
“Ctrip.com International (CTRP) is on a pace to replicate the performance from the high in April 2008 to the low of January 2009 which equaled a loss of 72%. A similar decline in CTRP from the high of $50.57 would bring the price down to $14.16. Suffice to say, the stock “only” needs to decline another $8.94 or 38% from the current price of 23.10. This seems very easy considering the high volatility of Chinese stocks. We believe that unless CTRP is summarily dismissed from the Nasdaq 100 index, there may yet be life in this company.
We believe that the Nasdaq 100 committee added CTRP to the index based on the performance of Priceline.com (PCLN). Amazingly, at the current price of $23.10, CTRP sits one penny below the 2nd Dow Theory support level of $23.11. any further deviation below the current price almost ensures that the stock is destined for the $10 range.”
At its lowest point, Ctrip.com fell as low as $12.36 on July 30, 2012. We feel that our analysis, based on Dow Theory provided appropriate warning on the downside risk.
Another stock that severely underperformed in the last year was NetApp (NTAP). However, our initial analysis of the company on January 20, 2012 (found here) we said the following:
After a 39% decline in price, NetApp (NTAP) is a prime candidate for a two transaction purchase. The first purchase should take place starting at $30. The second purchase should take place around $23.47. Based on the market capitalization of NTAP may actually be a buyout candidate.
In May 2012, NTAP briefly fell below $30 and then rose +20% by the month of September 2012. Then on November 2, 2012 (found here), we recommended that investors consider buying NTAP ($27.74). Since our November 2, 2012 recommendation, NTAP has risen +18.28%. In all the history of the stock market over a 100-year, 50-year, and 30-year period, gains like these are exceptional on an annual basis and should be considered gifts in a months time.
We ask that you consider selling the principal and allow the gains to run. Keep in mind that we believe that stock is a buyout candidate. However, Dow Theory says that the wish should not become father to the the thought (source: Hamilton, William Peter. The Stock Market Barometer. Harper & Brothers, New York. 1922. page 133).
Comments Off on Nasdaq 100 Watch List: December 6, 2012
Posted in BBBY, BIDU, chip manufacturers, CTRP, mchp, Nasdaq 100 Watch List, NTAP, VOD, WCRX
Below are the Nasdaq 100 companies that are within 10% of their respective 52-week lows. Stocks that appear on our watch lists are not recommendations to buy. Instead, they are the starting point for doing your research and determining the best company to buy. Ideally, a stock that is purchased from this list is done after a considerable decline in the price and rigorous due diligence.
| Symbol | Name | Price | P/E | EPS | Yield | P/B | % from low |
| WCRX | Warner Chilcott plc | 11.47 | 10.07 | 1.14 | 0 | 13.28 | 0.35% |
| DELL | Dell Inc. | 9.15 | 5.45 | 1.68 | 3.5 | 1.66 | 0.44% |
| BBBY | Bed Bath & Beyond Inc. | 57.1 | 13.27 | 4.3 | - | 3.31 | 0.67% |
| FFIV | F5 Networks, Inc. | 82.59 | 23.94 | 3.45 | - | 5.1 | 1.87% |
| ALTR | Altera Corp. | 30.51 | 17.05 | 1.79 | 1.3 | 3.1 | 3.11% |
| APOL | Apollo Group Inc. | 19.78 | 5.69 | 3.48 | - | 2.43 | 3.13% |
| NTAP | NetApp, Inc. | 27.74 | 19.58 | 1.42 | - | 2.33 | 3.39% |
| INTC | Intel Corporation | 22.06 | 9.62 | 2.29 | 4.1 | 2.26 | 3.96% |
| ATVI | Activision Blizzard, Inc. | 11.16 | 15.9 | 0.7 | 1.6 | 1.18 | 4.00% |
| VOD | Vodafone Group Public Limited Company | 26.91 | 12.29 | 2.19 | 7.4 | 1.1 | 4.99% |
| FLEX | Flextronics International Ltd. | 5.74 | 7.81 | 0.74 | - | 1.61 | 5.32% |
| BIDU | Baidu, Inc. | 105.09 | 23.78 | 4.42 | - | 10.09 | 5.40% |
| MCHP | Microchip Technology Inc. | 32.14 | 20.75 | 1.55 | 4.4 | 3.12 | 6.32% |
| NVDA | NVIDIA Corporation | 12.49 | 16.46 | 0.76 | - | 1.75 | 7.39% |
| EXPD | Expeditors International of Washington Inc. | 36.91 | 21.97 | 1.68 | 1.5 | 3.83 | 7.92% |
| AMAT | Applied Materials Inc. | 10.81 | 12.98 | 0.83 | 3.3 | 1.62 | 8.43% |
| SPLS | Staples, Inc. | 11.47 | 8.64 | 1.33 | 3.8 | 1.18 | 8.51% |
| GRMN | Garmin Ltd. | 37.5 | 12.67 | 2.96 | 4.8 | 2.19 | 8.98% |
| MRVL | Marvell Technology Group Ltd. | 7.98 | 10.22 | 0.78 | 3 | 0.94 | 9.02% |
| DLTR | Dollar Tree, Inc. | 39.59 | 17.63 | 2.24 | - | 6.11 | 9.85% |
| MNST | Monster Beverage Corporation | 44.03 | 24.6 | 1.79 | - | 6.68 | 9.91% |
Watch List Summary
The top stock on our list is Warner Chilcott (WCRX). On April 30, 2012, we recommended that investors sell WCRX after a +50% increase in the stock price from our December 16, 2011 watch list. Since our recommendation to sell WCRX, the stock has declined -47.41%.
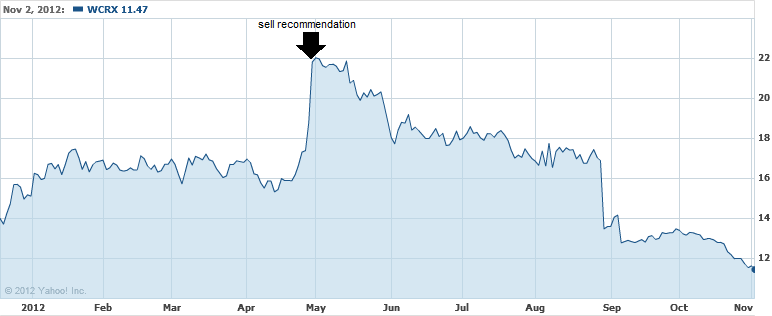
We believe that WCRX will declined to the $10 level before it is worth reconsidering the value attributes of this company.
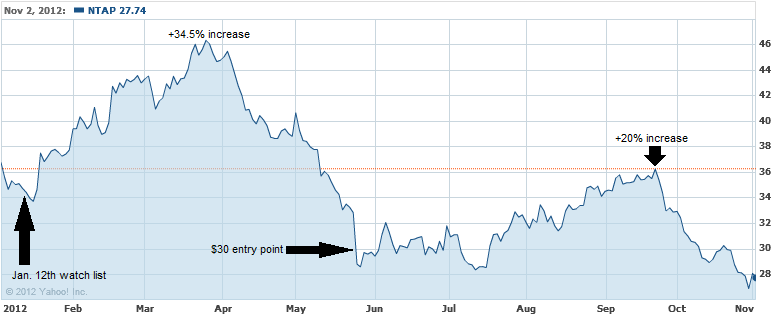
On January 12, 2012, we assessed the points at which an investor could take advantage of the decline of NetApp (NTAP). At the time, NTAP was trading at $36.85 and we suggested that the stock would be a good buy at $30 and $23.47. Afterwards, NTAP increased +34.5% to the March high and the fell below the Jan. 12th price. After falling slightly below the $30 level, NTAP rose +20% to the September high. Anyone who has not participated in the $30 purchase price can do so at the current price and potentially at the $23.47 level.
Nasdaq 100 and Apple Inc.
The most important aspect of the movement of the Nasdaq 100 (NDX) is the impact that Apple Inc. (AAPL) has on the index. Below you can see a comparison between the index and the stock.
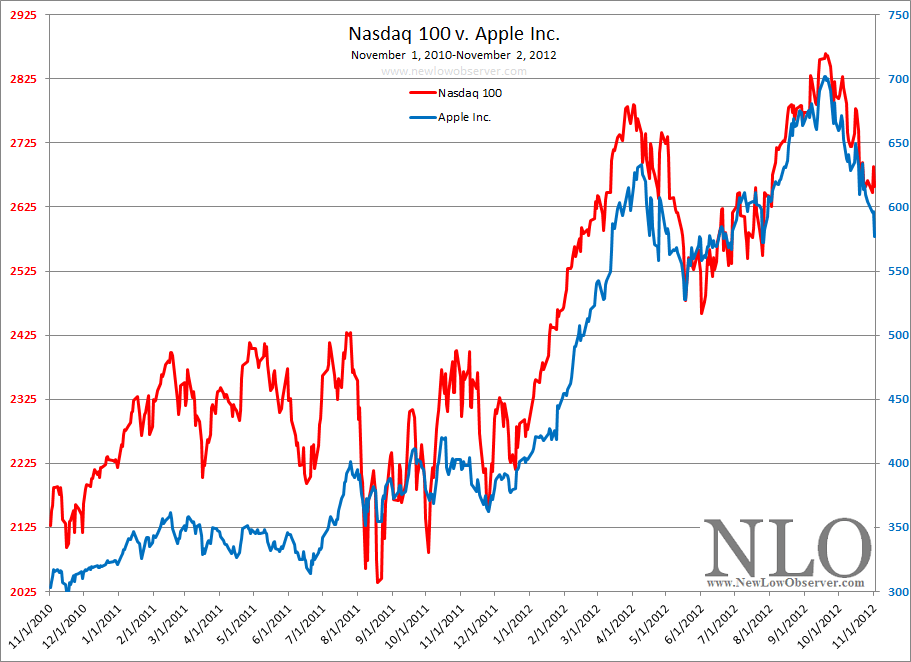
The high level of correlation that exists between the Nasdaq 100 and Apple, since mid-2011, suggests that the tail is wagging the dog and should result in the index declining further if any negative news comes from Apple. Strictly from a technical standpoint, it would not be unusual for AAPL to retest the May 2012 lows before recovering in price. In addition, we believe that Apple Inc. could retest the conservative downside target of $312.87 based on the revised Speed Resistance Line below:
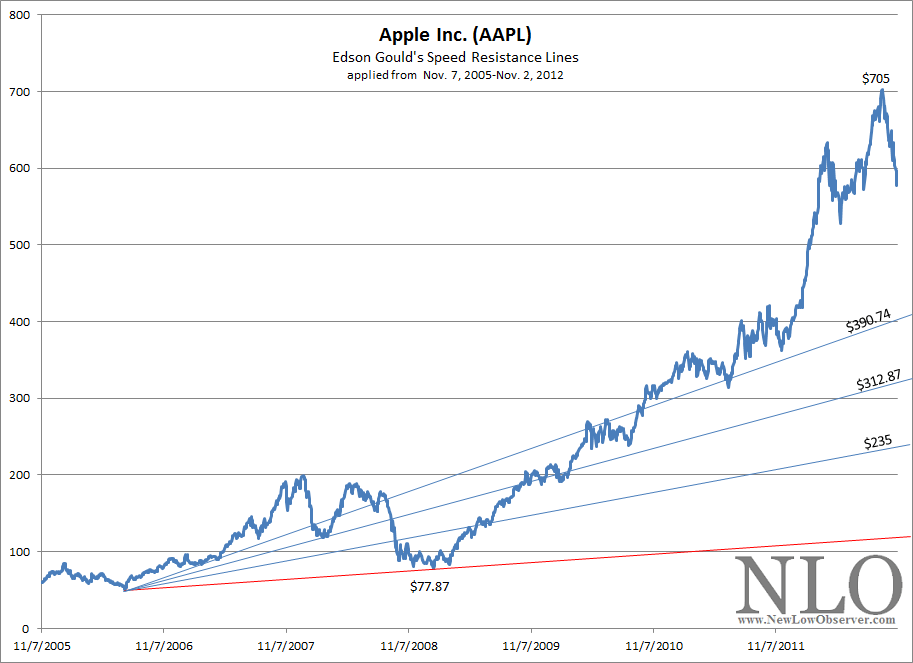
In order to understand where the Nasdaq 100 might go, consideration of Apple Inc. (AAPL) is required.
Watch List Performance Review
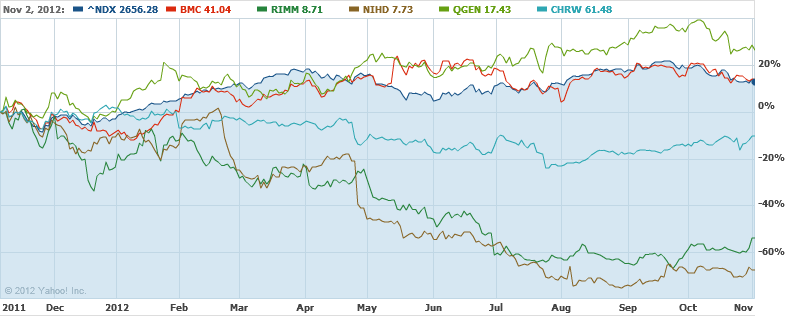
In our ongoing review of the Nasdaq 100 Watch List, we have taken the stocks from our list of November 4, 2011 (found here) and have checked their performance one year later. The top five companies on that list are provided in the chart below from November 4, 2011 to November 2, 2012.
Posted in AAPL, Nasdaq 100 Watch List, NDX, NTAP, WCRX