Category Archives: AAPL

Walgreen and Apple

Below is a comparison of the performance of Apple (AAPL) against Walgreen (WAG) from the IPO of Apple back in December 1980.  Circled in red is the total return of Walgreen at +13,636.70% versus +9,991.43% for Apple.

image

While there is no doubt that Apple has been a great investment in the last ten years, on a relative basis, Apple has been dead money from the IPO in 1980 to 2003.  Walgreen on the other hand, by virtue of the dividend and consistent growth, has generated exceptional total returns from the word “go”.

This is the focus of our U.S. Dividend Watch List which is the foundation of our investment strategy.

February Ex-Dividend Dates

Below are the approximate ex-dividend dates for the month of February 2013 for companies that appear on our U.S. Dividend, Nasdaq 100, Dow Jones Transportation/Industrial Index and International Dividend Watch Lists. All companies are ranked by ex-dividend dates.

Companies that show up on our Watch Lists could be considered the equivalent of the bargain bin of high quality blue chip stocks. Because these companies have increased their dividends every year for at least 10 years in a row (or have had similar dividend policies in the past) or are part of major indexes and within 20% of their respective 52-week low, you know that you’re not overpaying for a company that has demonstrated profitability and the ability to rebound from challenging times.

Symbol Company Price % from yr low Qtrly Yield payout ratio Ex-date
(IBM) International Business Machines $203.19 11.71% 0.43% 23.66% 2/6/2013
(AA) Alcoa Inc. $8.93 12.17% 0.33% 66.67% 2/6/2013
(FNFG) First Niagara Financial Group Inc. $7.98 12.41% 1.00% 80.00% 2/6/2013
(BBT) BB&T Corporation $30.92 15.04% 0.75% 34.07% 2/6/2013
(CWT) California Water Service Group $19.36 14.99% 0.80% 58.72% 2/7/2013
(XOM) Exxon Mobil Corporation $89.79 16.31% 0.63% 23.51% 2/7/2013
(ALTR) Altera Corp. $34.49 16.46% 0.30% 23.26% 2/7/2013
(SJW) SJW Corp. $26.45 17.24% 0.65% 59.84% 2/7/2013
(WBS) Webster Financial Corp. $22.44 18.64% 0.45% 21.51% 2/8/2013
(AAPL) Apple Inc. $455.49 4.44% 0.58% 24.03% 2/11/2013
(STBA) S&T Bancorp Inc. $18.47 17.79% 0.80% 50.85% 2/12/2013
(MSEX) Middlesex Water Co. $19.51 11.96% 0.95% 87.21% 2/13/2013
(UMH) UMH Properties Inc. $10.38 12.45% 1.75% 514.29% 2/13/2013
(BRCM) Broadcom Corp. $32.56 13.81% 0.33% 35.20% 2/13/2013
(BA) The Boeing Company $76.20 13.96% 0.65% 37.96% 2/13/2013
(DD) E. I. du Pont de Nemours $47.77 14.74% 0.90% 58.31% 2/13/2013
(GRC) Gorman-Rupp Co. $29.88 17.13% 0.33% 28.37% 2/13/2013
(RBA) Ritchie Bros. Auctioneers $21.18 18.87% 0.55% 62.03% 2/13/2013
(EGN) Energen Corp. $47.80 19.21% 0.30% 16.52% 2/13/2013
(PRK) Park National Corp. $65.80 8.55% 1.43% 77.05% 2/20/2013
(MHP) The McGraw-Hill Companies, Inc. $46.99 12.91% 0.48% 37.09% 2/22/2013
(BOH) Bank of Hawaii Corporation $48.36 16.74% 0.93% 49.05% 2/26/2013
(CTWS) Connecticut Water Service Inc. $29.38 9.78% 0.83% 61.78% 2/27/2013
(TRMK) Trustmark Corporation $23.48 12.84% 0.98% 50.83% 2/27/2013
(MCD) McDonald's Corp. $95.29 14.33% 0.80% 57.46% 2/27/2013
(AJG) Arthur J Gallagher & Co. $37.88 12.12% 0.93% 88.05% 2/28/2013
 

Watch List Summary

The first stock on our list is IBM (IBM).  After our April 19, 2012 titled “What Does Warren Buffett See In IBM?” (found here) the stock has been in a consolidation pattern.  Despite the critics, IBM managed to fall within 5% of the 52-week low on November 14, 2012.  With the stock currently trading within 12% of the 1-year low and a healthy payout ratio of  24%, the stock is well positioned for those interested in long-term positions.  We’re including an updated version of Edson Gould’s Altimeter which suggests that IBM is significantly undervalued based on the on dividend relative to the stock price.

image

According to Gould’s Speed Resistance Lines, IBM has the downside targets of $137.45 and $72.

Another notable stock on our list is Apple with an ex-dividend date of February 11, 2013.  On April 14, 2012, we projected the conservative downside target for Apple (AAPL) at $424.15 and the extreme downside target of $212.08 (found here).  On an intraday basis, Apple fell within 3% of our April 2012 conservative downside target.  Regardless of the market conditions, according to Dow Theory, Apple has upside targets of $528.28 and $616.68 before re-testing the previous highs.

If you happen to be researching these companies for potential investment, it would be advisable to consider the ex-dividend date prior to possible purchases. Owning the shares of the company that you're interested in before the ex-dividend date entitles you to the upcoming dividend payment.

Owning the shares on or after the ex-dividend date means that you would have to wait at least three months before receipt of the next dividend payment. Please verify the ex-dividend date and payout ratio before committing funds to these stocks. Additionally, do not base your next long or short-term purchase on the dividend payment or yield. Instead, get as much research in as you possibly can before the ex-dividend date "just in case" you're actually interested in buying the stock. Payout ratios that exceed 100% should be considered speculative investments.

Nasdaq 100 Watch List: January 25, 2013

Below are the Nasdaq 100 companies that are within 10% of their respective 52-week lows. Stocks that appear on our watch lists are not recommendations to buy. Instead, they are the starting point for doing your research and determining the best company to buy. Ideally, a stock that is purchased from this list is done after a considerable decline in the price and rigorous due diligence.

Continue reading

Apple’s Downside Targets Revised

Since our last article on Apple (AAPL), on April 14, 2012, and upon further review, it was revealed that our downside targets based on Edson Gould’s Speed Resistance Lines were actually too optimistic. Below is the revised downside targets:

image 

The revised conservative downside target is $312.53 while the extreme downside target is $235.02.  Our previous downside target, from our April 14, 2012 posting (found here), was found to have errors in the $424.15 and $117.05 figures.

What stands out is the fact that Apple (AAPL) has declined significantly below the $530 support level (red arrows) that was initially established, retested  and then violated to the downside.  All that seems to remain on the downside, before the next support level, is at the $422 range.

The current revision suggests that there is a lot further to go on the downside. However, as Apple is no ordinary company neither is it an ordinary stock.

Nasdaq 100 Watch List: November 2, 2012

Below are the Nasdaq 100 companies that are within 10% of their respective 52-week lows. Stocks that appear on our watch lists are not recommendations to buy. Instead, they are the starting point for doing your research and determining the best company to buy. Ideally, a stock that is purchased from this list is done after a considerable decline in the price and rigorous due diligence.

Symbol Name Price P/E EPS Yield P/B % from low
WCRX Warner Chilcott plc 11.47 10.07 1.14 0 13.28 0.35%
DELL Dell Inc. 9.15 5.45 1.68 3.5 1.66 0.44%
BBBY Bed Bath & Beyond Inc. 57.1 13.27 4.3 - 3.31 0.67%
FFIV F5 Networks, Inc. 82.59 23.94 3.45 - 5.1 1.87%
ALTR Altera Corp. 30.51 17.05 1.79 1.3 3.1 3.11%
APOL Apollo Group Inc. 19.78 5.69 3.48 - 2.43 3.13%
NTAP NetApp, Inc. 27.74 19.58 1.42 - 2.33 3.39%
INTC Intel Corporation 22.06 9.62 2.29 4.1 2.26 3.96%
ATVI Activision Blizzard, Inc. 11.16 15.9 0.7 1.6 1.18 4.00%
VOD Vodafone Group Public Limited Company 26.91 12.29 2.19 7.4 1.1 4.99%
FLEX Flextronics International Ltd. 5.74 7.81 0.74 - 1.61 5.32%
BIDU Baidu, Inc. 105.09 23.78 4.42 - 10.09 5.40%
MCHP Microchip Technology Inc. 32.14 20.75 1.55 4.4 3.12 6.32%
NVDA NVIDIA Corporation 12.49 16.46 0.76 - 1.75 7.39%
EXPD Expeditors International of Washington Inc. 36.91 21.97 1.68 1.5 3.83 7.92%
AMAT Applied Materials Inc. 10.81 12.98 0.83 3.3 1.62 8.43%
SPLS Staples, Inc. 11.47 8.64 1.33 3.8 1.18 8.51%
GRMN Garmin Ltd. 37.5 12.67 2.96 4.8 2.19 8.98%
MRVL Marvell Technology Group Ltd. 7.98 10.22 0.78 3 0.94 9.02%
DLTR Dollar Tree, Inc. 39.59 17.63 2.24 - 6.11 9.85%
MNST Monster Beverage Corporation 44.03 24.6 1.79 - 6.68 9.91%

Watch List Summary

The top stock on our list is Warner Chilcott (WCRX).  On April 30, 2012, we recommended that investors sell WCRX after a +50% increase in the stock price from our December 16, 2011 watch list.  Since our recommendation to sell WCRX, the stock has declined -47.41%.

image

We believe that WCRX will declined to the $10 level before it is worth reconsidering the value attributes of this company.

On January 12, 2012, we assessed the points at which an investor could take advantage of the decline of NetApp (NTAP).  At the time, NTAP was trading at $36.85 and we suggested that the stock would be a good buy at $30 and $23.47.  Afterwards, NTAP increased +34.5% to the March high and the fell below the Jan. 12th price.  After falling slightly below the $30 level, NTAP rose +20% to the September high.  Anyone who has not participated in the $30 purchase price can do so at the current price and potentially at the $23.47 level.

image

Nasdaq 100 and Apple Inc.

The most important aspect of the movement of the Nasdaq 100 (NDX) is the impact that Apple Inc. (AAPL) has on the index.  Below you can see a comparison between the index and the stock.

image

The high level of correlation that exists between the Nasdaq 100 and Apple, since mid-2011, suggests that the tail is wagging the dog and should result in the index declining further if any negative news comes from Apple.  Strictly from a technical standpoint, it would not be unusual for AAPL to retest the May 2012 lows before recovering in price.  In addition, we believe that Apple Inc. could retest the conservative downside target of $312.87 based on the revised Speed Resistance Line below:

image

In order to understand where the Nasdaq 100 might go, consideration of Apple Inc. (AAPL) is required.

Watch List Performance Review

In our ongoing review of the Nasdaq 100 Watch List, we have taken the stocks from our list of November 4, 2011 (found here) and have checked their performance one year later. The top five companies on that list are provided in the chart below from November 4, 2011 to November 2, 2012.

image

“Apple-Less Dow” is a Good Thing

An article titled “Apple-less Dow faces changes to make-up,” found in the Financial Times, suggests that the current owners responsible for the composition of the Dow Industrials are considering ways to make it possible to add Apple (AAPL) to the 116-year old index. The myopic view of changing the Dow Industrials simply for the purpose of adding AAPL will haunt the index managers and investors alike.

In the past, the changes in the composition of the Dow have been ill-timed to begin with.  In our article titled "Dow Jones' Decline Largely Impacted by Index Changes," we highlight the fact that composition changes routinely negatively impacted the Dow Industrials. Additionally, we have demonstrated that the changes to the Dow Industrials from 1929 to 1932 was the sole contributor to the decline of the index by -89%, when compared to the Barron's 50 Index in the same time frame.

In a follow-up article titled “After the Crash, Recovery was Faster Than Most People Think” we show how the irresponsible changes to the Dow Industrials from 1929 to 1932 was the reason for the index to take 25 years to get back to the 1929 high.

We’ve shown that many high quality stocks (the purpose of the Dow Industrials is to represent “high quality” stocks) were able to reach their 1929 high in 8-9 years instead of 25 years like with the Dow Industrials (as reflected in the Monsanto Chart below).  The extended delay in getting back to the prior high was due solely to a losing trader's mentality of buying high and selling low applied to addition and subtractions to the Dow Industrials.

The recent addition of Unitedhealth Group (UNH) to the Dow Industrial Average, replacing Kraft Foods (KFT) exemplifies the "buy" high mentality of those who manage the index. United Health is being added after nearly 215% gains in the stock since the March 2009 low. This compares to "only" a 100% gain in Kraft Foods since the same starting point, see chart below.

image

To emphasize our point, since the March 9, 2009 low, the following are the major index returns:

  • NYSE Composite: +98.22%
  • Dow Industrials: +107.41%
  • S&P 500: +115.98%
  • Dow Tranports: +128.74% (does not contain AAPL)
  • Russell 2000: +149.23% (does not contain AAPL)
  • Nasdaq Composite: +150.66%

As the theory goes, the performance of a well diversified index should achieve moderate gains and moderate declines.  The Dow Industrials have performed as though it was a well diversified index, rather than one composed of only 30 companies.  On the flip side of the diversification theory, a highly concentrated portfolio should have higher volatility both up and down.  For a sense of perspective, the Russell 2000 does not contain Apple while the Nasdaq Composite does.  The absence of Apple in the Russell index did not inhibit its ability to effectively match the performance of the Nasdaq Composite.

As we’ve pointed out in our article titled “Broader Market And Dow Theory Suggest Proceeding With Caution,” if the Value Line Geometric Index is any indication, broad participation of the rise from 2009 is faltering (see chart below).

image

This is a warning that the narrow focus on a few companies at the top (based strictly on market cap) is going to collapse upon itself or more focus on values not related to the largest cap stocks is necessary.  Market history suggests that broad based equal-weighted indexes that don't make new highs is the canary in the coal mine.  Anyone seeking Apple’s (AAPL) inclusion to the Dow Industrials are fated to repeat the mistakes of the past with unsurprising outcomes to follow.

Considering the Downside Prospects for Apple

For the New Low Observer team, it has been an uneventful period in our watch of Apple Inc. (AAPL) stock since February 5, 2012 even though the price has risen nearly 40%.  What in the world would we consider eventful in regards to Apple stock? Well, we’d  like to see Apple hit one of Edson Gould’s speed resistance line downside targets.  The chart below is an update of the one that we submitted earlier this year (found here).

image

The new downside targets are as follows:

  • $424.15
  • $297.43
  • $212.08

Based on the current run in Apple Inc. stock, the Dow Theory fair value is $275.44. (636.23-85.35)/2=275.44

As we said on February 5, 2012, “the rampant enthusiasm for AAPL suggests that the stock isn't likely to decline to the indicated levels any time soon.” This has definitely been the case with the impressive run up since the beginning of the year.

In order to diffuse the legitimate claims that we’re grasping at straws simply to make a bearish case against Apple Inc., we’ve provided the price performance of the stock over a similar 7-year period from December 19, 2000 to December 31, 2007 applying Edson Gould's speed resistance lines, in the chart below.

image

What stands out the most in the period from 2000-2007 is the percentage increase in Apple’s stock price compared to the current run-up as indicated below:

  • 12/19/2000-12/31/2007: +2,300.67%
  • 9/7/2005-4/13/2012: +1,079.56%

If we were to ask the question of what was the likelihood of Apple falling to $133.22 on December 31, 2007, we believe the chorus of Apple investors would say, “not likely, if ever.”  Similarly, we believe that, based on the current speed resistance lines, no one would expect Apple to decline to our conservative downside target of $424 let alone falling to the  $212.08 worst case price.

We’re not advocating that we’ve seen the peak in Apple’s stock price especially when we compare the fundamental data on AAPL between the 2007 peak and the current price:

Apple (AAPL) 2007 2012 % change
Sales per share 27.52 170.2 +518.45
‘‘Cash Flow’’ per share 4.37 46.5 +964.07
Earnings per share 3.93 43.8 +1,014.50
Div’ds Decl’d per share 0 2.65 N/A
Cap’l Spending per share 0.84 5.65 +572.62
Book Value per share 16.66 138.85 +733.43
Common Shs Outst’g 872.33 940 +7.76
P/E Ratio @ high price 43.53 17.23 -60.42
Source: Value Line Investment Survey Oct. 12, 2007 April 6, 2012

However, in 2007, it was justified for a non-dividend paying technology company to have a P/E ratio in the 40’s while a company that could easily become a dividend aristocrat would be considered fairly priced with a P/E ratio of 17.

Since we believe that markets are supremely inefficient, the perceived extremes to the upside are likely to be counteracted to the downside.  Edson Gould’s speed resistance lines provide a progressive downside target as Apple’s price increases.  If the price decline achieves any of the downside targets, we’ll be ready to re-examine the company fundamentals for long and short-term investment opportunities.

Apple Inc.: Edson Gould’s Altimeter as if AAPL were a Dividend Achiever

As Apple Inc. (AAPL) announces that it will be paying a dividend of $2.65 per quarter starting in July 2012, we wondered what Edson Gould’s Altimeter would look like if it were applied to AAPL after 1995, when AAPL eliminated their quarterly dividend.  We want to see how Gould’s Altimeter would react to Apple Inc. if the dividend were increased every year from 1996 to the present with the assumption that the 2013 annual dividend would be $10.60 per share.

The Altimeter was first described by Edson Gould in Barron's on February 21, 1968. Gould asserted that the relationship between the price and the dividends paid on that stock, or index, tell investors of under or overvaluation.  It is important to make the distinction between Edson Gould’s Altimeter analysis and his Speed Resistance Line [SRL] analysis.  Altimeters are based on the dividend payment relative to the stock price while the SRL is based strictly on the price movement.

In the case of Apple Inc. (AAPL), there hasn’t been a dividend paid since 1995.  To arrive at a dividend payment from 1996 to today, we calculated a gradual annual dividend increase as would be the case with any blue chip stock like a Dividend Achiever.  Dividend Achievers are stocks that have increased their dividend every year for 10 consecutive years in a row.

We're running on the assumption that the July 2012 $2.65 quarterly dividend would be the latest increase in a long string of dividend increases since 1996.  Below is the assumed dividend increases from 1996 to the present:

Year Annual Quarterly
1996 $0.52 $0.13
1997 $1.13 $0.28
1998 $1.76 $0.44
1999 $2.40 $0.60
2000 $3.00 $0.75
2001 $3.64 $0.91
2002 $4.42 $1.11
2003 $4.88 $1.22
2004 $5.52 $1.38
2005 $6.14 $1.54
2006 $6.76 $1.69
2007 $7.40 $1.85
2008 $8.02 $2.01
2009 $8.64 $2.16
2010 $9.28 $2.32
2011 $9.89 $2.47
2012 $10.48 $2.62
2013 $10.60 $2.65

Based on the proposed annual dividend increases, we can now view what Edson Gould’s Altimeter would look like for Apple Inc. (AAPL) stock.  Below is the Altimeter from 1996 to the present.

image

The first thing that is noticed, in the chart above, is the fact that from 1996 to 2007, Apple traded in a range of between 50 and 17 on the Altimeter (Altimeter level; not stock price).  Anytime AAPL was trading near 50 the stock was overvalued and when the stock traded around the 17 range the stock was considered undervalued.

However, the low of 2003 marked the beginning of a new relationship between Apple’s stock price and our hypothetical dividend that would have been received.  Starting in 2006, AAPL’s stock would decline, at minimum, to the previous Altimeter peak.  The decline from the 2006 peak stopped exactly at the 2005 peak.  The decline from the 2007 peak initially flirted with the 2006 peak but ultimately succumbed to the forces in play and fell well below the 2006 peak.

Our take on this “pattern,” based on hypothetical dividend increases every year from 1996 to the present, is that the next support level for Apple’s stock price would be at the 2007 peak, at minimum.  This suggests that APPL’s stock price could decline to $284.98.  Such a decline would constitute a –52.59% drop from the closing price of $601.10 on March 19, 2012.  Although the $284.98 level seems dismal, it is a far cry better than Edson Gould’s Speed Resistance Line [SRL] analysis which suggests that the extreme downside target is $201.66.  This is an increase from the February 5, 2012 downside [SRL] analysis done on Apple (found here).

Apple (AAPL) and Speed Resistance Lines

As describedin our article on speed resistance lines (SRL) dated September 22, 2011 (found here), Netflix (NFLX) fell below our projecteddownside target of $99.58. Although we thought that the stock would be worthconsidering below such a level, we had to concede that, “...the difficulty may be that thesentiment that pushed the stock price to $298.73 would likely be just theopposite to push the price down.” Assuming the purchase of thestock at $99.58, an investor would have gained 21.10% based on the currentprice of $120.59.
Naturally, wewondered what Edson Gould’s speed resistance lines would say about AppleComputer (AAPL). The very first thing that we look for, to determine speedresistance lines, is the most recent peak in the price.  Because AAPL is continually making new highs,we only need to use the latest price of $455.68 as our starting point.

Based onGould’s work, Apple (AAPL) has a conservative downside target of $230.09 and theextreme downside target is $151.89.  Whenwe ran the same calculations on Netflix (NFLX) in September 2011, we made aseemingly innocuous error.  We overlookedthe fact that NFLX had a lower support line (red line) at the price level of $85.  In this case, we have denoted AAPL’s supportline (also in red line), at $117.05, as a potential downside target for thestock.
As the priceof Apple increases, so too does the SRL lines based on the work ofEdson Gould.  The rampant enthusiasm for AAPLsuggests that the stock isn’t likely to decline to the indicated levels anytime soon.  However, when and if you seeAAPL start to make a swan dive, the levels indicated are reasonable downside targets.

Market Price and Market Share, And Never The Twain Shall Meet

Many companies strive to obtain dominance in market share.  Market share is thought to be the critical element that will propel a company's stock price higher and dominance in an industry.  Unfortunately, that usually isn't the case.  As time moves on, a new company takes a commanding role in a market that they were never thought to be a part of.  Companies that are market leaders today are likely to become failed behemoths in a few years from now.  This is especially true in the technology industry where each new invention is meant to replace all prior technologies by combining all aspects of the old technologies into the new iteration (all things to all people).
In the example below, we show the chart and table of the leaders of the top cellular phone makers in 1999.  While we understand that the industry was in its infancy, it is interesting to see the performance of the respective companies in comparison to their leadership roles in the industry.  In the nearly 11 years since being on the list, none of the original companies have managed to increase their share price beyond their year 2000 highs. Only one company, Qualcomm (QCOM), has managed to increase its share price above the 1999 level.
Below we show the current mobile phone leaders with Nokia (NOK) still in the number one position while Samsung has gone from number 6th ranked in 1999 to number 2 ranked behind Nokia in 2010.


Top Five Mobile Phone Vendors, Shipments, and Market Share, Q3 2010
Vendor 3Q10 Unit Shipments 3Q10 Market Share 3Q10/3Q09 Change
1. Nokia
110.4
32.40%
1.80%
2. Samsung
71.4
21.00%
18.60%
3. LG Electronics
28.4
8.30%
-10.10%
4. Apple
14.1
4.10%
90.50%
5. R.I.M.
12.4
3.60%
45.90%
Others
103.8
30.50%
28.30%
Total
340.5
100.00%
14.60%
Source: IDC Worldwide Quarterly Mobile Phone Tracker, October 28, 2010
New entrants like LG, Apple (AAPL) and RIM (RIMM) are now vying for whatever portion of market share that they can. However, the focus on market share may not be so good in either the short and long run for their stock prices as represented in the chart above. With this in mind, those investment analysts who make the case that increased market share is justification for why a stock price should be increased or at a premium should review the same claims of similar companies in periods past.
  • Updated mobile data for 1999, 2010, and 2016 available here.

Please revisit New Low Observer for edits and revisions to this post. Email us.

How to Use the Jobs Indicator to Buy Apple Stock

There is a little known way that you can use the Jobs Indicator to determine the very best time to buy Apple (AAPL) stock.  Whenever Steve Jobs decides to sell a large portion of his stock, that is the ideal time to buy Apple (AAPL) stock. 
In the first chart, we can seen that Steve Jobs decides to sell a large portion of his stock 7 years after the peak in the price and 79.6% from the 1991 top.  Apparently, Microsoft (MSFT) seemed to think that AAPL was cheap at twice the price that Jobs sold out.  I don't know the exact reason Jobs sold at the bottom in 1997. However, you have to admit that as an indicator, Jobs selling the stock at the time was the greatest indication of when to buy Apple stock.  I wonder if Microsoft still has that $150 million investment in AAPL.  If MSFT still holds that position, the value of the Apple investment is now worth $5.7 billion.
In the charts below, you will see the other time that Jobs "sold" out of Apple (AAPL) stock.  This is a more controversial case of selling, surrendering or voluntarily giving up his options since it was later found that "...Jobs was granted 7.5 million stock options in 2001 without approval from the board of directors and documentation was falsified to indicate a full board meeting had taken place as required, according to a report."
Jobs was later cleared of possible criminal charges related to actually falsifying documents.  Instead, two of his most loyal staffers were thrown under the bus.  The reason for the ill-timed transaction in 2003 might not be reflective of Steve Jobs' "judgment."  However, whenever Jobs gives up a large portion of his holdings in Apple (AAPL), there seems to have been great opportunities to pick up shares in the stock on the cheap.
Email our team here.

What Impact Will Apple’s iPhone be on AT&T and Verizon Stock? Technically Speaking, Not Much.

The purpose of this article is to point out the lack of impact the Apple (AAPL) iPhone will have on the share price of both AT&T and Verizon. This article makes no attempt to argue the finer points of the financial gains and loses that are made to each company in terms of revenue, profit margins, net income, etc., etc... As Dow Theorists, we believe that the change in the stock price reflects all current and foreseeable information. For this reason, when we invest, we’re primarily concerned with how all the good and bad news about a company is translated into the movement of the stock price. After all, it is the consistency of the dividend and the appreciation of the stock price that we’re seeking.
In the charts below, I have compared the price performance of AT&T (red line) and Verizon (blue line) and determined what, if any, difference in the change of price occurred before and after the introduction of Apple’s iPhone.
By some accounts, we could say that the rise in AT&T’s stock price before the iPhone was due to the anticipation of the iPhone becoming a part of the stable of products that was being offered (buy the rumor, sell the news). However, the rumor mill really started churning in late 2006, at a time when AT&T had already gained a 22% difference in stock price from the October 2005 low for both (T) and (VZ).
Historically, (T) has typically been the stock to rise and fall by a greater magnitude than (VZ). This means that as the decline from October 2007 took place, it was expected that the decline would greater in (T) and smaller in (VZ). Because the stocks have similar movement in price pattern at approximately the same time, you can do a comparison with any major peak or trough to come to the same conclusion (try it here.)
The take away from this piece should be that if you’re nervous about large moves down, then you should start researching (VZ) to see if it is the right investment for you. On the other hand, if you don’t mind wide swings down with greater potential for larger gains, as compared to Verizon, then AT&T might be the better choice. However, in terms of the impact that the iPhone might have on the prospects of either company, there isn’t much of a difference.
Email our team here.

Apple Computer: Can’t Trust It

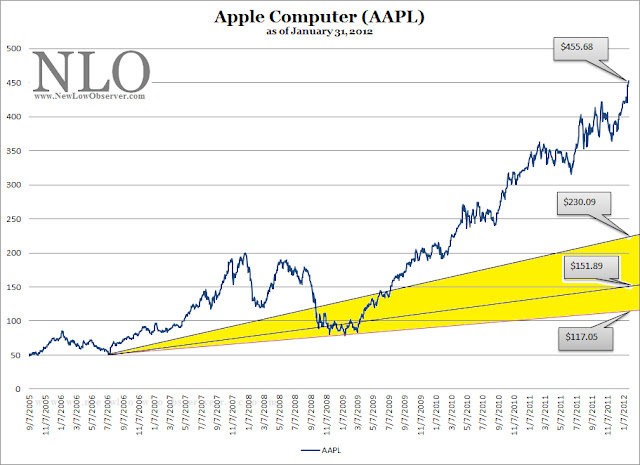
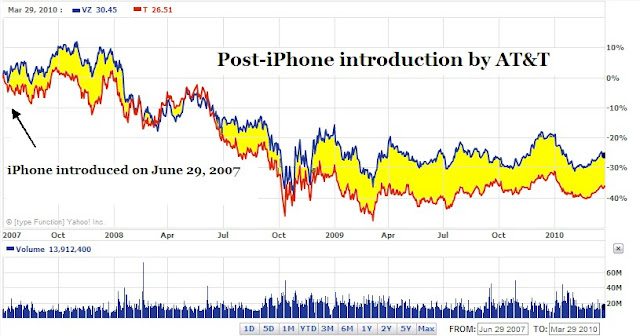
Wall Street seems to be rewarding Apple Computer (AAPL) for its increased earning by giving the stock price a boost of 15% in the last 10 days. Yesterday it was announced that Apple beat mean consensus earning estimates by 15%.

I have followed Apple for many years and I can't seem to understand why investors continue to allow themselves to be taken again and again without pause. Apple is replete with examples of how the company has managed to game the system. I will point out the glaring examples that can be proven and hope that others will allow for the facts to stand juxtapose to the exciting stories that have been created to fan the destructive flame of an adoring public. Below are my top five reasons why I can't trust the way Apple operates as a company.

Problem 1: Option Repricing
Since its IPO, Apple Computer had been the innovator of “serial option repricing.” This method allowed Apple to continually reprice the stock options as the shares of Apple stock fell. This is unique since most companies would reprice their options only one time after the price fell below the exercise price. In the case of Apple, the options would be continually repriced as the stock went on a downward decline. This is critical since Apple has used options as the primary means of compensation in the executive suite as well as for frontline employees.

It is worth noting that Steve Jobs garners an annual salary of $1. It’s not because Steve Jobs is Mr. Benevolent , instead he is compensated through the value of the options that are issued to him. If the stock price starts to decline then Jobs would be out the value he could have received if he exercised the options at a higher price. This creates the perverse incentive to adjust the strike price of the options lower if the stock goes down.

While the debate of the use of stock options as a form of compensation has died down it should be noted that as early as 1998 the critics of such instruments were vociferous about the risks associated with them. Warren Buffett’s business partner Charlie Munger said that, “stock options resemble ‘a chain letter.’” According to Dennis Beresford, former chairman of the Financial Accounting Standards Board (FASB), options are similar to a “Ponzi scheme.” And like Bernard Madoff’s scheme, the game really starts to fall apart when a sustained decline ensures.

Source: Welles, Edward O. "Motherhood, apple pie & stock options. " Inc. Magazine. Feb 1998.

Problem 2: Management Compensation
During the days of when Gil Amelio was CEO, the board at Apple granted tremendous leeway in how it chose to compensate the CEO. At the time, Apple was expected to lose money for many quarters. How did the board at Apple circumvent this problem to give Amelio the most compensation? The board allowed the company to pursue a strategy of projecting larger losses in the future than was realist and then beating the lose projections. From this standpoint, the board would reset the compensation markers for when the CEO would be able to receive their bonus based on quarterly performance on top of their ordinary pay. This meant that regardless of the number of quarters that had passed without profitability, the CEO was going to receive a bonus no matter what happened. This strategy is similar to what happened to Fannie Mae when the company was forced to restate their earnings and fire CEO Franklin Raines.

Source: Crystal, Graef. "One bad Apple doesn't spoil a whole bunch of stock options. " San Francisco Business Times. Jan 31, 1997.

Problem 3: CEO Bailing
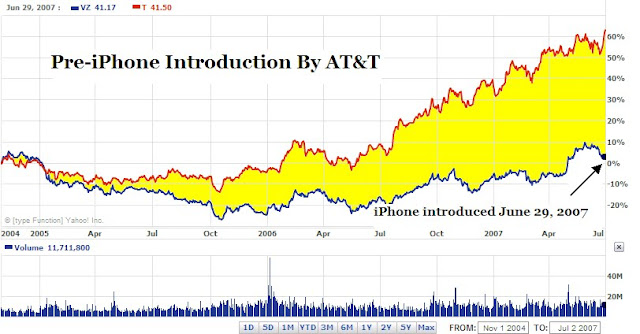
In the chart below you'll see that on June 26, 1997, when Apple was in the throes of a death spiral in the stock price, Steve Jobs decided to sell 1.5 million shares of Apple stock. 
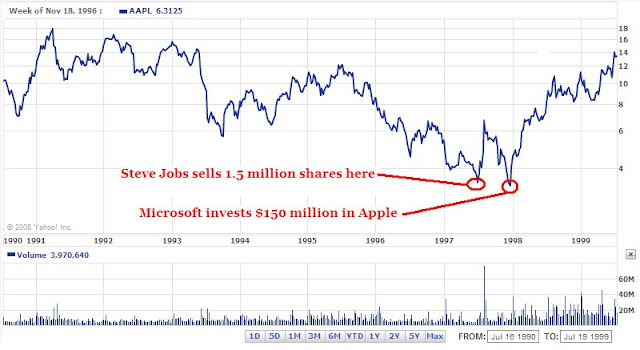
This would seem to be the time when the CEO should be trying to “inspire” confidence in the company stock. Instead, Jobs chose to sell his shares just after selling his NeXT Software to Apple for $6.50 a share earlier in the same year. Not long afterwards Microsoft (MSFT) inject a large amount of money into Apple. At that point, Apple shares started to rise tremendously.

Source: Mardesich, Jodi, and Chris Schmitt. "Jobs admits selling shares. " San Jose Mercury News. August 12, 1997.
Problem 4: Slight of Hand
Another problem is that Apple always gives conservative guidance on their projections and always seems to beat expectations by a wider than expected margin. This was a strategy that was employed by General Electric (GE) until it could not sustain the lie of earnings management due to the collapse of GE Capital. GE was able to convince the public that all was well with the way they operates. Even convincing management junkies that Jack Welch’s Six Sigma was the reason for the company’s success. Instead, it was the practice of managing expectations and a little accounting mumbo-jumbo that kept things moving.

Did you notice that the analysts who cover Apple stock continually get the numbers wrong. When I compared the analysts estimates tracking Ebay, Cisco, Google, Adobe and Apple I found that Apple was always off target by a wide margin. In the data below, the last five years analysts estimating the annual earnings were below the target numbers as follows:

  • Google (GOOG): 2.85%
  • Ebay (EBAY): 1.35%
  • Cisco (CSCO): 1.52%
  • Adobe (ADBE): 0.006%
  • Apple (AAPL): 5.56%

In the last five quarters, analysts were off of the target numbers as follows:

  • Google (GOOG): 3.33%
  • Ebay (EBAY): 8.25%
  • Cisco (CSCO): 7.98%
  • Adobe (ADBE): 4.50%
  • Apple (AAPL): 15.88%

The relatively huge disparity between analyst estimates for Apple and other “high flyer” tech companies is cause for alarm. How is that Apple projections are off by nearly 100% as compared to other tech companies that are subjected to the same economic downturn in the economy? Either the analysts aren't getting it right or Apple is managing the situation. From the prior track record of Apple, I suspect that the earnings are being managed to the Nth degree.

Note: The preceding annual and quarterly numbers are derived from ThompsonReuters as of July 15, 2009.

Problem 5: Backdating Options
In 2001, Apple was called to task for the issuance of, among other things, a 7.5 million options grant to Steve Jobs. The problem with this is that the issuance, made by Chief Counsel Nancy Heinen, was dated two months prior to the date actually created. Heinen was later fired from Apple and fined for her role in the illegal activity but it didn't seem that Steve Jobs had any problem with the action until the SEC started doing an inquiry into the unusual backdating of the options. Strangely, the Apple board, "exonerated Jobs---in part because Jobs 'did not appreciate the accounting implication' of backdating."

It seems strange that Heinen would benefit Mr. Jobs and later get thrown under the bus. It is interesting to note that the Apple board said that Steve Jobs didn't know the implications of such actions even though the board "admitted to frequent backdating." If Apple had as a practice the backdating and repricing of options since its IPO, then Steve Jobs should have known as the CEO, the implications, from an accounting and legal basis, the actions being taken.

Again, like every good scheme, the act of backdating options didn't come up as an issue until the blowup of the tech sector. Had the Nasdaq stocks continued to move higher I don't think any of the SEC actions would have been taken on the matter of backdating or repricing of options.

Source: Burrows, Peter. Parting Shots at Apple's Jobs; Former CFO Fred Anderson reached a settlement with the SEC over options backdating--but says the CEO deserves part of the blame. Business Week Online. April 26, 2007.

While the products that Apple create are great for the gee-whiz hipster crowd of the new millennium the actions of the board of directors and executive suite has been questionable at best. As far as I can tell, Apple hasn't cleared the air about the way they have managed the company in the past to justify buying or holding the stock right now. Touc.

Please revisit Dividend Inc. for editing and revisions to this post.