
-
Topics
Archives
-
-
Recent Posts
-
-
-
-
Category Archives: T
AT&T Price Momentum
Below is a chart of AT&T from 1985 to 2021, reflecting Price Momentum data.
AT&T 10-Year Targets
Below are the valuation targets for AT&T (T) for the next 10 years. Continue reading
AT&T 10-Year Targets
Below are the valuation targets for AT&T (T) for the next 10 years. Continue reading
AT&T Yield Profile
AT&T stock has fallen -11% in 2020 yet it has outperformed the S&P 500 Index by 5%. Perhaps the largest driver for that could be the dividend yield.
As of the closing price on Friday March 13, 2020, the dividend yield for AT&T sits at 6.64%.
This leads us to do some comparative assessment of the AT&T dividend since 1984 until now. Not only will we look at the absolute yield but we will compare this to the risk-free guaranteed rate from the 10-year treasury. Continue reading
AT&T 10-Year Targets
Below are the valuation targets for AT&T (T) for the next 10 years. Continue reading
Takeover Rumors and Realities
On January 20, 2011, Morningstar.com presented an article titled “Morningstar Identifies Likely Takeover Candidates across Nine Sectors.” In that article, 20 companies were listed as potential takeover candidates. Of the 20 companies listed, 7 were actually taken over between the January 2011 and February 2015 period. Below is our general review of those transactions and the implications to an investor if they were to act on those suggestions.
The Methodology
According to Morningstar.com, there were two different methods for the determining the 20 companies. The first method used the following methodology (identified 3 out of 10 companies that were taken over):
“Morningstar equity analysts identified approximately 100 takeover targets across nine sectors: banking, basic materials, consumer, energy, healthcare, industrials, technology/communication services, and utilities. Potential takeover candidates for each sector were determined by unique and proprietary scoring systems for each sector, based on industry-specific drivers of merger and acquisition activity as well as factors such as free cash flow, management, and capital structure.
“Morningstar then examined its list of potential takeover candidates to identify the most compelling stocks for 2011, selecting companies that are the most attractively priced based on their price/fair value ratio and ranking in their respective, sector-specific potential takeover candidate list.”
The second method as applied by Morningstar.com’s division Footnoted analysts used the following screening process (identified 5 out of 10 companies that were taken over, 1 company appeared in the Morningstar list above).
“Footnoted released a list of potential takeover candidates for 2011, based on its analysis of Securities and Exchange Commission (SEC) filings. Morningstar acquired the Footnoted business in February 2010.
“Footnoted analysts combed through SEC filings, looking for signals that could point to a potential deal, including seemingly innocuous items such as new employment contracts or director and executive changes.”
The Companies
The Morningstar.com team accurately identified 30% of the companies that would be taken over while the Footnoted team got 50% correct. Overall, out of 20 companies listed, accurately identifying 35% as takeover candidates seems exceptional.
The seven companies that were taken over were:
-
Clearwire Corp. (CLWR)
-
Petrohawk Energy (HW)
-
Leap Wireless (LEAP)
-
Copano Energy (CPNO)
-
Lawson Software (LWSN)
-
Pride International (PDE)
-
Smurfit-Stone (SSCC)
Data Source
Because the transactions for these stocks have been completed, there are few sources on the internet to track where the price of the stock was on January 20, 2011 and where they eventually ended up by the time the deal was completed. However, we were able to find a website out of Germany (Ariva.de) that still had charting of the stock prices prior to the announcement and after the deals took place.
Of the seven companies listed above, we were not able to get accurate charting of the stock price for Lawson Software (LWSN). However, the remaining six stocks provide interesting food for thought when it comes to the reality of buying stocks that are candidates for takeover.
The Results
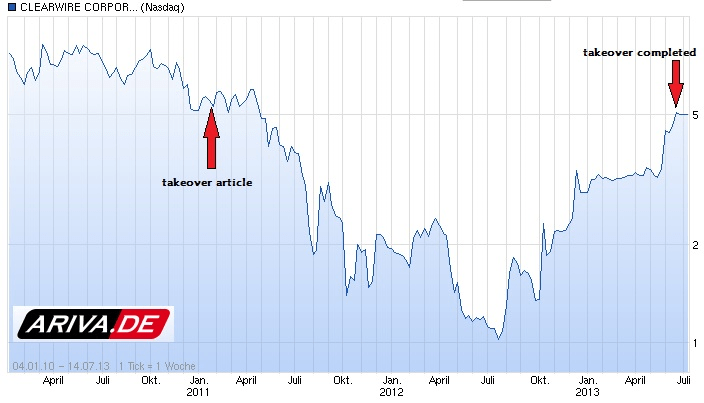
The first stock on the list is Clearwire Corp. At the time of the Morningstar.com article the stock was trading at slightly above $5. However, by July 2012, CLWR was trading at $1.03 per share or down –80%. Finally, by May 2013, CLWR received an offer from Sprint to be acquired for $5 a share. Anyone buying CLWR based on the Morningstar article would have had to endure the pain of the decline, not likely, or see a breakeven deal go through nearly two years later.
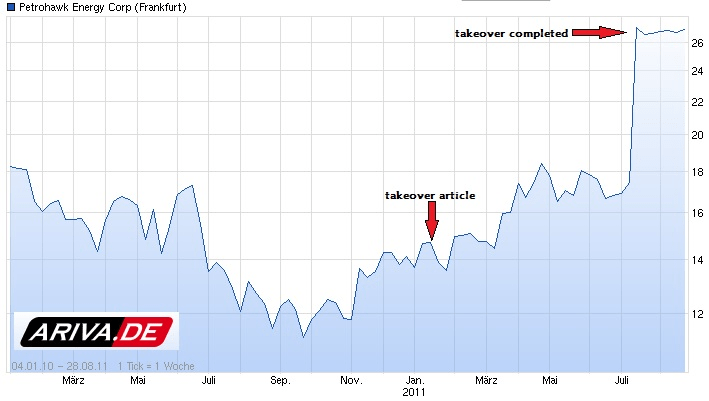
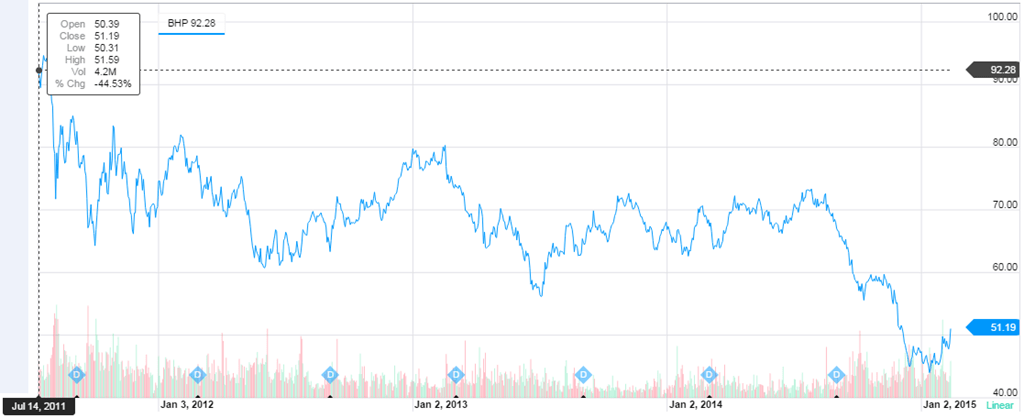
The next company was Petrohawk Energy (HW). At the time of the article, the stock had already experienced an increase from the low of about +36%. Once the takeover by BHP Billiton was announced on July 14, 2011, HW climbed an additional +76%. The timing of the article with the eventual takeover couldn’t have been better. In spite of the takeover by BHP and the jump in the stock price, shares of BHP fell –44% from the July 14, 2011 announcement to February 13, 2015 leaving holders of Petrohawk at the equivalent of a breakeven price when the Morningstar article was issued.
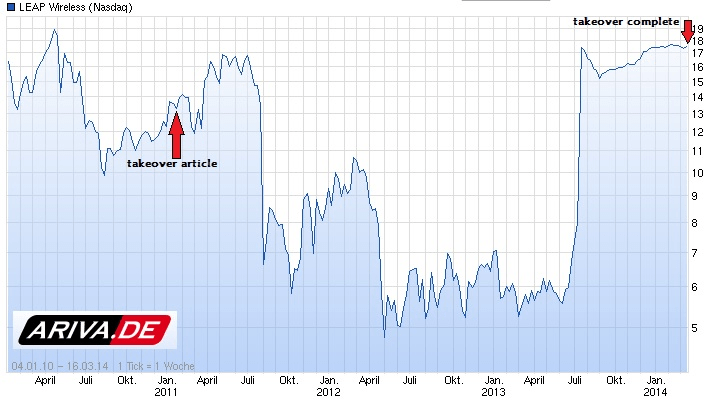
The next company is Leap Wireless (LEAP). The stock started off with a slight increase in price after the Morningstar.com article. However, by July 2011 everything started to fall apart for the stock. LEAP fell by –66% to the low on April 2012. It wasn’t until an announced takeover by AT&T before the stock price recovered all that was previously lost and tacked on an additional +34%. Again, an investor would have to have significant resolve to weather a –66% decline to see any benefit of a takeover offer. As is usually the case, anyone buying a stock with the hopes of a buyout must be willing to accept considerable downside risk.
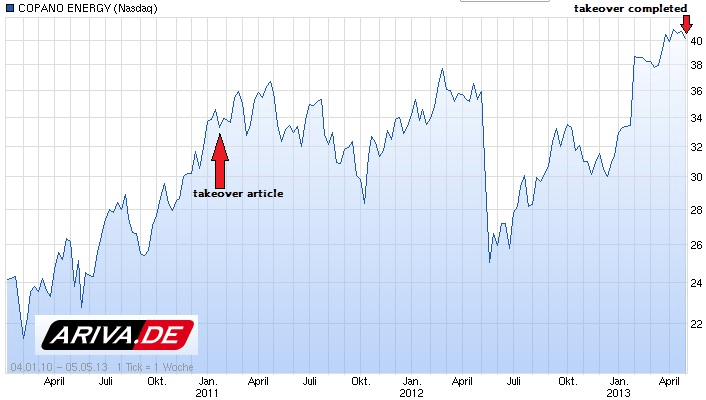
Next is Copano Energy (CPNO). Copano Energy took a slight dip of –26% before the stock recovered and then a deal was announced by Kinder Morgan to acquire CPNO. The decline in CPNO was moderate and the eventual gain was equally so. Kinder Morgan declined –20% shortly after the acquisition was completed in early May 2013. As of February 13, 2015, Kinder Morgan sits at a +7% gain since the takeover of Copano Energy which is a considerable gain relative to most oil sector stocks and their performance in the last year.
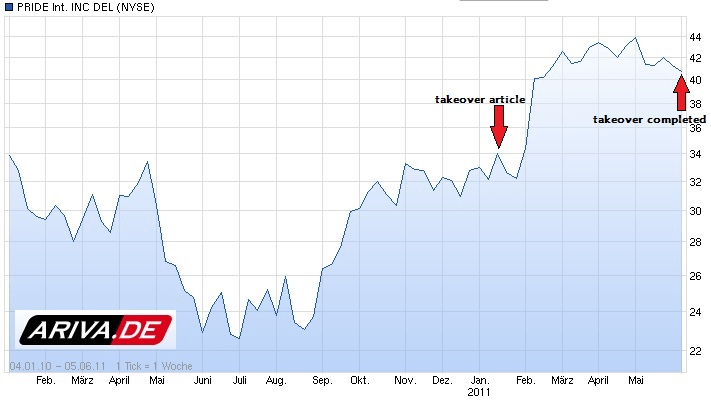
Pride International (PDE) was next with a chart that shows the stock being acquired shortly after the Morningstar.com article. However, the takeout price was “only” +15% above the January 20, 2011 date. PDE was bought by Ensco and was announced on February 7, 2011. As is usually the case, Ensco fell –44% from the completion of the PDE acquisition leaving PDE holders with an equivalent price of $26.24. This would be a loss of –22% from the level that PDE was at when the Morningstar article was published.
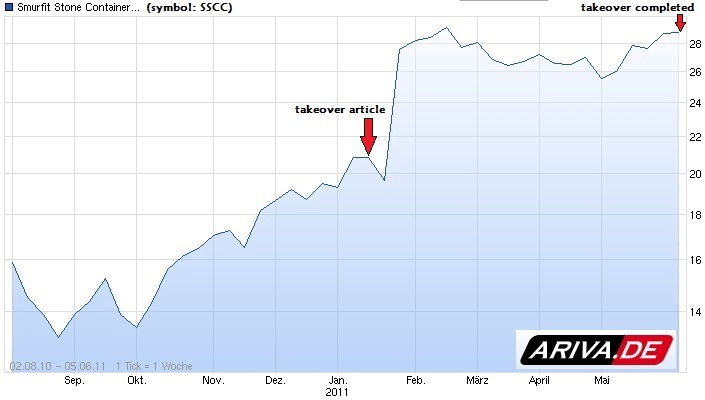
Smurfit-Stone (SSCC) was the last company on the list and it was acquired by Rock-Tenn. The deal was slightly unusual because SSCC was larger than RKT. This was the most lucrative takeover deal that we were able to track from the listed stocks in the Morningstar article. Although SSCC only increased by +28.57% at the completion of the takeover by RKT the subsequent +90% gain in Rock-Tenn’s price justified the investment in SSCC.
Useful Lessons From Takeover Talk
-
A recurring theme in most of the transactions is that the stocks were not acquired at the lows as most investors should expect. This is a point worth repeating, corporate decisions to buy another company usually take place well after the stock of the acquired company has taken off. Some might be surprised by this because corporations that have teams of analysts, strategists and accountants should be able to recognize when a company is undervalued and take advantage of that fact well before average investors in the market.
-
The charts of Clearwire and Leap Wireless were alarming in that the stocks experienced tremendous declines but the acquirers could not take advantage of the bargains for some reason. Sprint and AT&T aren’t spring chickens when it comes to the acquisition market yet they appeared to have overpaid compared to the lower prices that were previously listed.
-
Also worth mentioning is the fact that companies that acquire another competitor usually do so near their relative peak price. This could be a tipoff for those wanting the acquirer but not wanting to overpay.
-
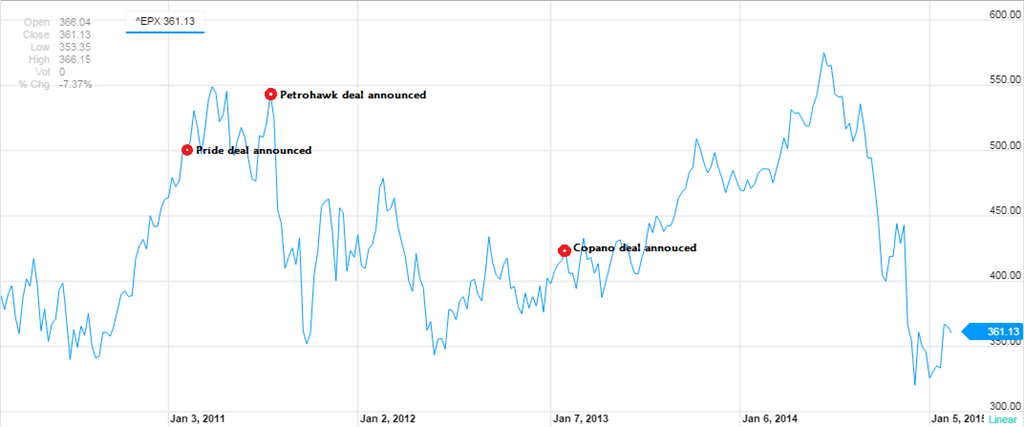
The energy related stocks (Petrohawk, Copano and Pride) ultimately were acquired at inflated prices when considered in the context of the crash that has taken place in the oil sector. Below is the Oil Exploration and Production Index which best represents the nature of the acquired companies. Petrohawk and Pride were clearly overpaid while Copano was probably purchased at fair value, which is not an undervalued price. However, none of the companies were underpriced relative to the last five years, or even 10 years, of data.
Finally, the data that Footnoted provides is far better and accurate for takeover ideas. One out of every two stocks is an incredible record. We would recommend looking out for similar recommendation by Footnoted in the future.
What Impact Will Apple’s iPhone be on AT&T and Verizon Stock? Technically Speaking, Not Much.
The purpose of this article is to point out the lack of impact the Apple (AAPL) iPhone will have on the share price of both AT&T and Verizon. This article makes no attempt to argue the finer points of the financial gains and loses that are made to each company in terms of revenue, profit margins, net income, etc., etc... As Dow Theorists, we believe that the change in the stock price reflects all current and foreseeable information. For this reason, when we invest, we’re primarily concerned with how all the good and bad news about a company is translated into the movement of the stock price. After all, it is the consistency of the dividend and the appreciation of the stock price that we’re seeking.
In the charts below, I have compared the price performance of AT&T (red line) and Verizon (blue line) and determined what, if any, difference in the change of price occurred before and after the introduction of Apple’s iPhone.
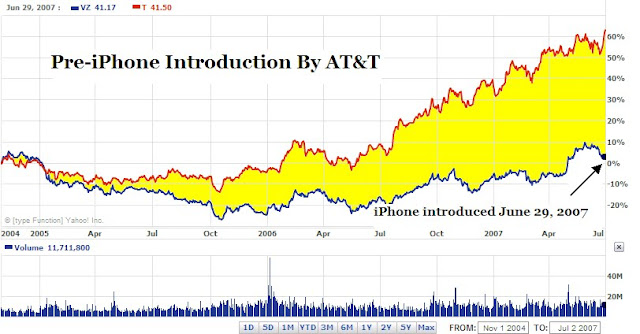
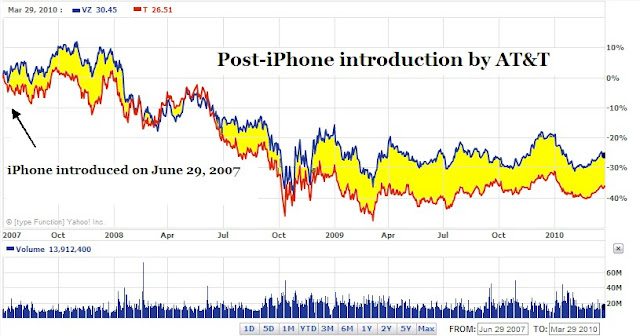
By some accounts, we could say that the rise in AT&T’s stock price before the iPhone was due to the anticipation of the iPhone becoming a part of the stable of products that was being offered (buy the rumor, sell the news). However, the rumor mill really started churning in late 2006, at a time when AT&T had already gained a 22% difference in stock price from the October 2005 low for both (T) and (VZ).
Historically, (T) has typically been the stock to rise and fall by a greater magnitude than (VZ). This means that as the decline from October 2007 took place, it was expected that the decline would greater in (T) and smaller in (VZ). Because the stocks have similar movement in price pattern at approximately the same time, you can do a comparison with any major peak or trough to come to the same conclusion (try it here.)
The take away from this piece should be that if you’re nervous about large moves down, then you should start researching (VZ) to see if it is the right investment for you. On the other hand, if you don’t mind wide swings down with greater potential for larger gains, as compared to Verizon, then AT&T might be the better choice. However, in terms of the impact that the iPhone might have on the prospects of either company, there isn’t much of a difference.
Email our team here.