Below is the Canadian Dividend Watch List and the estimated change over the next 12 months.
-
Topics
Archives
-
-
Recent Posts
-
-
-
-

Below is the Canadian Dividend Watch List and the estimated change over the next 12 months.
Performance Review
Below is the performance of the Nasdaq 100 watch list from May 9, 2014:
| Symbol | Name | 2014 | 2015 | % change |
| DISCA | Discovery Comm. | 37.33 | 31.33 | -16.07% |
| BBBY | Bed Bath & Beyond Inc. | 61.31 | 71.44 | 16.52% |
| ISRG | Intuitive Surgical, Inc. | 353.06 | 494.32 | 40.01% |
| NTAP | NetApp, Inc. | 34.19 | 35.65 | 4.27% |
| EBAY | eBay Inc. | 50.54 | 58.82 | 16.38% |
| ALTR | Altera Corp. | 32.38 | 44.46 | 37.31% |
| WFM | Whole Foods Market, Inc. | 39.32 | 42.58 | 8.29% |
| SIRI | Sirius XM Holdings Inc. | 3.16 | 3.87 | 22.47% |
| VRSK | Verisk Analytics, Inc. | 60.53 | 73.66 | 21.69% |
| COST | Costco Wholesale | 115.39 | 145.88 | 26.42% |
| LMCA | Liberty Media Corp. | 34.18 | 37.93 | 10.97% |
| SRCL | Stericycle, Inc. | 113.90 | 134.01 | 17.66% |
| CERN | Cerner Corporation | 50.19 | 68.02 | 35.53% |
| CA | CA Technologies | 29.41 | 31.60 | 7.45% |
The average gain of the entire list was +17.78% while the top five stocks (DISCA, BBBY, ISRG, NTAP, EBAY) gained an average of +12.22%. This compares with the gain for the Nasdaq 100 index of +23.41% in the same 1-year time period.
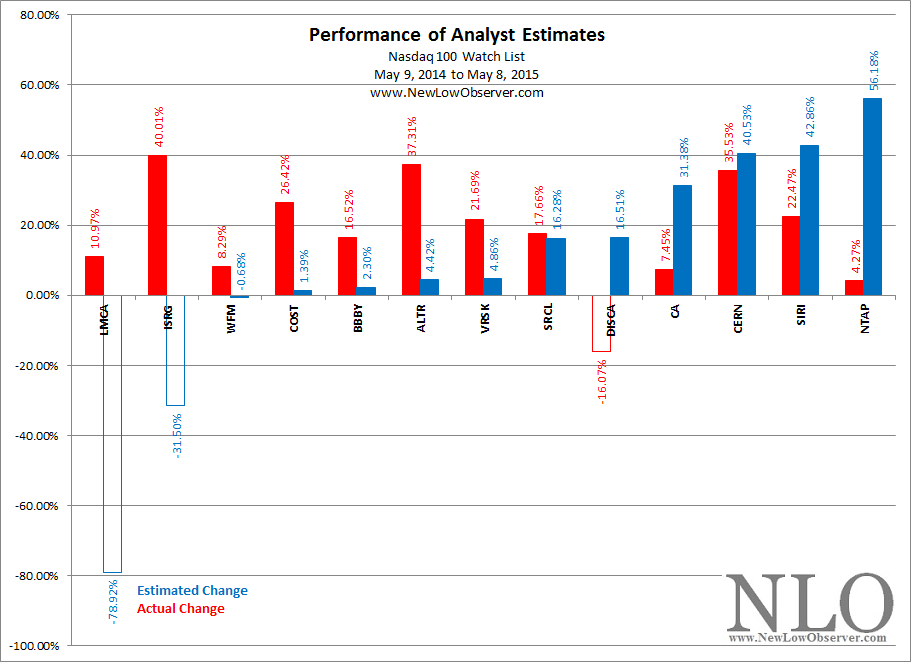
As has frequently been the case, analyst expectations were too optimistic for stocks on the far right (DISCA, CA, CERN, SIRI, NTAP) where the average gains of +10.73%. Likewise, the view was too pessimistic for stocks on the far left (LMCA, ISRG, WFM, COST, BBBY) which averaged +20.44% in the above chart.
The absolute change in Liberty Media (LMCA) and Intuitive Surgical (ISRG) was the most extreme. Liberty Media saw its p/e ratio expand from 20 to 72 while ISRG’s p/e ratio increased from 26 to 39. The increase in the p/e ratio should be expected with the increase in price. However, value oriented investors would have overlooked these stocks simply because of the high p/e ratios and the expectation of lower earnings by analysts in 2014.
Watch List: May 8, 2015
Below are the Nasdaq 100 stocks of interest:
On Monday May 4, 2015, we executed the following transactions: Continue reading
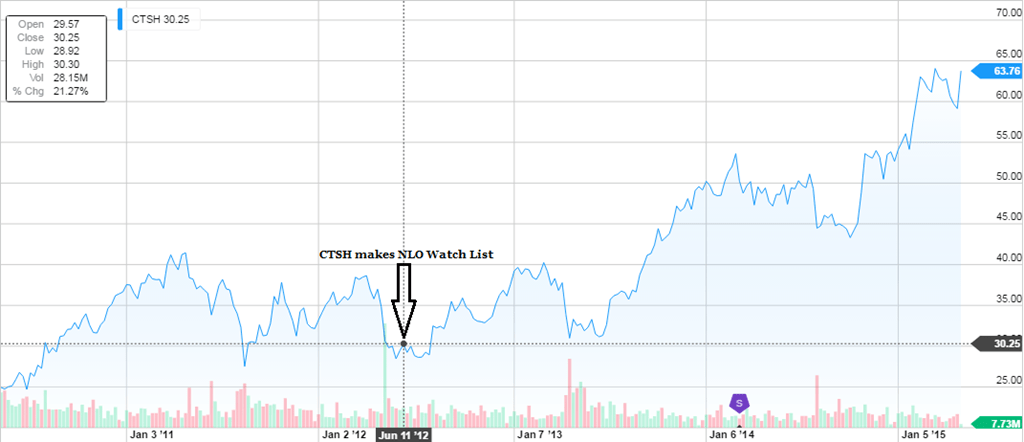
On May 4, 2015, Cognizant Technology Solutions (CTSH) surged more that +8% after earnings and revenue beat expectations and raised their 2015 outlook. Below is a charting of CTSH after appearing on our June 8, 2012 Nasdaq 100 Watch List.
Posted in CTSH
Is the U.S. insurance sector running out of gas? By the looks of the chart below, all indications are that the glorious run from the 2009 low may be over. The iShares US Insurance ETF (IAK) seems to be running out of steam just as it approaches the previous high set in 2007. A breakout to the upside is possible but not before taking a break to the downside.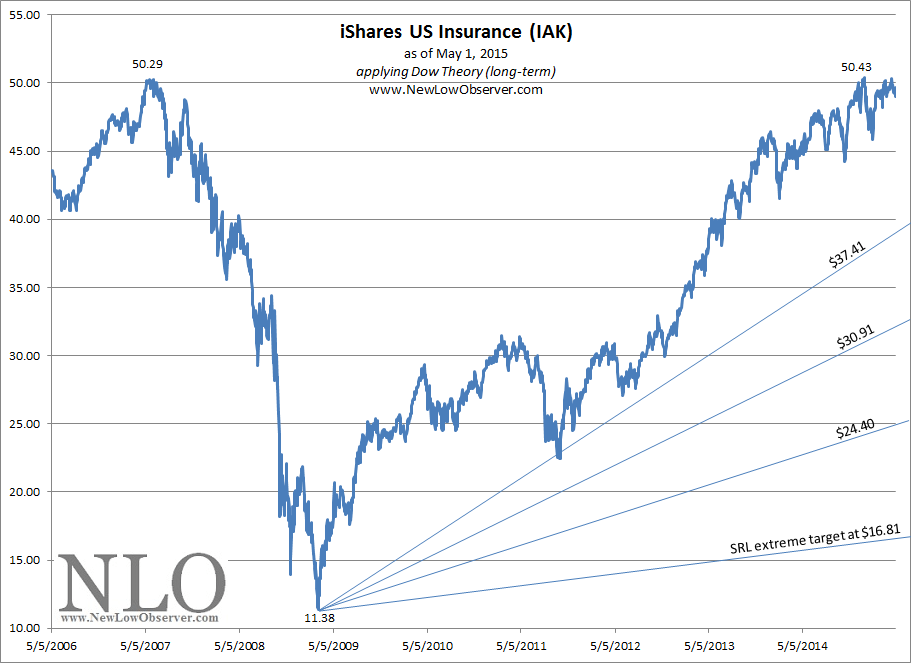
The only consideration at this time is downside risk. The chart above outlines the Dow Theory downside targets with Edson Gould’s SRL extreme downside target of $16.81. Short-term, the downside target of $37.41 looms as a reasonable reaction from the recent peak before the sector potentially retests the prior high. The $30.91 level is considered the fair value for the IAK and should be assumed to be a required level for a retest if a full bear market ensues. As $11.38 was easily achieved from similar heights in the period from 2007 to 2009, so too should investors be willing to accept that $16.81 is possible.
Insurance Watch
Posted in IAK, Insurance Watch List
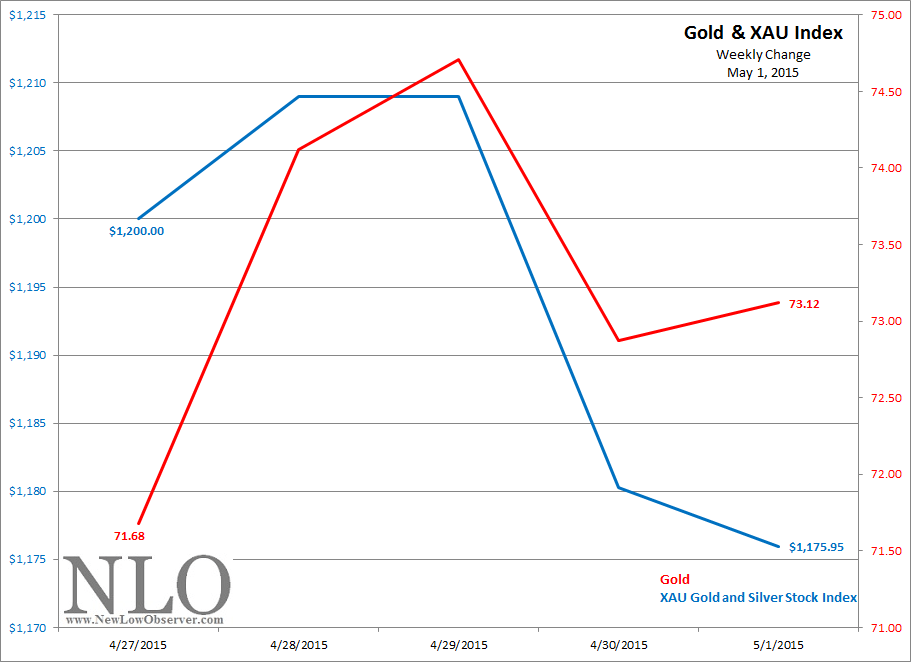
Gold stocks were up while gold was down in the past week.
Gold Stock Indicator: Long Term Charts
On April 30, 2015, in after-hours trading, LinkedIn (LNKD) declined –20.95% from the closing price of $252.13 to $199.30. with such a decline, it is worth considering what the downside risk would be according to Edson Gould’s Speed Resistance Lines (SRL).
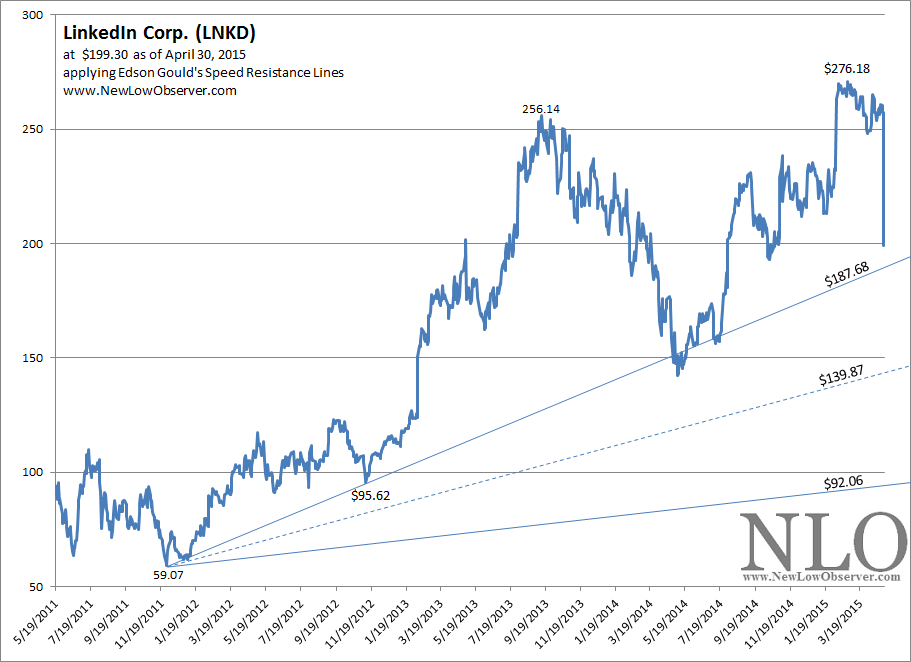
The above chart shows the current SRL downside targets based on the peak price of $276.16:
What is most relevant in this SRL is the downside targets from the previous peak at $256.14. At that time, LNKD had the following downside targets:
In the prior decline, LNKD fell to slightly below the midpoint target at $133.19. This suggests that the current slump should go below the conservative downside target of $187.68. Going below the $187.68 level should get the stock price to the ascending midpoint target of $139.87. Those interested in LNKD should consider the stock in stages at or below the ascending $139 level with an acceptance of a decline to the ascending $92.06 level.
Worth noting is that anyone who had a standing stop loss order with their broker, say below $250 or $240, will be forced out of their position once the stock market opens on May 1, 2015 at whatever the opening price is as long as it is below either of the sample levels. At $199, investors with stop loss orders will take a severe beating even though they may not have been involved in the after hour activity.
Posted in Edson Gould, LNKD, speed resistance line, SRL
By the end of the week, the market closed at its all-time high. While S&P 500 and Nasdaq reached the historical mile stone, the Dow Industrial and Dow Transport are lagging behind. The Dow Industrial will need to top 18,288 while the Transport needs to peak 9,217. At the end of the week, there are 58 companies on our dividend watch list. Continue reading
Performance Review
Below is the performance of our April 25, 2014 watch list.
| Symbol | Name | 2014 | 2015 | % chg |
| BBBY | Bed Bath & Beyond Inc. | 62.48 | 72.53 | 16.09% |
| CTRX | Catamaran Corporation | 38.95 | 59.56 | 52.91% |
| SIRI | Sirius XM Holdings Inc. | 3.12 | 3.96 | 26.92% |
| NTAP | NetApp, Inc. | 35.00 | 36.12 | 3.20% |
| ISRG | Intuitive Surgical, Inc. | 366.37 | 505.92 | 38.09% |
| DISCA | Discovery Comm | 39.14 | 32.71 | -16.43% |
| VRSK | Verisk Analytics, Inc. | 57.81 | 72.68 | 25.72% |
| COST | Costco Wholesale | 115.01 | 148.12 | 28.79% |
| ALTR | Altera Corp. | 33.09 | 40.89 | 23.57% |
| SRCL | Stericycle, Inc. | 113.96 | 136.94 | 20.16% |
| CERN | Cerner Corporation | 49.51 | 73.32 | 48.09% |
| ROST | Ross Stores Inc. | 67.77 | 104.38 | 54.02% |
| MAT | Mattel, Inc. | 37.99 | 30.20 | -20.51% |
| DLTR | Dollar Tree, Inc. | 51.36 | 81.14 | 57.98% |
The average return for the entire list was +25.62% compared to the Nasdaq 100 index gaining +28.41% in the same period of time. The top five stocks on our list (BBBY, CTRX, SIRI, NTAP, ISRG) gained +27.44% in the last year (excluding dividends).
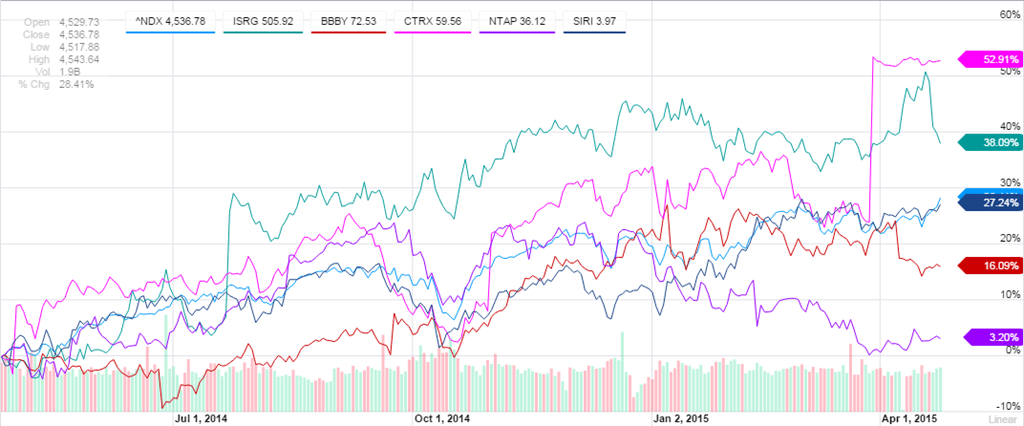
As is common with our watch lists, a stock is being acquired at what we believe is a premium. CTRX is being acquired by UnitedHealth (UNH), a Dow Jones Industrial Average component. At the time of our watch list last year, CTRX was within 3% of the low. Additionally, the announcement of the purchase by UNH followed the pattern of many companies buying the intended target after a gain over of +24% within the year and +177% within the last 5 years.
Nasdaq 100 Watch List: April 24, 2015
Below are the 9 Nasdaq 100 stocks that we think are worth your consideration:
Another week of declines for gold and gold stocks. Gold fell –1.13% while gold stocks declined –1.76%.
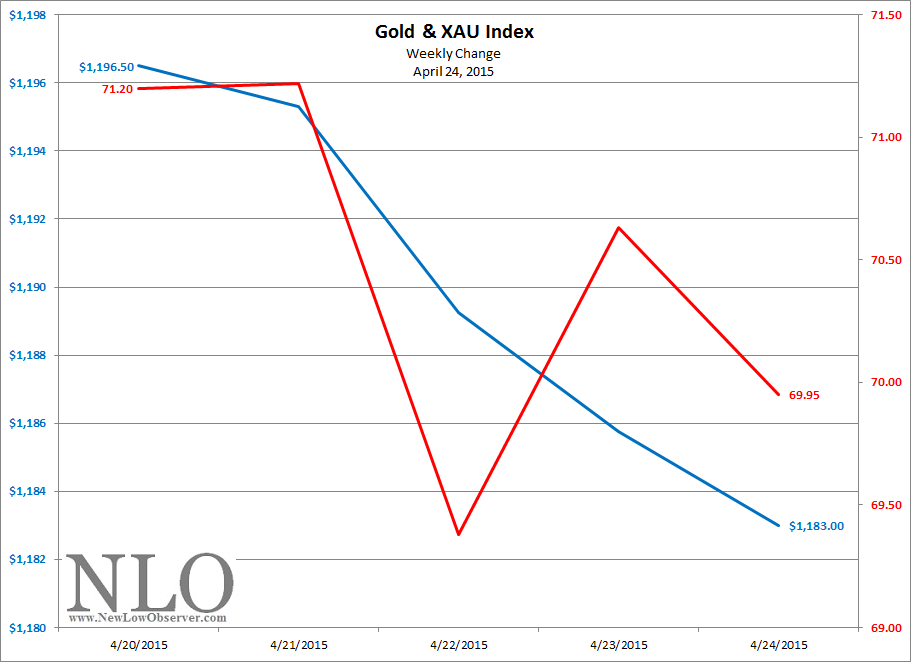
The Gold Stock Indicator is treading water based on the otherwise listless action of gold and gold stocks. However, we’d like to review our commentary on gold from April 8, 2014. At that time, we said the following:
The market took a turn on Friday and tumbled more than 1%. At the end of the week, S&P 500 was off by 1% and the Dow was off by 1.3%. The pull back is a small drop in the larger scheme of thing. The overall market remain in the upward trend with the Dow sitting well above the low of 16,117 in late 2014. However, the weakness in the market pushed the number companies on our watch list up slightly from the previous week. There are 64 companies on our watch list that one could consider. Continue reading
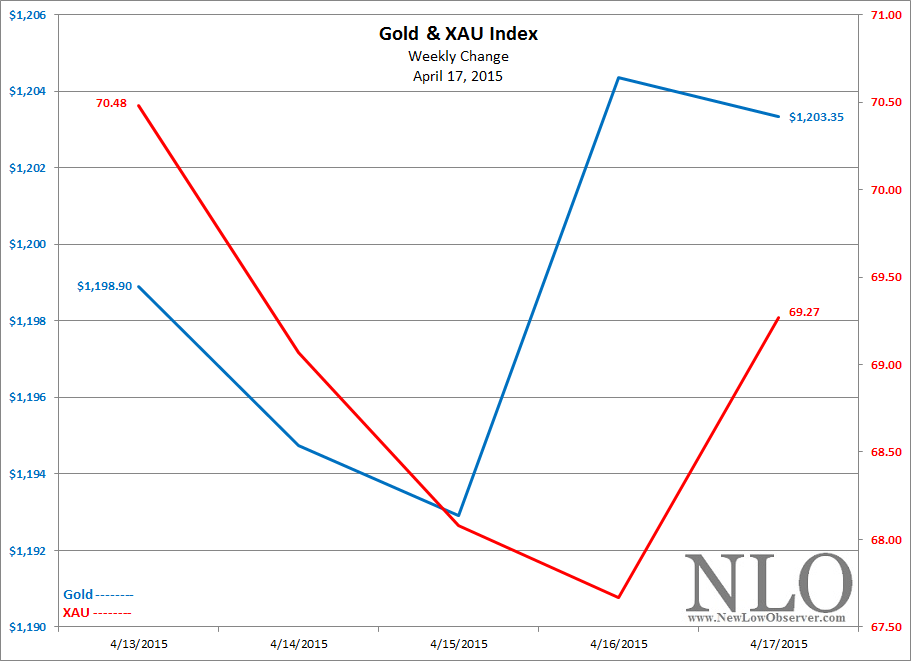
Gold and gold stocks parted ways in the last week. Gold was increased slightly while gold stocks declined –1.72%.
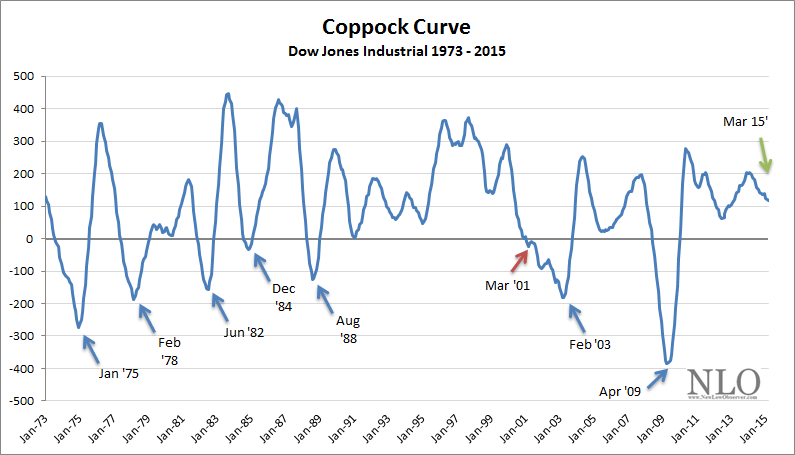
The Coppock Curve is one of the technical indicators that we focus on for long-term buy signals for the stock market. The Coppock Curve is only useful as a BUY indicator when the chart goes from positive territory to the negative territory then turns decidedly upward. As previously indicated, the Coppock Curve does not provide SELL signals in any way.
Once the signal turns upward (while in the negative territory), investors should consider buying stocks at the beginning of the month. Our last “buy” indication came at the end of April 2009. Anyone who purchased the Dow Jones Industrial ETF (DIA) on the first trading day of May 2009, they would have gained +109% in the process (based on the closing price of March 2015).
While the curve remain positive, the direction and the slope is negative. We would get excited if and when this indicator reach the negative zone. We will certainly update our readers when that time comes.
Posted in Coppock Curve, Coppock Index
Performance Review
Below is the 1-year performance of the Canadian dividend stocks from our April 18, 2014 watch list.
| symbol | name | 2014 | 2015 | % chg |
| EMP-A.TO | Empire Company Limited | 65.30 | 91.84 | 40.64% |
| D-UN.TO | Dream Office Real Estate Investment Trust | 29.60 | 27.75 | -6.25% |
| TA.TO | TransAlta Corp. | 13.13 | 11.95 | -8.99% |
| CAR-UN.TO | Canadian Apartment Properties REIT | 21.37 | 29.16 | 36.45% |
| CUF-UN.TO | Cominar REIT | 19.01 | 19.33 | 1.68% |
| CJR-B.TO | Corus Entertainment Inc. | 24.31 | 17.07 | -29.78% |
| FTS.TO | Fortis Inc. | 32.01 | 39.15 | 22.31% |
| NWC.TO | North West Company Inc. | 24.25 | 25.52 | 5.24% |
| FCR.TO | First Capital Realty Inc. | 17.92 | 19.74 | 10.16% |
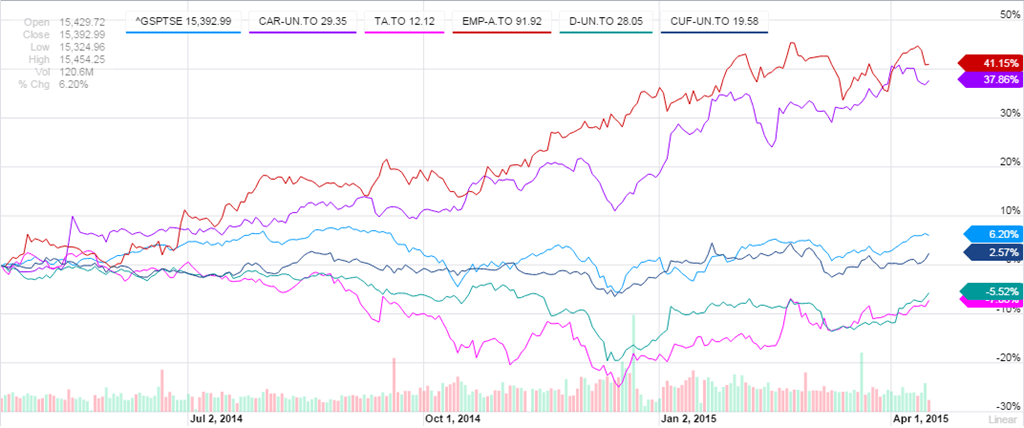
The performance of the entire list averaged +7.94% compared to the +6.55% gain in the Toronto Stock Exchange index. The top five stocks on the list averaged a gain of +12.71% and are charted below. Empire Co. & Canadian Apartment carried the list while Corus Entertainment suffered the largest decline in the last year.
Canadian Dividend Watch List
Below is the April 2015 watch list of stocks based on the closing price of April 15, 2015.