Below are 57 companies with strong dividend record and is trading near its yearly low. It's important to consider the price which one begin to accumulate these dividend paying companies. Continue reading
-
Topics
Archives
-
-
Recent Posts
-
-
-
-

Below are 57 companies with strong dividend record and is trading near its yearly low. It's important to consider the price which one begin to accumulate these dividend paying companies. Continue reading
Performance Review
Below is the performance of the stocks from the April 11, 2014 Nasdaq 100 watch list compared to the Nasdaq 100 Index gain of +28.29%. The entire list gained +23.49% while the top five stocks gained +31.76%.
| Symbol | Name | 2014 | 2015 | % chg |
| SHLD | Sears Holdings | 32.62 | 42.93 | 31.61% |
| BBBY | Bed Bath & Beyond | 63.72 | 73.43 | 15.24% |
| CTRX | Catamaran Corp. | 38.89 | 59.61 | 53.28% |
| VRSK | Verisk Analytics, Inc. | 56.55 | 72.86 | 28.84% |
| SRCL | Stericycle, Inc. | 109.33 | 141.93 | 29.82% |
| SIRI | Sirius XM Holdings Inc. | 3.16 | 3.95 | 25.00% |
| CTXS | Citrix Systems, Inc. | 54.56 | 63.8 | 16.94% |
| DISCA | Discovery Comm. | 39.69 | 33.04 | -16.75% |
| SPLS | Staples, Inc. | 11.83 | 16.72 | 41.34% |
| MAT | Mattel, Inc. | 37.82 | 24.23 | -35.93% |
| COST | Costco Wholesale | 112.08 | 149.63 | 33.50% |
| CHRW | CH Robinson Worldwide | 54.87 | 72.06 | 31.33% |
| DLTR | Dollar Tree, Inc. | 50.74 | 82.87 | 63.32% |
| LBTYA | Liberty Global plc | 38.56 | 52.55 | 36.28% |
| NTAP | NetApp, Inc. | 35.97 | 35.47 | -1.39% |
The actual change versus the analyst estimated change is represented below.
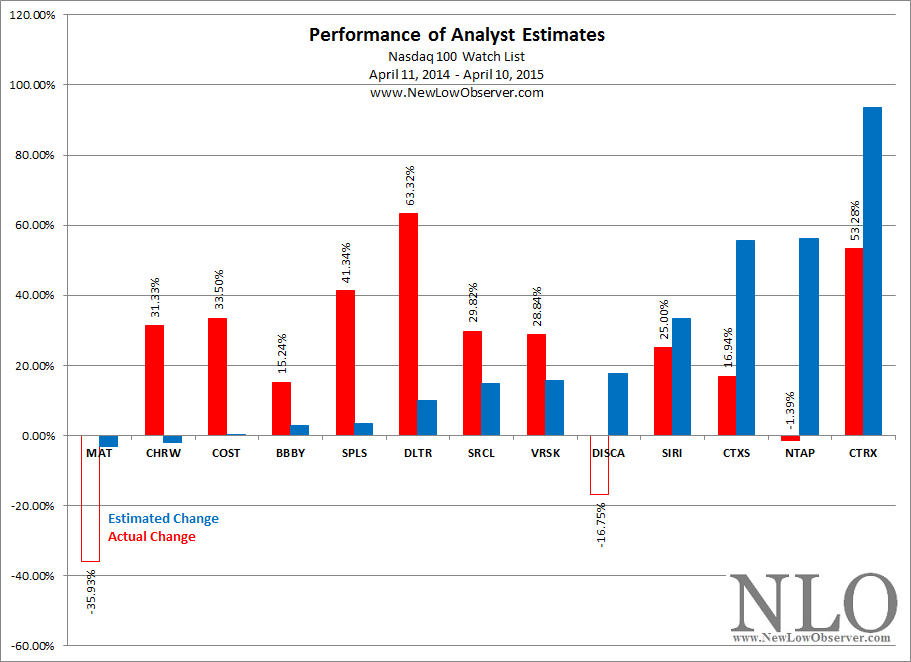
Worth noting is that of the top five stocks expected to outperform, none of the stocks exceeded the analyst expectations. Alternatively, of the five stocks to perform the worst, four of the five stocks substantially out performed the analyst expectations.
Nasdaq Watch List
Below are the Nasdaq 100 companies that are on our radar.
In the past week, gold has declined less that –1% while the gold and silver stock index has declined by –1.72%.
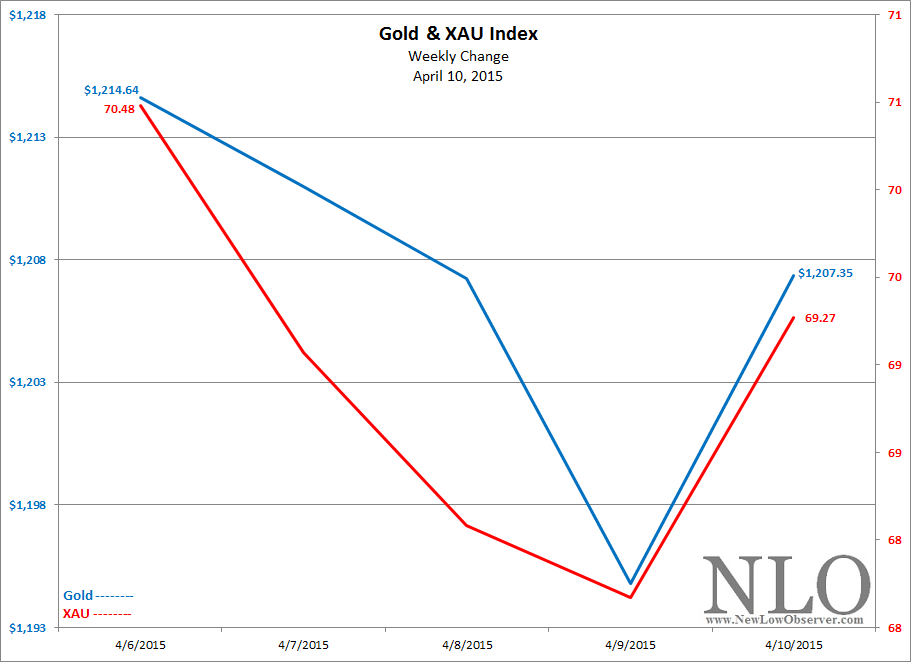
The Gold Stock Indicator nudged slightly higher in the last week. However, the long term perspective outlines the relative level of the indicator.
Performance Review
Below is the performance of the nine stocks from our March 14, 2014 Nasdaq 100 watch list compared to the performance of the Nasdaq 100 Index gain of +20.50% over the last year.
| symbol | Name | 2014 | 2015 | % chg |
| CTSH | Cognizant Technology Solutions | 50.25 | 63 | 25.37% |
| CHRW | CH Robinson Worldwide Inc. | 51.14 | 73.03 | 42.80% |
| SYMC | Symantec Corporation | 20.16 | 23.35 | 15.82% |
| SPLS | Staples, Inc. | 11.3 | 16.11 | 42.57% |
| CTRX | Catamaran Corporation | 45.87 | 48.32 | 5.34% |
| MAT | Mattel, Inc. | 37.28 | 22.61 | -39.35% |
| CSCO | Cisco Systems, Inc. | 21.35 | 27.13 | 27.07% |
| average | 17.09% |
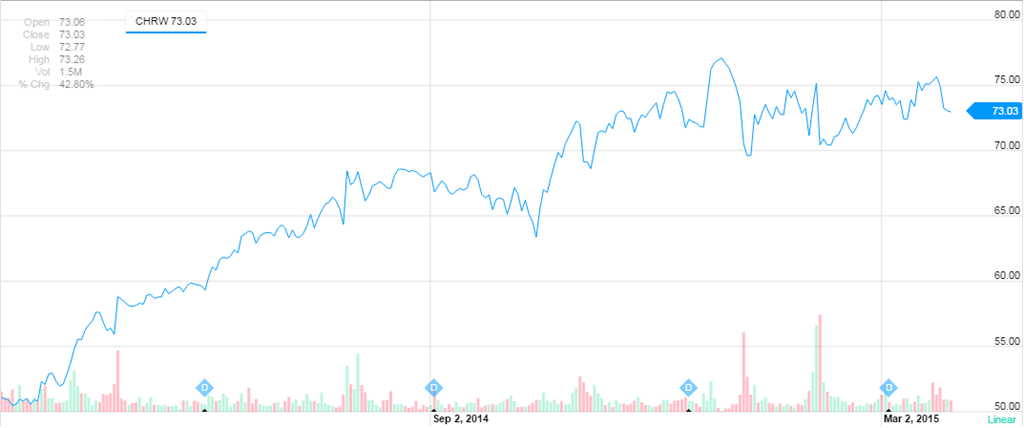
The listed stocks only averaged gains of +17.09% in the last year. However, the top five stocks averaged gains of +26.38%. The two top performing stocks, CH Robinson Worldwide and Staples, were highlighted as being of interest to as the time (we bought shares of CHRW). Of CHRW, we said the following:
“According to Edson Gould’s Altimeter, Robinson Worldwide is trading at an equivalent price to the 2009 low.”
The Altimeter appeared to reflect the fact that the stock was reasonably valued. CHRW was up as much as +50% in the last year.
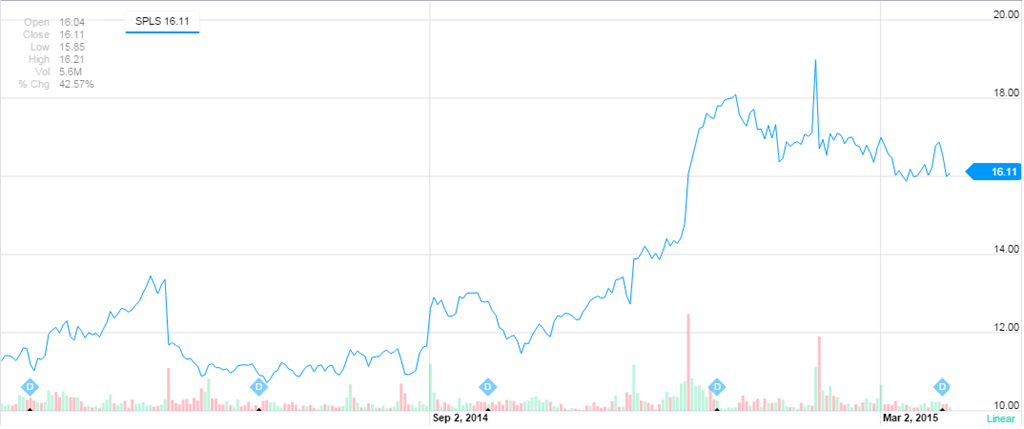
Regarding Staples (SPLS), we said:
“After bottoming in the last half of 2012, Staples increased by +52% before collapsing to the current level. Dow Theory suggests that this is a classic retest of the prior lows.”
Since the March 2014 posting, Staples (SPLS) has increased as much as +68%.
Nasdaq 100 Watch List
Posted in CHRW, Nasdaq 100 Watch List, SPLS
Watch List Performance Review
In our ongoing review of the NLO Dividend Watch List, we have taken the top five stocks on our list from March 28, 2014 and have checked the performance one year later. The top five companies on that list can be seen in the table below.
| Symbol | Name | 2013 Price | 2014 Price | % change |
| FDO | Family Dollar Stores | 57.76 | 79.45 | 37.6% |
| CHRW | C.H. Robinson Worldwide | 50.89 | 73.03 | 43.5% |
| ED | Consolidated Edison | 53.17 | 59.80 | 12.5% |
| ERIE | Erie Indemnity Company | 68.57 | 86.39 | 26.0% |
| BMS | Bemis Co Inc | 38.34 | 46.17 | 20.4% |
| Average | 28.0% | |||
| DJI | Dow Jones Industrial | 16,323.06 | 17,712.66 | 8.5% |
| SPX | S&P 500 | 1,857.62 | 2,061.02 | 10.9% |
Our top five did amazingly well and outperformed the market by +18%. The average gain for the top five stocks was +28%. Family Dollar (FDO) gained an amazing +37.6% in one year. This is after a fund manager, Andy Matthes of Teton Valley Fund, suggested shorting the stock (found here). The biggest pop came after Dollar General (DG) bid for Family Dollar but that bid was rejected.
The best performer was C.H. Robinson (CHRW) which nearly gained +50%. The logistic broker may have benefited from the drop in oil. Oil has fallen -52% while C.H. Robinson rose +43%.
U.S Dividend Watch List: March 27, 2015
The foundation of our investment strategy is to invest in companies that pay consistent stream of dividends with a history of payout increases. The book that help set the stage for this process was Dividends Don't Lie: Finding Value in Blue-Chip Stocks. With the stage set, our full list consists of 72 companies and 20 companies are trading at or near the low. Continue reading
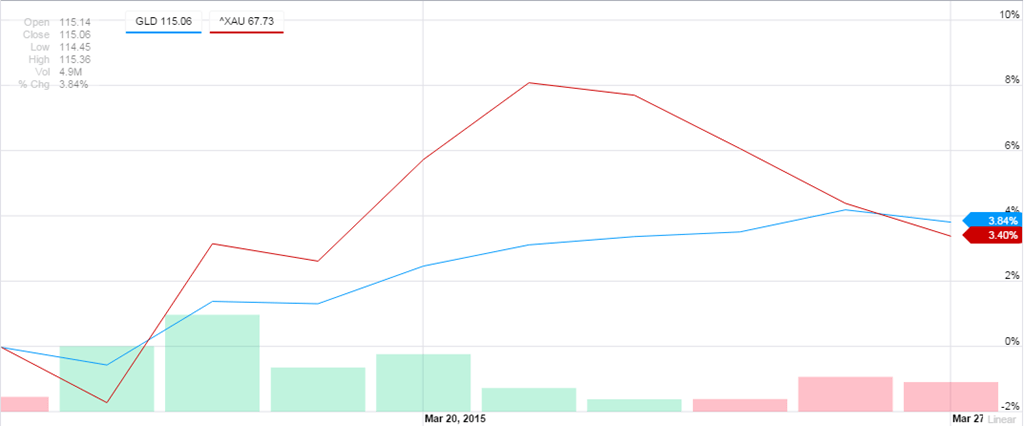
Since our last posting on March 13, 2015, gold (as represented by the SPDR Gold Shares) has increased by +3.84% while the Philadelphia Gold and Silver Stock Index has increased by +3.40%.
On March 25, 2015, we executed the following transactions:
Posted in Transaction Alert
The market roared back this week and pushed the S&P 500 above the 2,100 mark once again. The Nasdaq also closed the week above 5,000. However, the energy market continued to be in turmoil. Light sweet crude closed the week at $46.45 thus you will likely see many energy and industrial companies on our watch list. All-in-all, there are 54 companies that are on our watch list this week. Continue reading
Below is the performance of the stocks found on our March 2014 watch list:
| symbol | 2015 | 2014 | % chg | |
| TLM.TO | Talisman Energy Inc. | 9.55 | 10.86 | -12.06% |
| FTS.TO | Fortis Inc. | 38.93 | 31.28 | 24.46% |
| TA.TO | TransAlta Corp. | 11.77 | 12.68 | -7.18% |
| FCR.TO | First Capital Realty Inc. | 19.89 | 17.71 | 12.31% |
| CWT-UN.TO | Calloway REIT | 29.88 | 25.8 | 15.81% |
| CAR-UN.TO | Canadian Apartment Properties REIT | 28.4 | 20.8 | 36.54% |
| EMP-A.TO | Empire Company Limited | 90.77 | 65.84 | 37.86% |
| CJR-B.TO | Corus Entertainment Inc. | 18.41 | 24.24 | -24.05% |
| BNS.TO | The Bank of Nova Scotia | 63.46 | 64.35 | -1.38% |
| D-UN.TO | Dream Office Real Estate Investment Trust | 26.14 | 28.5 | -8.28% |
| CUF-UN.TO | Cominar REIT | 19.3 | 18.21 | 5.99% |
| LB.TO | Laurentian Bank of Canada | 48.3 | 45.73 | 5.62% |
The chart below shows how the analyst estimates in blue varied compared to the actual performance in red after a year.
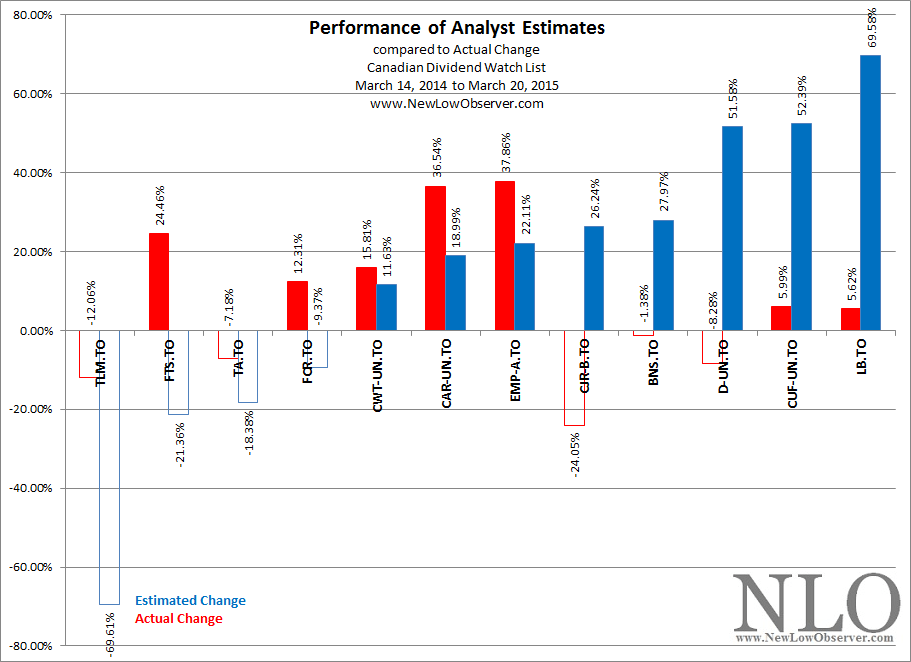
As is frequently the case, the analyst estimates did not quite match the actual performance with the exception of CWT-UN.TO, CAR-UN.TO and EMP-A.TO.
Posted in Canadian Dividend Watch List
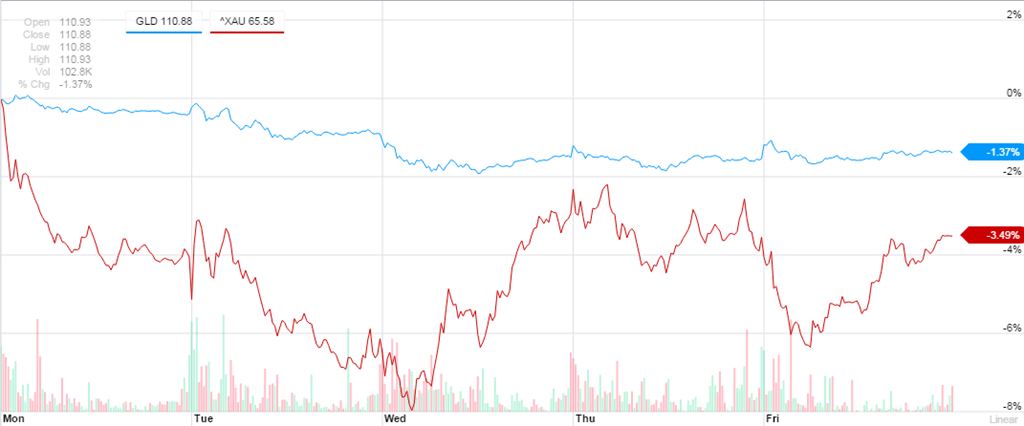
Gold declined –1.37% while the index for gold stocks declined by –3.49% in the past week. The closing numbers for gold stocks would be considered deceptive since the decline was much worse earlier in the week when the decline for the index was as much as –8%.
The large market decline on Friday brought the Dow Jones Industrial average below 18,000 and the Nasdaq below 5,000. The key data point was from the Federal Reserve meeting and a sign that interest rate hike could come sooner rather than later. Even though the jobs report came out stronger-than-expected, the expectation that rate could rise as soon as June took the market by surprise. With that pull back, our watch list expanded to include 74 companies we will highlight the 25 companies which are at or near its 52-week low. Continue reading
Below are the price projections of the components to the Dow-Jones Utility Index based on analyst earnings estimates as of March 8, 2015. These estimates project the price change for the respective stocks in the next 12 months.
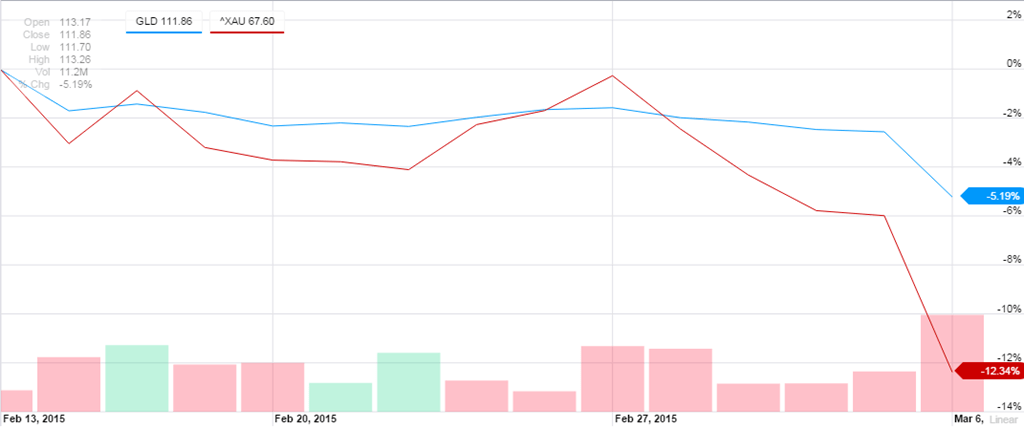
Gold, as represented by the SPDR Gold Shares (GLD), has registered a loss of –5.19% since our last posting on February 13, 2015. At the same time, gold stocks, as represented by the Philadelphia Gold and Silver Stock index (XAU), have declined –12.34%.
On February 25, 2015, when Lumber Liquidator was trading at $57.23, we said the following:
“Those interested in LL and willing to perform appropriate due diligence could engage in a three phase purchase plan beginning below $39.81, $31.64 and $23.47. Investors, as opposed to speculators, should be willing to accept that there is no compensation for the wait when holding LL and that the decline to the ascending $23.47 level is a real risk.”
In fact, Lumber Liquidator blasted below the $39.81 support level and has rested at the $31.64 support level and started to move higher as seen in the chart below.
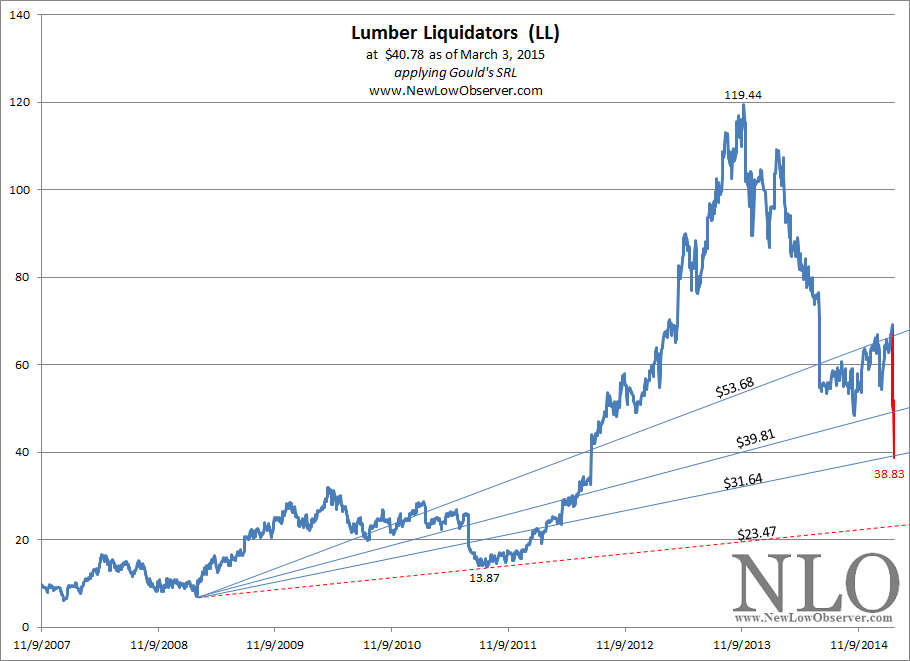
We’ve intentionally left out the move up from $38.83 to highlight the extent of the decline and the high level of coincidence with the supports levels that we had outlined in the previous month. All that remains is the decline to the $23.47 level.
While famous short-sellers have the ear of influential media to talk their book and ensure their profits, we only have price action to work from. For this reason, it is well worth noting another coincidence that relates to Lumber Liquidator and futures price on lumber as seen in the chart below.
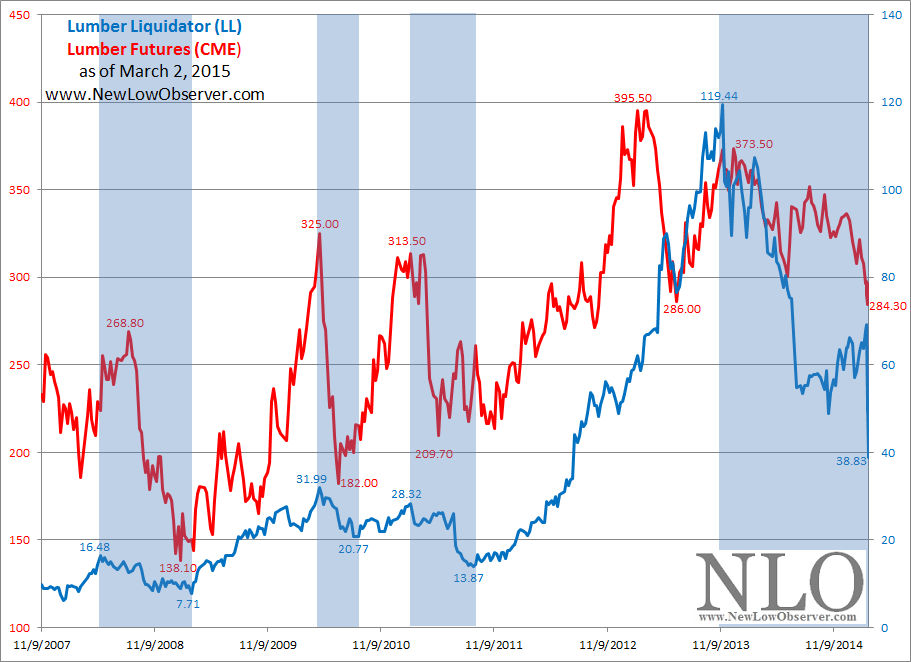
The coincidence of Lumber Liquidator (LL) declining significantly at the same time as the futures price of lumber (as traded on the Chicago Mercantile Exchange) seems difficult to ignore. Investors should take note of the fact that in three prior periods indicated in blue, LL has lost a minimum of –35% and as much as –53% when the price of lumber declined –33% or more.
So far, from December 2013 to March 2015, the price of lumber has declined –23% while LL has declined as much as –67.49%. Much of the decline in LL has been exacerbated by concerns related to quality and sourcing of the flooring. However, the current decline is only slightly out of alignment from what has happened in the past.
We say slightly because we’re excluding the peak in lumber at 395.50 when LL was trading at $62.19. While lumber was trading lower and not to exceed the $395.50 (considered a bear market), LL gained another +92.05%. If Lumber Liquidator’s decline was measured from the February 15, 2013 peak in lumber at $395.50, the decline in the stock price would equal –37.56%.
Assuming we aren’t on the cusp a new bear market, the decline in LL has been overdone and an individual willing to accept the downside risk to $23.47 should consider implementing a three phase purchase plan. An investor must keep in mind that the conservative upside target is $80.53 which is the new “limit” for the stock instead of the previous $119.44. In addition, the downside targets now act as upside resistance level as was the case when LL could not sustain the $53.68 level prior to the recent collapse.
Posted in Edson Gould, LL, lumber, speed resistance line, SRL
Below are the downside targets using Speed Resistance Lines [SRL] for Lumber Liquidator Holdings (LL) and Boston Beer Company (SAM) based on the work of Edson Gould.
Lumber Liquidator (LL) has declined from the peak of $119.44. Gould’s SRLs suggest that from the peak price, LL has a conservative downside target of $53.68 and an extreme downside target of $39.81.
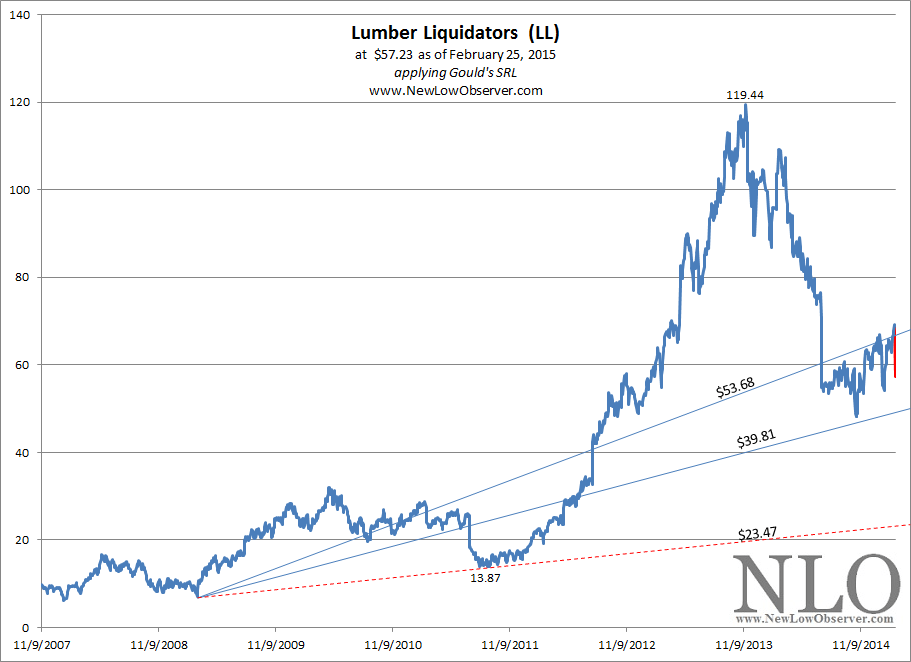
On February 25, 2015, LL was unable to sustain a price above the ascending $53.68 level with a decline of over –17%. Our best guess is that LL will decline to the ascending $39.81 level, which currently approximates $49.50 price. Those interested in LL and willing to perform appropriate due diligence could engage in a three phase purchase plan beginning below $39.81, $31.64 and $23.47. Investors, as opposed to speculators, should be willing to accept that there is no compensation for the wait when holding LL and that the decline to the ascending $23.47 level is a real risk.
Boston Beer Company (SAM) is the brewer of Samuel Adams beer and a multitude of other “craft” beers. Today SAM declined –10% on an earnings miss. Below is the SRL for SAM.
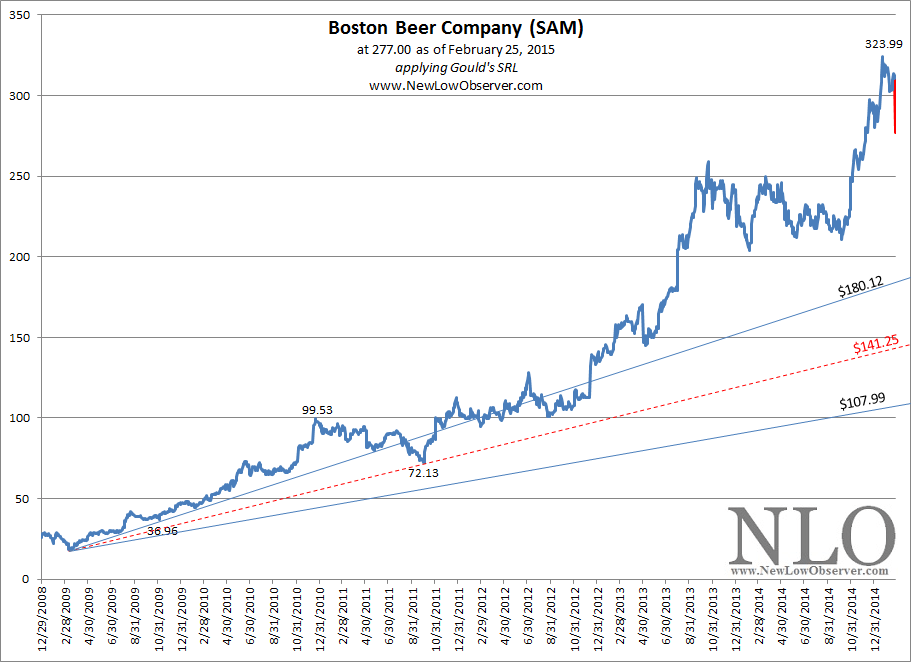
Our expectations for SAM are not very high as the last time that the stock was able to achieve the conservative downside target of $70.13 was in 2011. Since that time, SAM has faltered but not fallen. In spite of this fact, we’ve outlined the conservative downside target of $180.12 and the extreme downside target of $107.99. Investors should note that a decline to the ascending $180.12 level is an ideal buying target with a follow-up purchase below $141.25. As with Lumber Liquidators, SAM is bet on growth in the stock price and not much else.
The relative strength of each company (long-term viability) is what makes these stocks compelling and worth considering at the appropriate predetermined price.
Posted in Edson Gould, LL, SAM, SRL