
-
Topics
Archives
-
-
Recent Posts
-
-
-
-
Category Archives: Insurance Watch List
Insurance Watch List: October 2018
Below are the Insurance Watch List stocks for October 2018. Continue reading
Insurance Watch List: June 2018
Performance Review
Below is the performance of the June 25, 2017 Insurance Watch List.
| symbol | name | 6/25/2017 | 6/1/2018 | % change |
| GTS | Triple-S Management Corporation | 16.97 | 36.7 | 116.26% |
| UNAM | Unico American Corporation | 9.28 | 8.15 | -12.18% |
| GLRE | Greenlight Capital Re, Ltd. | 20.55 | 14.7 | -28.47% |
| FRFHF | Fairfax Financial Holdings Limited | 420.92 | 556.7 | 32.26% |
| MHLD | Maiden Holdings, Ltd. | 11.2 | 8.7 | -22.32% |
| BWINA | Baldwin & Lyons, Inc. | 23.9 | 23.47 | -1.80% |
| DGICA | Donegal Group Inc. | 15.93 | 13.99 | -12.18% |
| ANAT | American National Insurance Company | 114.56 | 120.3 | 5.01% |
| FFG | FBL Financial Group, Inc. | 60.35 | 79.9 | 32.39% |
| CINF | Cincinnati Financial Corporation | 71.23 | 70.18 | -1.47% |
| RLI | RLI Corp. | 55.04 | 66.13 | 20.15% |
| AMSF | Amerisafe, Inc. | 55.9 | 60 | 7.33% |
| NSEC | The National Security Group, Inc. | 14.04 | 15.85 | 12.89% |
| PKIN | Pekin Life Insurance Company | 12.65 | 12.7 | 0.40% |
| NAVG | The Navigators Group, Inc. | 54.8 | 59.5 | 8.58% |
| WTM | White Mountains Insurance | 862.44 | 904.4 | 4.87% |
| average | 10.11% | |||
| IAK | iShares US Insurance ETF | 3.37% |
The performance of the entire watch list was better than the iShares U.S. Insurance ETF gain of +3.37%. The ranked performance by the top five, top 1st, 2nd, & 3rd and 2nd, 3rd, & 4th is listed below for the various fundamental categories.
| low p/e | % change | low p/b | % change | low yield | % change | ||
| WTM | 4.87% | GTS | 116.26% | WTM | 4.87% | ||
| FFG | 32.39% | ANAT | 5.01% | NAVG | 8.58% | ||
| AMSF | 7.33% | UNAM | -12.18% | PKIN | 0.40% | ||
| ANAT | 5.01% | NSEC | 12.89% | NSEC | 12.89% | ||
| BWINA | -1.80% | GLRE | -28.47% | AMSF | 7.33% | ||
| top 5 | 9.56% | top 5 | 18.70% | top 5 | 6.81% | ||
| top 1,2,3 | 14.86% | top 1,2,3 | 36.37% | top 1,2,3 | 4.61% | ||
| top 2,3,4 | 14.91% | top 2,3,4 | 1.91% | top 2,3,4 | 7.29% |
| high p/e | % change | high p/b | % change | high yield | % change | ||
| MHLD | -22.32% | RLI | 20.15% | MHLD | -22.32% | ||
| GTS | 116.26% | AMSF | 7.33% | BWINA | -1.80% | ||
| GLRE | -28.47% | PKIN | 0.40% | DGICA | -12.18% | ||
| RLI | 20.15% | CINF | -1.47% | ANAT | 5.01% | ||
| NAVG | 8.58% | NAVG | 8.58% | FFG | 32.39% | ||
| top 5 | 18.84% | top 5 | 7.00% | top 5 | 0.22% | ||
| top 1,2,3 | 21.83% | top 1,2,3 | 9.29% | top 1,2,3 | -12.10% | ||
| top 2,3,4 | 35.98% | top 2,3,4 | 2.09% | top 2,3,4 | -2.99% |
The category with the most underperformance was the high yield group of insurance stocks with +0.22%, –12.10%, and –2.99% in the top 5, top 1,2,3 and top 2,3,4 groupings, respectively. The category killer was the low p/e insurance stocks. While the high p/e stocks had higher average gains, the low p/e stocks didn’t have a stock with triple digit gains (GTS) which skews the failings of double digit losing stocks (MHLD and GLRE) in the high p/e category.
Top Watch Review
In our June 25, 2017 posting, we highlighted a couple of stocks that appeared to be worth avoiding as a first purchase or worth selling the principal if a current holding.
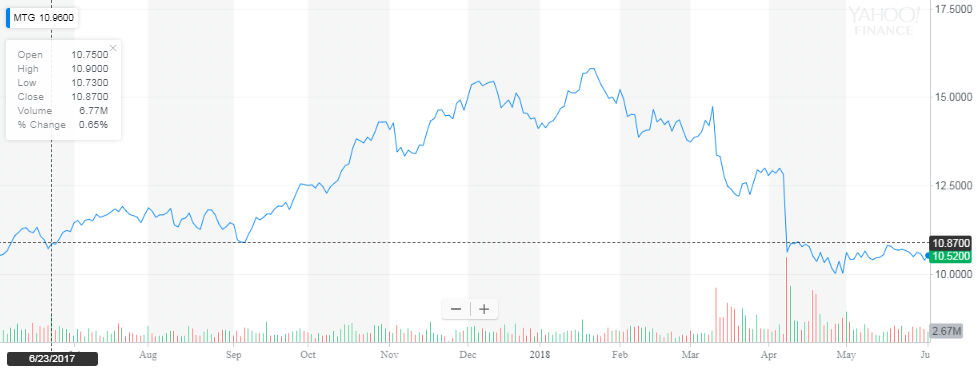
At the time we mentioned that MGIC Corp. (MTG) had just achieved a gain of +80% from the 2016 low. In spite of this fact, MTG managed to runup another +47% by late January 2018. Since that time, MTG has managed to land at a breakeven level with the June 25, 2017 posting.
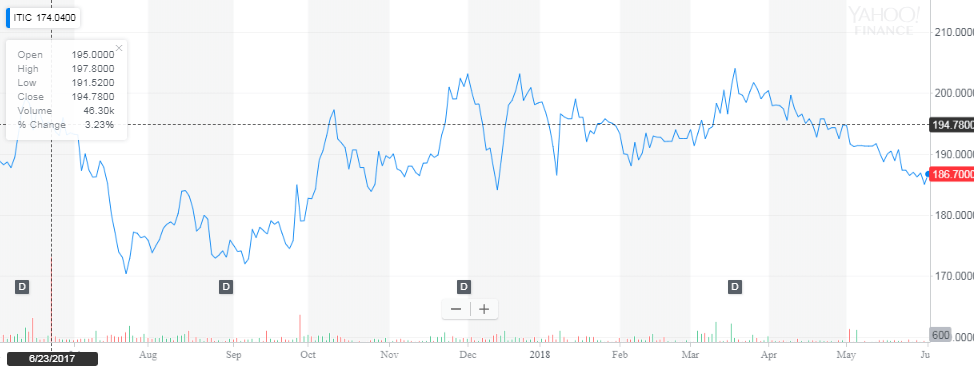
The next stock we covered for avoiding was Investors Title Co. (ITIC). the stock has traded in a tight ranged over the last year and stands at a –4% decline in price from the June 2017 posting.
Overall, the top watch recommendations were appropriate only in so far as there were compelling alternative investment opportunities.
Insurance Review
Below is the performance review of the insurance stocks from our December 28, 2017 posting to June 1, 2018.
Insurance Watch List: December 2017
Below is our year-end review of the insurance stocks with a market capitalization of $1 billion or more.
Berkshire Hathaway has been given special consideration in a single post dated December 19, 2017 with our 2018 fair value, overvalued, and undervalued targets which have been achieved every year since 2012.
Insurance Watch List: October 2017
Performance Review
From our October 2016 Insurance Watch List, we have the following performance of the entire watch list.
| symbol | name | % chg |
| CNO | CNO Financial Group, Inc. | 56.67% |
| THG | The Hanover Insurance Group, Inc. | 24.84% |
| HALL | Hallmark Financial Services Inc. | 12.98% |
| ORI | Old Republic International Corp. | 6.44% |
The average change for the list was +25.23% as compared to the iShares Dow Jones Insurance Index ETF (IAK) gain of +22.51%. Below is the performance of the same stocks relative to the analyst estimates:
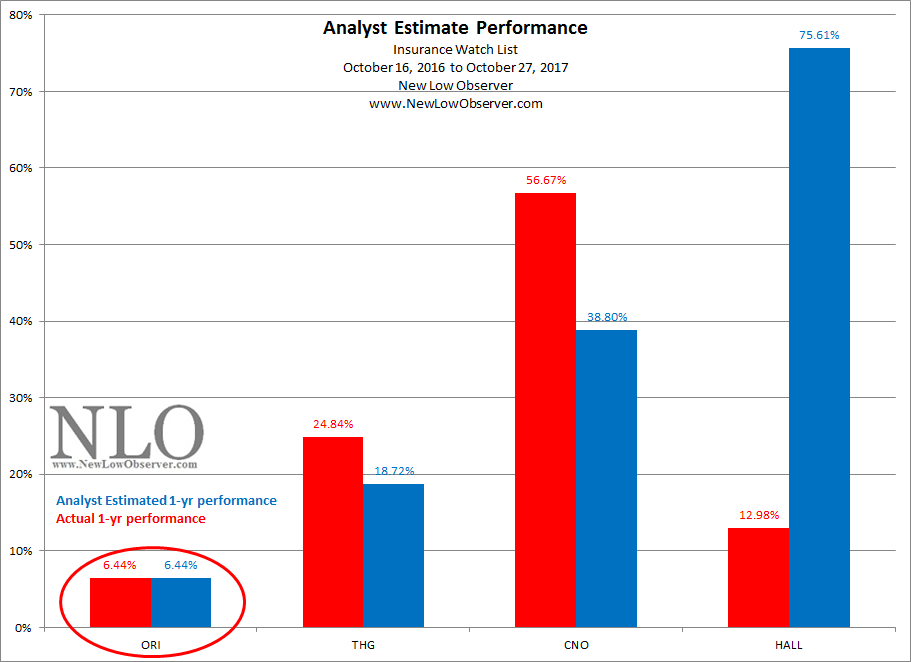
How’s this for a stunner? Take a look at the performance Old Republic Title (ORI). What in the world is that all about? The analysts called for a +6.44% gain and that is exactly the amount the stock has increased one year later. Let’s dare them to do it two years in a row.
The stock that we highlighted was Hallmark Financial Services (HALL). We pointed out the downside target however only one ($9.68) was achieved. The underperformance of HALL was expected and therefore continues to put the stock in the position of being undervalued at the current price.
In our section titled “Sell the Principal” we highlighted the stocks that we thought investors should consider selling the principal. Below is the performance of those stocks.
| symbol | name | % chg |
| GNW | Genworth Financial, Inc. | -32.67% |
| STC | Stewart Information Services | -17.39% |
| KFS | Kingsway Financial Services Inc. | -2.65% |
| NATL | National Interstate Corporation | 0.25% |
| ENH | Endurance Specialty Holdings Ltd. | 1.19% |
| CRD-B | Crawford & Company | 1.97% |
| HTH | Hilltop Holdings Inc. | 9.72% |
| PFG | Principal Financial Group Inc. | 30.14% |
| SYCRF | Syncora Holdings Ltd. | 36.30% |
| UNM | Unum Group | 44.21% |
| LNC | Lincoln National Corporation | 58.14% |
Four stocks exceeded the average return of the iShares Dow Jones Insurance Index ETF (IAK). The average change of the entire list increased by +11.74% as compared to the iShares Dow Jones Insurance Index ETF (IAK) gain of +22.51%.
October 2017 Insurance Watch List
Below is the latest list of stocks that we’re watching and the analyst estimates for the stocks:
Insurance Watch List: October 2017
Performance Review
The following is the performance of the Insurance Watch List stocks that we published in October 2016.
| symbol | name | 2016 | 2017 | % chg |
| THG | The Hanover Insurance Group, Inc. | 78.97 | 97.68 | 23.69% |
| HALL | Hallmark Financial Services Inc. | 10.25 | 11.59 | 13.07% |
| CNO | CNO Financial Group, Inc. | 15.67 | 24.04 | 53.41% |
| ORI | Old Republic International Corp. | 18.32 | 19.6 | 6.99% |
The average return for the four stocks was +24.29% as compared to the iShares Dow Jones US Insurance Index ETF (IAK) gain of +20.27%. The analysts called the performance of the stocks fairly well as indicated in the chart below.
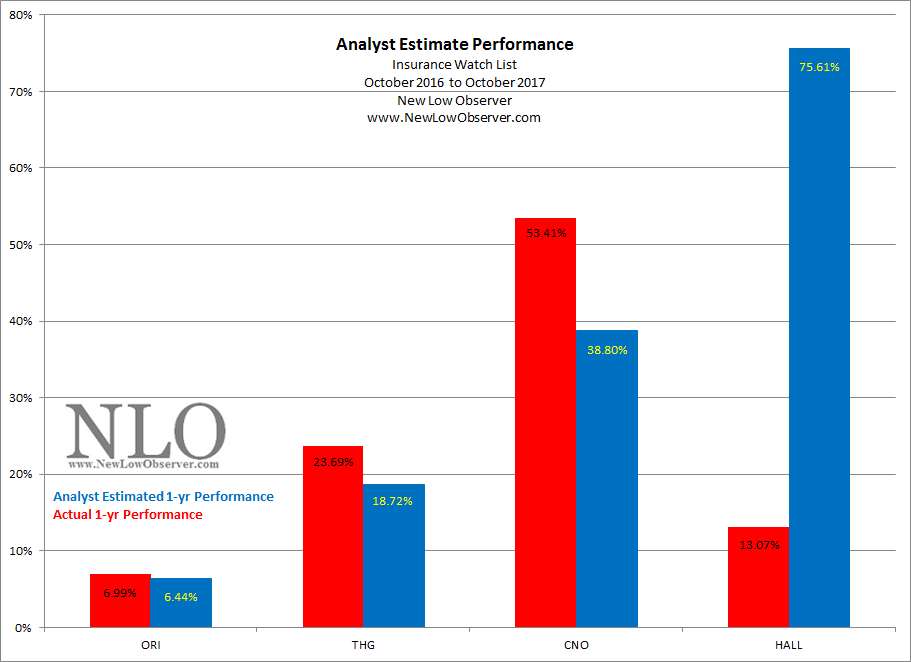
Of the four stocks, only Hallmark Financial Services (HALL) was not able to exceed expectations (assuming the low estimate and the price of the stock maintained the same p/e ratio).
In our “Sell the Principal” section we outlined the stocks that we thought investors should consider selling the principal as the price of the stocks had exceeded all reasonable one year gains. Below is the performance of the list of stocks in the order as presented at the time.
| name | 10/16.2016 | 10/6/2017 | % change |
| Syncora Holdings Ltd. | 1.35 | 2.06 | 52.59% |
| Genworth Financial, Inc. | 5.05 | 3.63 | -28.12% |
| Crawford & Company | 11.68 | 11.89 | 1.80% |
| Hilltop Holdings Inc. | 23.15 | 26.08 | 12.66% |
| Lincoln National Corporation | 48.9 | 75 | 53.37% |
| Endurance Specialty Holdings Ltd. | 91.89 | 92.98 | 1.19% |
| Principal Financial Group Inc. | 52.33 | 66.65 | 27.36% |
| Kingsway Financial Services Inc. | 5.65 | 5.95 | 5.31% |
| National Interstate Corporation | 32.42 | 32 | -1.30% |
| Stewart Information Services Corporation | 46.36 | 38.01 | -18.01% |
| Unum Group | 36.37 | 52.54 | 44.46% |
The entire list gained an average of +13.76% as compared to the iShares Dow Jones US Insurance Index ETF (IAK) gain of +20.27%. Only four stocks exceeded the performance of IAK (UNM, LNC, PFG, and SYCRF). Meanwhile, the remaining list of stocks performed well below the +20.27%. More than half the list showed below average or negative returns. This month’s “Sell the Principal” list has refined how the data is interpreted with the stated goal of highlighting those stocks expected to register negative returns after a review in October 2018.
Insurance Watch List: September 2017
Below is the insurance watch list for the month of September 2017. In additions, we have included the analyst one year estimated returns and a review of watch list stock.
Insurance Watch List: July 2017
Below is the Insurance Watch List for July 2017:
Insurance Watch List: June 2017
Below is the performance of the May 2016:
| symbol | name | May-16 | Jun-17 | % chg |
| SCRYY | SCOR SE | 3.29 | 4.06 | 23.40% |
| LFC | China Life Insurance Co. Ltd. | 10.81 | 15.5 | 43.39% |
| NWLI | National Western Life Group, Inc. | 205.51 | 320.56 | 55.98% |
| AXS | AXIS Capital Holdings Limited | 54.33 | 63.61 | 17.08% |
| RE | Everest Re Group Ltd. | 178.01 | 253.98 | 42.68% |
| IPCC | Infinity Property and Casualty Corp. | 76.55 | 94.15 | 22.99% |
| AAME | Atlantic American Corp. | 3.45 | 3.75 | 8.70% |
| MURGY | Münchener Rückversicherungs-Gesellschaft Aktiengesellschaft | 18.86 | 19.88 | 5.41% |
| ESGR | Enstar Group Limited | 155.17 | 194.5 | 25.35% |
| BWINA | Baldwin & Lyons Inc. | 23 | 23.9 | 3.91% |
The average change of the entire equal weighted list from May of 2016 was +24.89%. This is contrasted with the +19.38% gain that was achieved by the iShares Dow Jones US Insurance Index.
Insurance Watch List: April 2017
Performance Review
Below is the performance of the Insurance Watch List dated April 17, 2016:
| symbol | name | 1-yr % chg |
| OB | OneBeacon Insurance Group, Ltd. | 29.29% |
| AFSI | AmTrust Financial Services, Inc. | -36.81% |
| UVE | Universal Insurance Holdings Inc. | 36.12% |
| ZFSVF | Zurich Insurance Group AG | 21.72% |
| AXS | AXIS Capital Holdings Limited | 19.59% |
| SAFT | Safety Insurance Group Inc. | 26.33% |
| AIG | American International Group, Inc. | 7.77% |
| FFG | FBL Financial Group Inc. | 8.70% |
| AV | Aviva plc | -6.93% |
| AFG | American Financial Group Inc. | 38.31% |
The best performing insurance stock was American Financial Group (AFG) with a gain of +38.31%. The worst performing stock was AmTrust Financial Services (AFSI) with a decline of –36.81%. The average change for the entire watch list was +14.14%. This is contrasted by the iShares US Insurance ETF (IAK) change of +17.59% in the same period of time.
Below we see that the analysts had their challenges. However, the estimates for AIG in the last year were right on target. This suggests that it would be worth watching closely what the analysts have to say about AIG going forward.

Insurance Watch List: 2017
The following are the insurance stocks to watch for the coming year: