Category Archives: Insurance Watch List

Insurance Watch List: February 2017

Performance Review

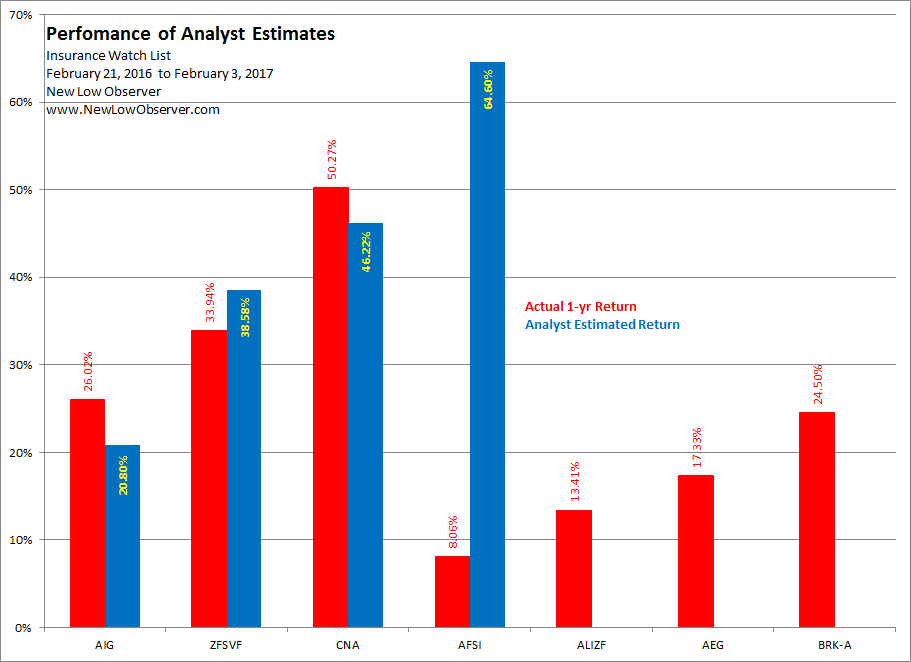
This is a review of the nearly 1-year performance of the Insurance Watch List from February 21, 2016.

image

On the whole, the analyst estimates for insurance stocks were on target.  Although AmTrust Financial Services (AFSI) did not come close to the estimated gain projected on February 2016, at least the price of the stock did not register a loss in the period of time covered.

Insurance Watch List: October 2016

Performance Review

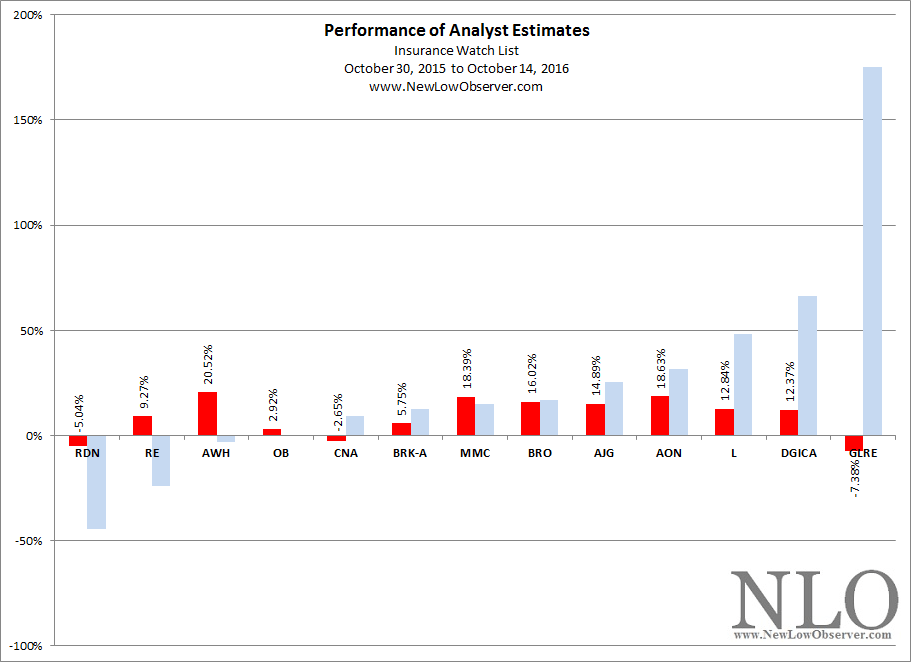
Below is the Insurance Watch List from October 2015 and the subsequent performance. The stocks are listed in the order that they were on the watch list.

symbol name 2015 2016 % chg
GLRE Greenlight Capital Re, Ltd. 21.96 20.34 -7.38%
WEDXF The Westaim Corporation 2.11 2.00 -5.21%
AWH Allied World Assurance 36.36 43.82 20.52%
RDN Radian Group Inc. 14.47 13.74 -5.04%
KFS Kingsway Financial Services Inc. 4.30 5.65 31.40%
AMIC American Independence Corp. 10.10 24.72 144.75%
DGICA Donegal Group Inc. 14.15 15.90 12.37%
OB OneBeacon Insurance Group, Ltd. 14.39 14.81 2.92%
L Loews Corporation 36.46 41.14 12.84%
RE Everest Re Group Ltd. 177.97 194.46 9.27%
BRK-A Berkshire Hathaway Inc. 204596.00 216370.00 5.75%
CNA CNA Financial Corporation 36.56 35.59 -2.65%
AON Aon plc 93.31 110.69 18.63%
BRO Brown & Brown Inc. 32.27 37.44 16.02%
AJG Arthur J Gallagher & Co. 43.73 50.24 14.89%
MMC Marsh & McLennan Companies, Inc. 55.74 65.99 18.39%

The entire watch list had an average gain of +17.97%, this is contrasted by the performance of the iShares U.S. Insurance ETF (IAK) gain of +1.74%.  A massive gain was achieved by small cap insurer American Independence (AMIC) with an increase of +144.75% after an August 31, 2016 cash offer from Independence Holding Company (IHC).  The worst performing stock was Greenlight Captial Re (GLRE) with a decline of –7.38%.

image

Watch List Review

On January 22, 2016, we posted an Insurance Watch List that highlighted 36 insurance companies.  Of the 36 companies we highlighted two that we thought stood out, CNA Financial (CNA) and Endurance Holdings (ENH).  Of the two companies we said the following:

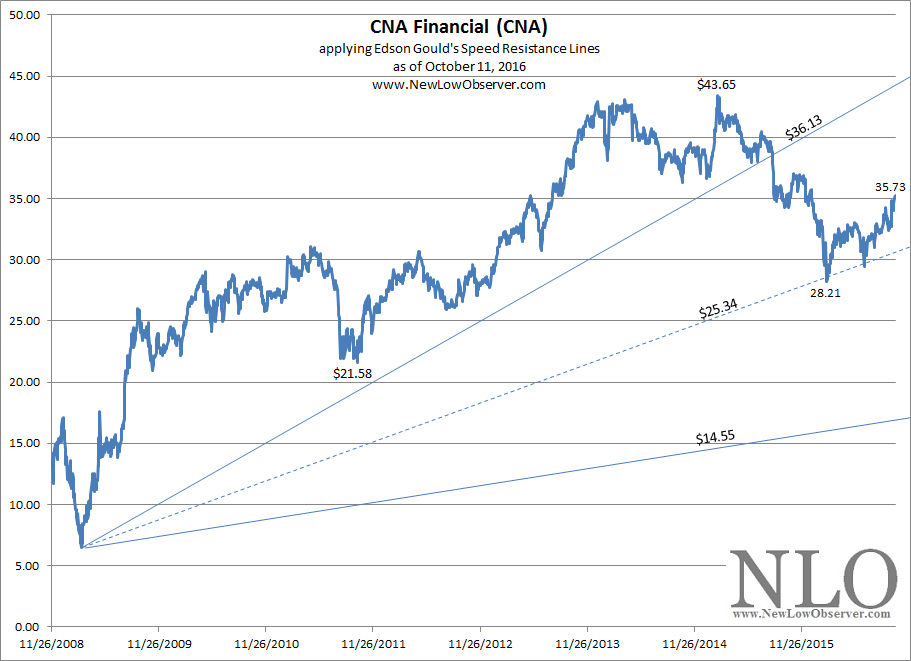
“The fact that CNA Financial has fallen below the ascending conservative downside target of $36.13 indicates that the expected range to the downside is $28.57.”

image

On a closing basis, CNA declined to the $28.21 level before rebounding to the current price at $35.70.  Assuming and investment into CNA at $28.57 or below, the gain in the stock price has been +25%.  All things being equal, CNA has upside resistance at the ascending $36.13 level, or $43.65.

Regarding Endurance Holdings (ENH), we said the following:

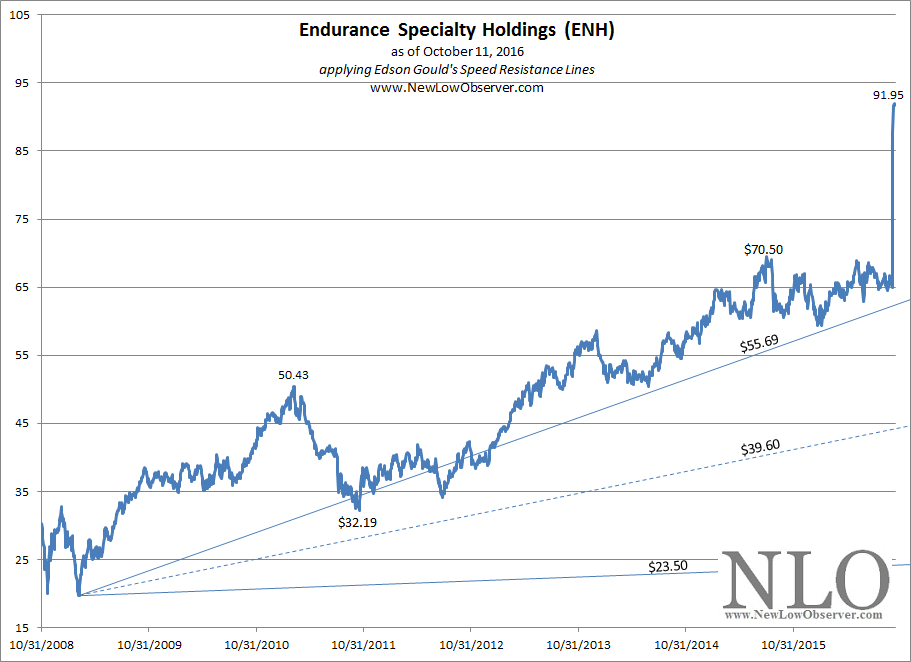
“The fundamentals say the stock is a buy and the technicals indicate that waiting is necessary.  If your goal is income at a reasonable price then accumulation of ENH is acceptable at current levels and lower.”

image

Endurance Holdings fell short of achieving our target of $55.69.  However, as the stock was still considered worth acquiring based on the January 22, 2016 posting, it merited consideration as a reasonable holding as ENH is now at $91.95 with a pending $93 all cash acquisition price by SOMPO Holdings out of Japan.

While we managed to select two companies that have managed to achieve exceptional targets, it is worth noting that among all the companies on the January 2016 watch list, 13 companies (or 36% of the entire list) had equal or better performance than the minimum +25% achieved by CNA .  Those companies are listed below:

symbol name % chg
HTH Hilltop Holdings Inc. 56.18%
ENH Endurance Specialty Holdings Ltd. 52.97%
KFS Kingsway Financial Services Inc. 51.87%
STC Stewart Information Services 40.17%
RGA Reinsurance Group of America Inc. 37.50%
AJG Arthur J Gallagher & Co. 34.18%
RDN Radian Group Inc. 33.79%
AON Aon plc 28.33%
BRO Brown & Brown Inc. 28.20%
MTG MGIC Investment Corp. 27.78%
HMN Horace Mann Educators Corp. 27.44%
MMC Marsh & McLennan Companies, Inc. 26.75%
ANAT American National Insurance Co. 26.45%


Because we always like to err on the side of caution, we have to assume that this is a high level of coincidence on our part, of which we hope to replicate if our analysis is generally accurate.

Insurance Watch List: May 2016

Performance Review

Below is the performance of the stocks listed on our watch list dated May 2015:

symbol Name 2015 2016 % chg
GLRE Greenlight Capital Re, Ltd. 30.24 20.40 -32.54%
PNX The Phoenix Companies Inc. 33.30 36.93 10.90%
CRD-B Crawford & Company 8.25 8.23 -0.24%
ACE ACE Limited 107.63 137.79 28.02%
RNR RenaissanceRe Holdings Ltd. 103.09 114.93 11.49%
BRO Brown & Brown Inc. 31.85 35.74 12.21%
      Average 4.97%

Ace Limited gains are estimates based on the stock price change since the acquisition of Chubb Limited (CB).  Ace Limited changed its name to Chubb and assumed the same stock symbol.

Market Outlook

On our watch list summary dated May 1, 2015, we said the following:

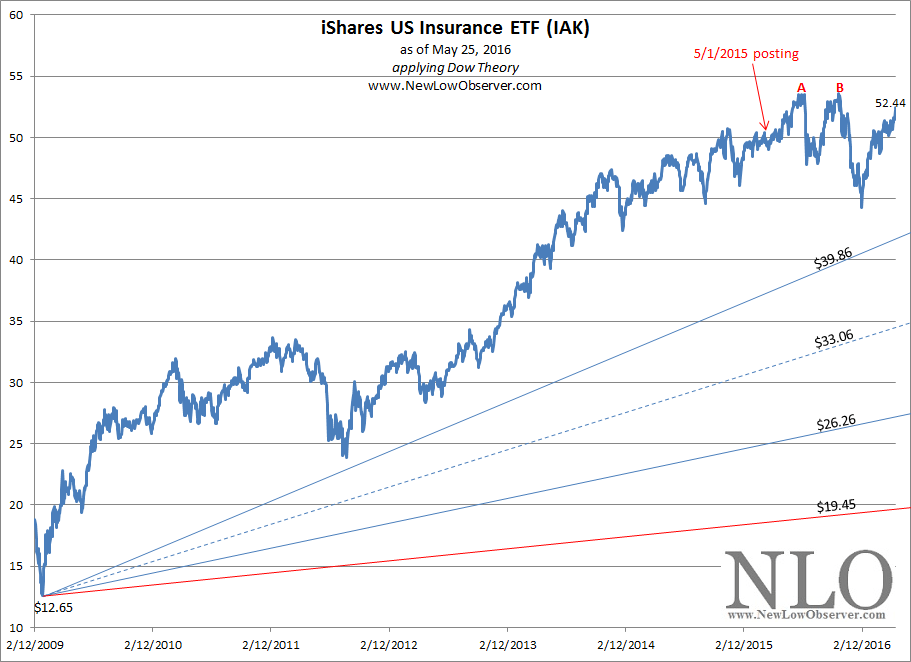
“Is the U.S. insurance sector running out of gas?  By the looks of the chart below, all indications are that the glorious run from the 2009 low may be over.  The iShares US Insurance ETF (IAK) seems to be running out of steam just as it approaches the previous high set in 2007.  A breakout to the upside is possible but not before taking a break to the downside.”

Since May 2015, the iShares US Insurance ETF (IAK) has traded in a range with some downside action and very little upside movement.

image

American insurers are making a nice recovery higher from the lows set in mid-February 2016.  However, looming ahead is the double top indicated at points A and B on the chart.  Failure to exceed these points could result in a decline below the February 2016 low.  Alternatively, a breakout to the upside could be especially profitable for investors. 

What is an investor to do under these circumstances?  It is worth noting that last year we said there was considerable risk of decline in the insurance sector, however, we also bought a couple of American insurance stocks.  both of those stock did exceptionally well relative to IAK, garnering gains of more that +20% each, relative to the IAK gain of +5%.

Continue reading

Insurance Watch List: April 2016

Below is the Watch List and Analyst Estimates for insurance stocks.

Insurance Watch List: March 2016

Below is the Insurance Watch List which includes the analyst estimates of price change in the next 12 months.

Insurance Watch List: February 2016

Performance Review

From our watch list dated February 28, 2014, we have the following performance of the listed stocks:

Symbol Name 2014 2016 % change
BRO Brown & Brown 30.1 31.48 4.58%
WSH Willis Group 41.16 44.61 8.38%
XL XL Group plc 30.4 34.28 12.76%
PKIN Pekin Life 11.99 12.4 3.42%
AXS Axis Capital 43.97 53.97 22.74%

The average gain for the listed stocks was +10.38% as compared to the iShares U.S. Insurance ETF (IAK) which gained +4.25% over the same period of time (February 28, 2014 to February 21, 2016).  Although we use IAK as a benchmark for performance, it should be noted that companies like WSH [now Willis Tower Watson (WLTW) after the merger in 2015], XL and AXS are not U.S. based insurance companies.   The stock of interest at the time was Brown & Brown (BRO) which increased +4.58%.

Continue reading

Insurance Watch List: January 2016

Performance Review

Below is the performance of the insurance watch list stocks created on August 6, 2014:

Symbol Name 2014 2015 % chg
WSH Willis Group Holdings 40.07 46.90 17.05%
L Loews Corporation 42.14 35.00 -16.94%
AFL AFLAC Inc. 59.02 57.27 -2.97%
PRA ProAssurance Corporation 43.67 48.59 11.27%
ACGL Arch Capital Group Ltd. 54.19 65.31 20.52%
PGR Progressive Corp. 23.42 29.95 27.88%
SAFT Safety Insurance Group Inc. 50.37 54.69 8.58%
RDN Radian Group Inc. 12.75 10.24 -19.69%
ORI Old Republic International 14.5 18.08 24.69%
CB The Chubb Corporation 87.44 110.04 25.85%
CLGX CoreLogic, Inc. 27.04 33.07 22.30%
CINF Cincinnati Financial Corp. 46.53 54.98 18.16%
AXS AXIS Capital Holdings Limited 44.62 53.06 18.92%
CNA CNA Financial Corporation 37.45 32.33 -13.67%
VR Validus Holdings, Ltd. 36.69 42.94 17.03%
STC Stewart Information Services 31.07 32.66 5.12%
TKOMY Tokio Marine Holdings Inc. 30.46 34.75 14.08%
KCLI Kansas City Life Insurance Company 43.45 36.24 -16.59%
AXAHY AXA Group 23.52 24.44 3.91%
PTP Platinum Underwriters Holdings Ltd. 59.87 76.35 27.53%
AJG Arthur J Gallagher & Co. 44.83 37.65 -16.02%
TDHOY T&D Holdings, Inc. 6.38 6.12 -4.08%
SIGI Selective Insurance Group Inc. 23.41 29.98 28.06%
BRO Brown & Brown Inc. 30.49 29.40 -3.57%

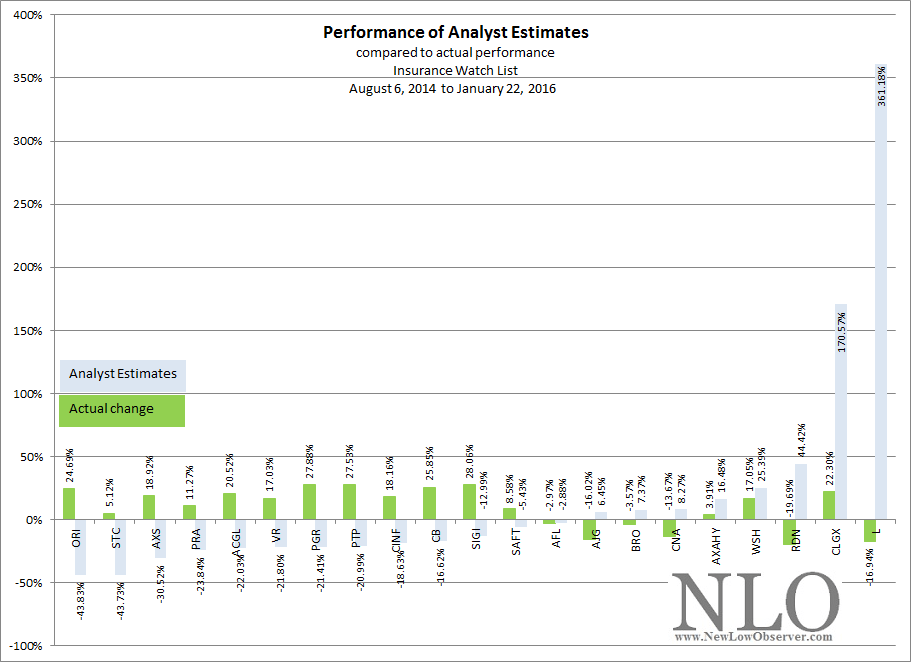
The average performance of the entire list was +8.23%.  Of note is the performance of the insurance watch list based on analyst estimated earnings.  As indicated at the time, “Our recommendation is to start with the companies that have the worst prospects, according to the analysts, and through a process of elimination determine which company has the least risks.”  As it turned out the stocks expected to perform the worse (starting on the left side of the chart) did quite well.    The only stock expected to decline in price that didn’t register a gain was Aflac (AFL).

image

Insurance Watch List: January 2016

Below is the watch list of insurance companies that we’re following:

Insurance Watch List: October 30, 2015

Performance Review

Below is the Insurance Watch List from November 6, 2012 and the subsequent performance. The stocks are listed in the order that they were on the watch list.

Symbol Name 2012 2015 % chg
TWGP Tower Group Inc. 17.68 2.5 -85.86%
PKIN Pekin Life Insurance Company 10.8 12.4 14.81%
ASI American Safety Insurance Holdings Ltd. 17.22 30.25 75.67%
FRFHF Fairfax Financial Holdings Limited 372.45 496.5 33.31%
NSEC National Security Group Inc. 8.15 13.5 65.64%
GTS Triple-S Management Corporation 17.72 20.59 16.20%
THG The Hanover Insurance Group Inc. 35.61 84.25 136.59%
OB OneBeacon Insurance Group, Ltd. 13.01 14.39 10.61%
CRVL CorVel Corporation 42.74 33.2 -22.32%
MHLD Maiden Holdings, Ltd. 8.54 15.55 82.08%
ERIE Erie Indemnity Company 66.3 87.46 31.92%
MIG Meadowbrook Insurance Group Inc. 5.72 8.65 51.22%
TDHOY T&D Holdings, Inc. 5.31 6.55 23.35%
WSH Willis Group Holdings Public Limited Company 34.87 44.61 27.93%

The entire watch list gained an average of +32% which is 30% less than the iShares US Insurance ETF (IAK) in the same period of time.  At the time, we had a strong interest in two stocks, The Hanover Insurance Group (THG) and Maiden Holdings (MHLD).  Our general assessment of both stocks was fairly accurate as THG has the top performance at +136% and MHLD was the second in performance at +82.08%.

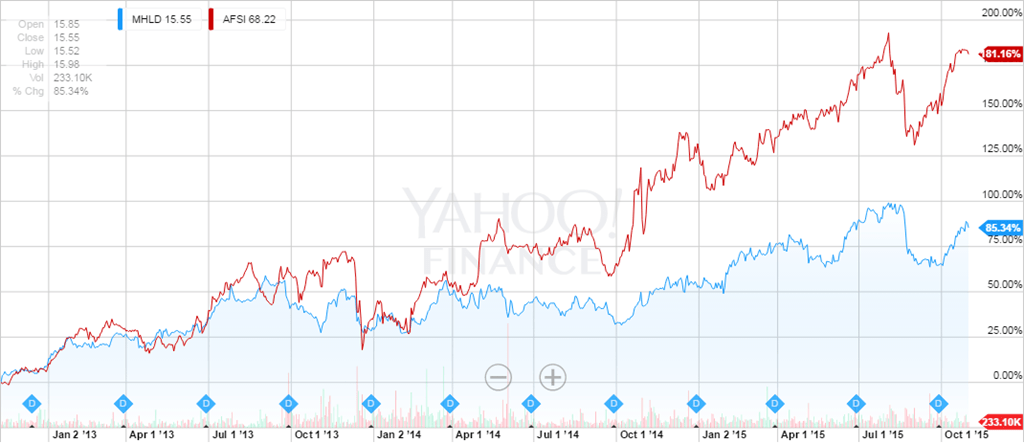
At the time, we thought that MHLD was undervalued compared to AmTrust Financial Services (AFSI).  We did a side-by-side comparison of the fundamentals to justify our view on both stocks.  Below is the comparative performance:

image

AFSI (in red) gained +181% compared to MHLD’s gain of ~82-85%.  As far was we can tell, MHLD is tracking closely to the performance of AFSI but by a dramatically lower magnitude.

The third ranked stock, in terms of performance, was American Safety Insurance Holdings (ASI) with a gain of +75% which was acquired by Fairfax Financial Holdings (FRFHF), considered to be the Berkshire Hathaway of Canada.

Technical Overview

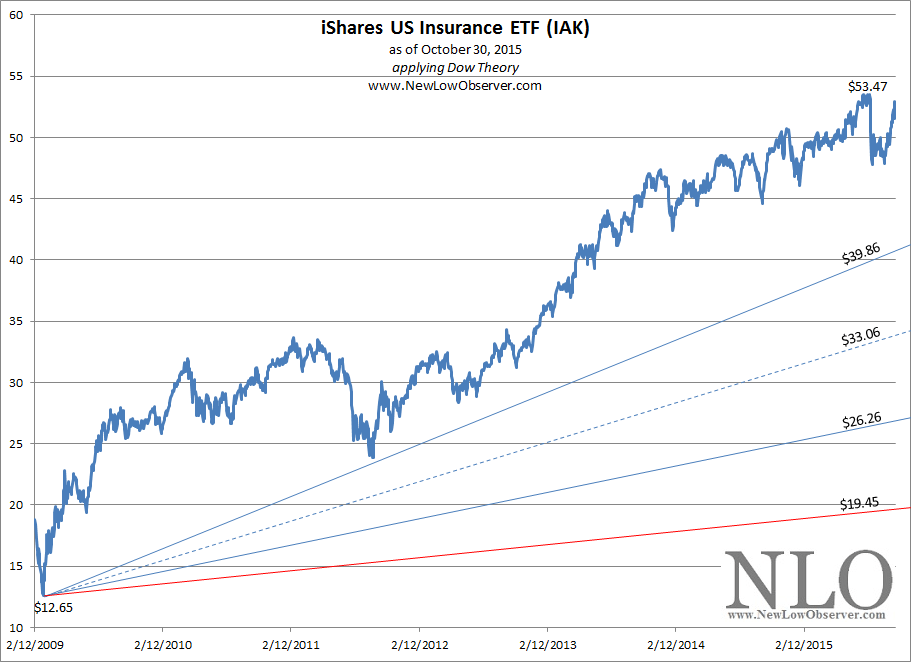
So far, it appears that the iShares US Insurance ETF (IAK) is about to put in a double top or break through to a brand new high since the low of 2009.  The chart below has applied support levels based on the work of Charles H. Dow, co-founder of the Wall Street Journal.  The ascending $39.86 level has been a support only once in late October 2011.  Since that time, IAK has kept a considerable distance from the $39.86 “support” level.  It would take a –23.84% decline to achieve the  $39.86 level and a fall of –36.83% to get to the Dow Theory fair value level of $33.06.

image

Insurance Watch List

Below is the Insurance Watch List for October 30, 2015 and the analyst estimates for the respective stocks in the coming year.

Insurance Watch List: May 1, 2015

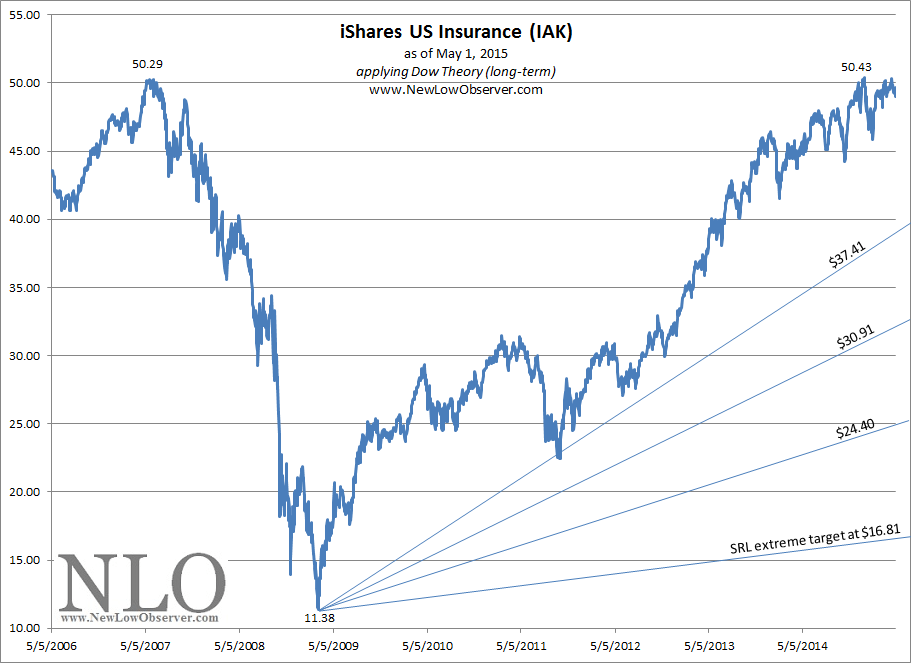
Is the U.S. insurance sector running out of gas?  By the looks of the chart below, all indications are that the glorious run from the 2009 low may be over.  The iShares US Insurance ETF (IAK) seems to be running out of steam just as it approaches the previous high set in 2007.  A breakout to the upside is possible but not before taking a break to the downside.image

The only consideration at this time is downside risk.  The chart above outlines the Dow Theory downside targets with Edson Gould’s SRL extreme downside target of $16.81.  Short-term, the downside target of $37.41 looms as a reasonable reaction from the recent peak before the sector potentially retests the prior high.  The $30.91 level is considered the fair value for the IAK and should be assumed to be a required level for a retest if a full bear market ensues.  As $11.38 was easily achieved from similar heights in the period from 2007 to 2009, so too should investors be willing to accept that $16.81 is possible.

Insurance Watch

Insurance Watch List: August 6, 2014

“Many shall be restored that are now fallen and many shall fall that are in honor.”

Horace, Ars Poetica

Insurance Watch List: February 28, 2014

Anyone who wishes to be successful in insurance stocks should read the book The Davis Dynasty by John Rothchild (found here). The book starts with Shelby Collum Davis investing approximately $50,000 to $100,000 that ultimately grew to $900 million after 47 years. The strategies employed by Davis seem highly accessible to average investors.  The following is a key insight from the book:

Insurance Watch List: January 24, 2014

Anyone who wishes to be successful in insurance stocks should read the book The Davis Dynasty by John Rothchild (found here). The book starts with Shelby Collum Davis investing approximately $50,000 to $100,000 that ultimately grew to $900 million after 47 years. The strategies employed by Davis seem highly accessible to average investors.  The following is a key insight from the book:

Insurance Watch List: June 1, 2013

Anyone who wishes to be successful in insurance stocks should read the book The Davis Dynasty by John Rothchild. The book starts with Shelby Collum Davis investing approximately $50,000 to $100,000 that ultimately grew to $900 million after 47 years. The strategies employed by Davis seem highly accessible to average investors.

Below is the insurance watch list for companies that are within 20% of their respective 52-week low.

Continue reading

W.R. Berkley: Raises Dividend +11%

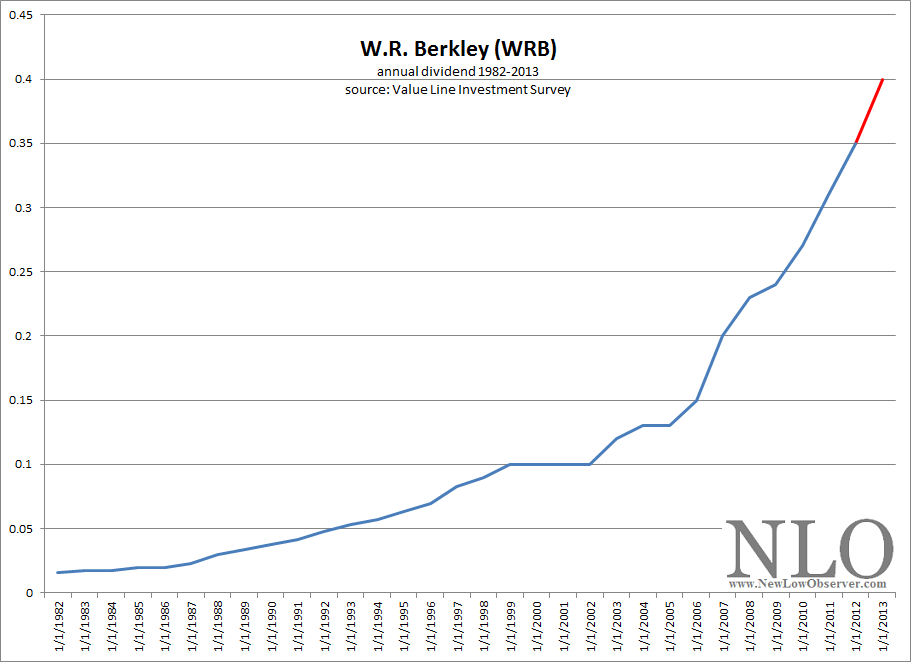
After our May 11, 2013 recommendation (found here) to consider W.R. Berkley (WRB), we get the news that WRB has announced that they will be increasing their dividend by +11% (found here).  Below is the history of dividend increases for WRB since 1982.  Please consider WRB for your long-term investment objectives.

image