Author Archives: nlo-admin

Boeing’s Accounting: Legal but Questionable

Since I’m on the hook for the pending bailout of Boeing, it is worth knowing why the company soared so much in the first place.

Below is a chart of Boeing versus the Dow Jones Industrial Average from the March 9, 2009 low to March 20, 2020.

image

Look how majestically Boeing soars above the Dow Jones Industrial Average in the period from 2012 to 2019.  As usual, the rise of Boeing wasn’t due to some kind of fluke.  It was primarily an outgrowth of a accounting method that, while very legal, was questionable.

The accounting method is known as “program accounting” which allows the company to defer the costs of building planes and book the expect profits from those planes in the future,  in the current period.  It’s the usual time travelers dream except it is done with accounting.

Thankfully, there were well informed critic of this blatant fantasy world that Boeing was living in as noted in the excerpts below.

image

“Rather than booking the huge costs of building the advanced 787 or other aircraft as it pays the bills, Boeing -- with the blessing of its auditors [Deloitte & Touche LLP] and regulators and in line with accounting rules -- defers those costs, spreading them out over the number of planes it expects to sell years into the future. That allows the company to include anticipated future profits in its current earnings (Ostrower, Jon. Boeing's Unique Accounting Helped Lift Profit. Wall Street Journal. 04 Oct 2016: B1.).”

“The problem, analysts and other critics say, is that Boeing's approach stretches its profit per plane into such a distant and uncertain future that it isn't clear if it will ever recover the nearly $30 billion it has sunk into producing the plane and validate years of projected profits (Ostrower, Jon. Boeing's Unique Accounting Helped Lift Profit. Wall Street Journal. 04 Oct 2016: B1.).”

“Boeing, which hasn't confirmed or denied the investigation, has defended its accounting -- which complies with generally accepted accounting principles -- and says its profit expectations are realistic (Ostrower, Jon. Boeing's Unique Accounting Helped Lift Profit. Wall Street Journal. 04 Oct 2016: B1.).”

image

“For Boeing, the cost of producing the Dreamliner, which was delayed by 3 1/2 years because of design and manufacturing problems, is a thorny issue. The Dreamliners delivered so far continue to cost the company much more to make than what it charges for them, a fact obscured by its soaring financial results (Ostrower, Jon. Critical Mission for Boeing: Slashing Dreamliner Costs. Wall Street Journal.08 Jan 2014: B.1.).”

“If Boeing booked the difference between current sales and costs for each product it delivers, the way most companies do, its commercial-jet division's operating profit for the first nine months of 2013 would instead have been a $69 million loss, according to company figures (Ostrower, Jon. Critical Mission for Boeing: Slashing Dreamliner Costs. Wall Street Journal.08 Jan 2014: B.1.).”

Closing Thoughts

Sadly, many defenders of the bailout of Boeing will invoke claims that COVID-19 did the company in or that jobs will be lost.  Few of those same people will look at how this could have been avoid by Boeing management.

On Deck: NextEra Energy: NextProblem

2020 v. 2008: You Are Here

On March 23, 2020, the Federal Reserve announced that they are standing ready to provide unlimited quantitative easing. Among the actions included in Fed’s announcement:

  • The Federal Open Market Committee (FOMC) will purchase Treasury securities and agency mortgage-backed securities
  • the FOMC will include purchases of agency commercial mortgage-backed securities in its agency mortgage-backed security purchases.
  • Supporting the flow of credit to employers, consumers, and businesses by establishing new programs that, taken together, will provide up to $300 billion in new financing.
  • Establishment of two facilities to support credit to large employers
  • Establishment of a third facility, the Term Asset-Backed Securities Loan Facility (TALF), to support the flow of credit to consumers and businesses.
  • expanding the Money Market Mutual Fund Liquidity Facility (MMLF)
  • Facilitating the flow of credit to municipalities by expanding the Commercial Paper Funding Facility (CPFF)
  • establishment of a Main Street Business Lending Program to support lending to eligible small-and-medium sized businesses

This action by the Federal Reserve seems eerily familiar to us.  Why?  Because March 2008 was the year many of these same programs were implemented by the Federal Reserve.

Below is a chart of the Dow Jones Industrial Average covering the 2007 to 2009 period when the Fed stepped in in a similar way.

image

The position of where you are can change very quickly based on the type of policy action taken.  The less policy action the faster the market gets closer to the “bottom.”

Review: Oil and Gas Stock Index

On January 6, 2015, we said the following of the Oil and Gas Stock Index (XOI):

“The conservative downside target of 1,454.79 has been constructed while the mid-point of 1,015.10 is also indicated.  However, we did not include the extreme downside target of 575.41.  We did indicate in red the 812.08 level which was the extent of the decline in the period from the 2008 high to the 2009 low.”

On September 7, 2015, we said the following of the XOI:

“…lurking in the background is the extreme downside target of 575.41.  Since our experience has been that the extreme downside target is commonly achieved, we hazard to guess what would happen globally to the oil market in order to decline to such a low point.”

Unfortunately, we made the following mistake on December 27, 2017 regarding the XOI:

“Assuming that the primary movement is still a bear market, then the expected upside target should have been from 1,210.15 (3/8) to 1,313.37 (½).  With the XOI above the 1,313.37 level, Dow Theory suggests that a bull market is on the way as the balance of losses sustained by the buyers near the previous peak is giving rise to optimism that breakeven on their investment is possible.”

We incorrectly interpreted Dow Theory in the belief that a bull market was on the way.  It could be argued that as the prior peak was not achieved then a bull market wasn’t signaled and therefore the analysis was somehow right.  However, we’d like anyone who uses both Dow Theory and Speed Resistance Lines to know that it is the interpretation that is incorrect and generally not the tools.

XOI Index: 2008 to 2020

image

The descending 575.41 level on the XOI Index is the equivalent of 375 (it continues to decline over time).  That will likely be the point when the XOI bounces.  From the 375 level it is uncharted territory.  However, that is the point when values will come into play and investment can be done with relative abandon.  Keep in mind the effort for many countries to phase out oil consuming vehicles.

U.S. Dividend Watch List: March 20, 2020

Could things get any worse after a horrendous week? We certainly hope the curve for COVID-19 will flatten soon but only time can tell.

The S&P 500 has broken below the 2018 low at a record setting pace and has fallen -32% from the peak.

If you think that this situation is worse than the financial crisis then we probably have more room on the downside as the market fell more than -50% in 2008.

If you have the stomach to ride this out and want to pick the bottom, there are plenty of companies on our watch list this week. Continue reading

Transaction Alert

The NLO team executed the following transaction: Continue reading

Transaction Alert

The NLO team executed the following transaction: Continue reading

AT&T Yield Profile

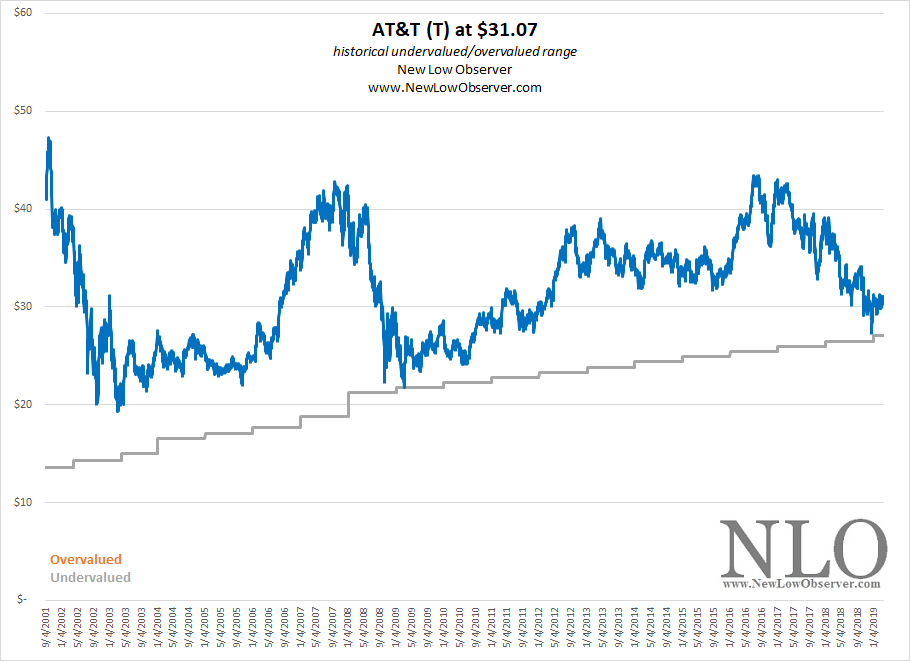
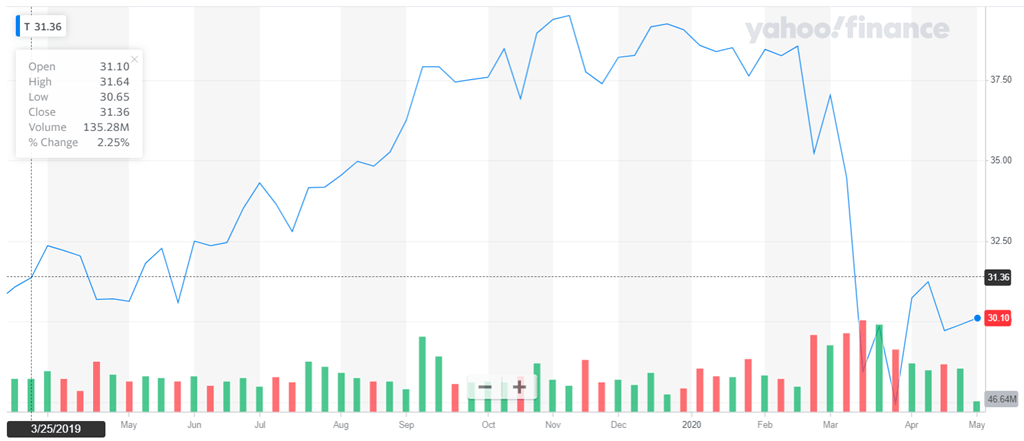
AT&T stock has fallen -11% in 2020 yet it has outperformed the S&P 500 Index by 5%. Perhaps the largest driver for that could be the dividend yield.

As of the closing price on Friday March 13, 2020, the dividend yield for AT&T sits at 6.64%.

This leads us to do some comparative assessment of the AT&T dividend since 1984 until now. Not only will we look at the absolute yield but we will compare this to the risk-free guaranteed rate from the 10-year treasury. Continue reading

DJIA Yield Profile: March 12, 2020

This bear market has taken everything in its path down. Unless you are shorting the market, there is nowhere to hide. Perhaps the most scary thing is that this downturn is probably far from over.

The rate of change for new cases for COVID-19 continue to rise and even accelerate. Until we see a deceleration in the total cases for the US, the market will continue to fall.

The first chart comes from worldometers.info which we believe has better data than WHO (data from WHO shows 0 new cases over the past weekend).

COVID19_ActiveCase_03.12.2020

Despite the bad news, we are persistent in keeping our focus on long-term investment opportunities. If and when this is behind us, there will be tremendous opportunity to purchase blue-chip companies that will provide you with higher than average income. Take the Dow Jones Industrial as example.

Based on the close of March 12, 2020, the dividend yield reached 3%. Contrast that with 10-year T-Bill which fell below 1%. The risk-premium on the Dow (based on yield) spike to 2%.

This is not an indication that a bottom is here or even near. However, from an investment perspective, investing $10,000 today in the Dow seems like a better bet than a bond that will mature in 2030.

image

This too shall pass and we can't wait until then. Please take care of yourself and those around you.

U.S. Dividend Watch List: February 28, 2020

Prior Year Watch List Review (March 1, 2019)

The best performing strategy this week was buying low P/B companies. The best performer was Quaint Oak Bankcorp (QNTO) which rose +20.00% in a year. Even through this sell off, shares barely moved. The worst performing strategy was high P/E with Nucor (NUE) dropping nearly -60.00% in a year. Below is a summary of the performance by various strategies.

March 1, 2019
Strategy High Low
Yield 0.3% -13.8%
P/E -20.3% -7.7%
Payout Ratio -0.1% -7.6%
P/B -19.3% 4.4%
Closest to Low   -4.2%
S&P 500   5.4%
Dow Jones Ind   -2.4%
Top 5 companies except for Index

U.S. Dividend Watch List February 29, 2020

It was a bloodbath last week as the market sold off. Would this be a buying opportunity? Only time will tell but here is a list of companies on our watch list. Continue reading

Virgin Galactic Downside Targets

Below are the downside targets for Virgin Galactic Holdings (SPCE).

image

  • $25.54 (conservative target)
  • $19.85 (mid-range target)
  • $14.16 (extreme target)

Virgin Galactic Holdings (SPCE) is creating a scenario where the extreme downside target could easily be achieved while being considered a normal “bounce.” The price would have to rise to above $60 before the above downside targets are no longer valid.

These situations don’t end well but in case the price doubles from the recent peak we provide the following downside targets.

  • $39.71 (conservative target)
  • $34.02 (mid-range target)
  • $28.33 (extreme target)

Transaction Alert

The NLO team executed the following transaction(s): Continue reading

U.S. Dividend Watch List: February 14, 2020

Prior Year Watch List Review (February 14, 2019)

The best strategy to adopt was to purchase the top five companies with high P/E. Doing so would yield 23.1% return compare to the market return of 21.8%. Worse performing strategy is to purchase low P/E companies. The largest gain came from Brown-Forman (BF-B) which rose 46%. At the time of trading, P/E for BF-B was 31.6. Below is a recap of various strategy.

February 15, 2019
Strategy High Low
Yield 8.7% 20.8%
P/E 23.1% -1.8%
Payout Ratio 17.9% 7.0%
P/B 14.2% 6.0%
Closest to Low   2.8%
S&P 500   21.8%
Dow Jones Ind   13.6%
Top 5 companies except for Index

U.S. Dividend Watch List February 14, 2020

The market continue to defy gravity and closed the week at another all-time high. Below is a the dividend watch list for this week. Continue reading

Market Return After Exceptional Years

2019 was an exceptional year to be long equities. The S&P 500 gained +30.40% which is the 6th time the market put up gain of +30% or more. This peaked our interest in subsequent market returns after an exceptional year. We compiled and analyzed the data for our readers.

Below is the market return after the S&P 500 gained +30% or more. The average return in the subsequent year was +20% with 100% success rate.

Index Year % Change Subsequent Year % Change
S&P 500 1954 44% 24%
S&P 500 1958 37% 8%
S&P 500 1975 31% 19%
S&P 500 1995 34% 20%
S&P 500 1997 31% 27%
S&P 500 2019 30% ?

Reducing the market return for the S&P 500 to +25%, the success rate dropped to 83.30% and the only 2 subsequent down years were 1981 and 1990. The average return under this assumption is +12%.

Index Year % Change Subsequent Year % Change
S&P 500 1954 44.2% 23.8%
S&P 500 1958 36.9% 8.0%
S&P 500 1975 31.4% 19.1%
S&P 500 1980 25.8% -9.7%
S&P 500 1985 26.4% 14.6%
S&P 500 1989 27.3% -6.6%
S&P 500 1991 26.3% 4.5%
S&P 500 1995 34.1% 20.3%
S&P 500 1997 31.0% 26.7%
S&P 500 1998 26.7% 19.5%
S&P 500 2003 26.4% 9.0%
S&P 500 2013 29.6% 11.5%
S&P 500 2019 30.4% ?

Taking this return down to +20% didn’t change the success rate of having a positive return in the subsequent year. The success rate remain at 83.30% but the average return dropped slightly to +11%.

Index Year % Change Subsequent Year % Change
S&P 500 1950 22.6% 14.4%
S&P 500 1954 44.2% 23.8%
S&P 500 1955 23.8% 3.3%
S&P 500 1958 36.9% 8.0%
S&P 500 1961 24.3% -11.8%
S&P 500 1967 20.1% 7.7%
S&P 500 1975 31.4% 19.1%
S&P 500 1980 25.8% -9.7%
S&P 500 1985 26.4% 14.6%
S&P 500 1989 27.3% -6.6%
S&P 500 1991 26.3% 4.5%
S&P 500 1995 34.1% 20.3%
S&P 500 1996 20.3% 31.0%
S&P 500 1997 31.0% 26.7%
S&P 500 1998 26.7% 19.5%
S&P 500 2003 26.4% 9.0%
S&P 500 2009 23.5% 12.6%
S&P 500 2013 29.6% 11.5%
S&P 500 2019 30.4% ?

The last table shows subsequent return when the market rises +15% or more. Under this circumstances, the market rose 70.80% of the time with an average return of +6.90%.

Index Year % Change Subsequent Year % Change
S&P 500 1950 22.6% 14.4%
S&P 500 1954 44.2% 23.8%
S&P 500 1955 23.8% 3.3%
S&P 500 1958 36.9% 8.0%
S&P 500 1961 24.3% -11.8%
S&P 500 1963 18.9% 13.0%
S&P 500 1967 20.1% 7.7%
S&P 500 1972 15.6% -17.4%
S&P 500 1975 31.4% 19.1%
S&P 500 1976 19.1% -11.5%
S&P 500 1980 25.8% -9.7%
S&P 500 1983 17.3% 1.4%
S&P 500 1985 26.4% 14.6%
S&P 500 1989 27.3% -6.6%
S&P 500 1991 26.3% 4.5%
S&P 500 1995 34.1% 20.3%
S&P 500 1996 20.3% 31.0%
S&P 500 1997 31.0% 26.7%
S&P 500 1998 26.7% 19.5%
S&P 500 1999 19.5% -10.1%
S&P 500 2003 26.4% 9.0%
S&P 500 2009 23.5% 12.6%
S&P 500 2013 29.6% 11.5%
S&P 500 2017 18.7% -6.6%
S&P 500 2019 30.4% ?

Updated 1/28/2024 - Market Return After Exceptional Year – 2023

WorkDay Downside Targets

Below are the downside targets for WorkDay Inc. (WDAY).

image

  • $140.86 (conservative target)
  • $107.81 (mid-range target)
  • $74.77 (extreme target)

The downside targets are based on the peak price of $224.30.  In our view, WorkDay failed to achieve the minimum downside target of the ascending level at $140.86.  In many respects, this reflects the strength of buyers.  However, this failure would not have allowed us to take advantage of the reversal that has occurred since the $152.29 low. 

With this in mind, we have posted the upside resistance targets based on the October 23, 2019 low.  These target are meant to confirm the strength of the rise and the potential for additional gains/losses going forward.

WorkDay Upside Resistance Targets

Based on the decline from the peak at $224.30, WorkDay Inc. (WDAY) has the following upside resistance levels:

  • $188.30
  • $200.14
  • $212.42

image

Based on the low of $152.29, WorkDay Inc. increased beyond the initial upside resistance target of $188.30 and then broke down below that level.  However, the true test of any momentum is the ability to rise and then fall without going below the prior low, in this case $152.29.

Each of the levels indicated are critical resistance levels that should see a material decline in the stock price.  Exceeding each level lends support to the stock price going to the next level.  For this reason, we expect that the $212.42 price should see some resistance due to the rapid run-up from the December 13, 2019 low. In this case, resistance means a vacillation between the descending $212.42 and $200.34 price levels.

A rise to $224.30 means that a new bull run is in the cards and should be hedged according.