
- Japan
- Market Indicator
- Price Momentum Indicators
- Richard Russell
- Silver
- Speed Resistance Lines
- U.S. Dividend Watch List
Category Archives: TSLA
Tesla Price Momentum Indicator
Below is the Price Momentum for Tesla Inc.
Tesla Downside Targets
Below is a chart of Tesla Inc. (TSLA) from 2019 to 2024, reflecting Edson Gould’s Speed Resistance Lines.
Posted in Edson Gould, Speed Resistance Lines, SRL, Tesla Motors, TSLA
Tagged members
Tesla Price Momentum
Below is a chart of Tesla Inc. (TSLA) from 2012 to 2022, reflecting Price Momentum data.
Tesla Price Momentum
Below is a chart of Tesla Inc. (TSLA) from 2012 to 2021, reflecting Price Momentum data.
Tesla Downside Targets
Review
We have run Tesla Downside targets in the past.
-
September 8, 2018 (FAILED)
-
July 7, 2020 (FAILED)
All parabolic moves get corrected by a specific amount, at minimum. Because a declining trend has begun, we have run the numbers of the expected downside targets based on Edson Gould’s Speed Resistance Lines.

The targets are:
-
$238.35
-
$202.23
-
$166.11
The previous FAILED downside targets had significant problems that could have been easily remedied. First and foremost, for highly volatile stocks like Tesla, we did not include downside targets assuming the price would double. This is usually the most likely scenario to play out and is best represented in our September 13, 2018 targets for Tilray (TLRY).
At the time, Tilray was trading at $118 and we had laid out our downside targets for the stock as seen for Tesla above. However, acknowledging the psychological component of the change in the price, we included downside targets for Tilray if the price doubled ($236) [within the chart]. In fact, Tilray did double shortly afterwards and the downside targets for the doubled level were achieved, by a wide margin.
The doubling downside targets for TSLA are (assumes $996.64 peak):
-
$404.45
-
$368.33
-
$332.21
We’re glad to have failed the previous times as it refines and teaches what we need to know about the limits of Edson Gould’s work. We hope to continue the process of learning as we teach.
See also:
Top three downside targets achieved by year
2020
2019
2018
2017
2016
Posted in Edson Gould, Speed Resistance Lines, SRL, TSLA
Tesla Downside Targets
Below are the downside targets for Tesla Inc. (TSLA) as of July 7, 2020.

-
$824.51 (conservative target)
-
$643.90 (mid-range target)
-
$463.29 (extreme target)
Parabolic increases rarely go unchecked. This typically means that a decline to the conservative downside target is the norm, at minimum. However, Tesla has had a history of defying the “norm” when it comes to price change.
see also: TSLA downside targets achieved
Posted in downside, parabolic, Speed Resistance Lines, SRL, TSLA
Update: Tesla Inc. Targets
When Tesla (TSLA) was trading at $734.70, we said the following:
“Parabolic increases rarely go unchecked. This typically means that a decline to the conservative downside target is the norm, at minimum. However, Tesla has had a history of defying the “norm” when it comes to price change.”
At that time, February 5, 2020, we provided the following downside targets:
-
$507.09 (conservative target)
-
$401.39 (mid-range target)
-
$295.69 (extreme target)
Seventeen days after our downside price targets, the price of TSLA increased as high as $917.42 on a closing basis. The increase in price marginally affected the downside targets for TSLA. So far, Tesla has achieved two of the three downside targets and looks to easily achieve the last target (extreme downside target).
Below are the updated downside targets for Tesla Inc. (TSLA).

-
$517.21 (conservative target)
-
$411.51 (mid-range target)
-
$305.81 (extreme target)
Pendulums swing from one extreme to another. We’ll watch to see if the extreme to the upside is matched on the downside.
Posted in Speed Resistance Lines, SRL, TSLA
Transaction Alert
The NLO team executed the following transaction: Continue reading
Tesla Downside Targets
Below are the downside targets for Tesla Inc. (TSLA).

-
$507.09 (conservative target)
-
$401.39 (mid-range target)
-
$295.69 (extreme target)
Parabolic increases rarely go unchecked. This typically means that a decline to the conservative downside target is the norm, at minimum. However, Tesla has had a history of defying the “norm” when it comes to price change.
Posted in downside, parabolic, Speed Resistance Lines, SRL, TSLA
Tesla Motors: On the Ropes?
On May 22, 2019, Citi analyst Itay Michaeli suggested that Tesla Motors (TSLA) could decline as low at $36.

Meanwhile, on May 21, 2019, Morgan Stanley has put a decline to $10 on the stock price into play.

Our work of September 8, 2018 laid bare the technical attributes that were likely outcomes for Tesla Motors. The upside of using technical indications is that it leaves out the narrative and only includes precedent, both positive and negative.
In that 2018 posting, we offered two types of technical review, Speed Resistance Lines (SRL) as outlined by Edson Gould and “Three Peaks and a Domed Housed (3PDh) as presented by George Lindsay.
Already, Tesla has achieved the $200.17 price target that was set by the SRL analysis. We’re curious to see if the $76 target is achieve as outlined in the 3PDh analysis.
As a reiteration of the more conservative downside analysis from September 8, 2018:
“The extreme downside target of $128.33 would be the last stop before a retest of the $100 level. In all the prior history of stocks that we’ve tracked using the SRL, 80% eventually go back to the extreme downside target before the bottom drops out or the stock attains new highs. Based on this observation, we’re highly confident that given the nature of Tesla, declining to the $150 to $127 level is a lock.”
Posted in 3PDh, Edson Gould, George Lindsay, SRL, TSLA
Tesla Motors Added to Nasdaq 100, The Countdown Begins
On July 8, 2013, it was announced that Tesla Motors (TSLA) would join the Nasdaq 100 starting on July 15, 2013 (PR here). Our analysis of Tesla will follow the review and performance of additions and deletions to the NASDAQ 100 Index.
As has been well documented on our site, the Nasdaq OMX has a history of adding and deleting companies on the Nasdaq 100 Index in a manner that is consistent with a money losing speculator. The most recent example of the NASDAQ OMX follies, prior to TSLA, was when Netflix (NFLX) was added to the index after the stock price rose +141.32%…after being dropped from the index on December 24, 2012 (PR here). Not to be outdone by itself, the NASDAQ OMX team previously added NFLX to the Nasdaq 100 on December 20, 2010 (PR here).
Our NASDAQ OMX debrief on NFLX additions and deletion:
-
Added to Nasdaq 100 on 12/20/2010: stock declines –49.32%
-
Dropped from Nasdaq 100 on 12/24/2012: stock gains +141.32%
-
Added to Nasdaq 100 on 6/6/2013: to be determined; up +11.98% so far
In our annual Nasdaq 100 Re-Rank Review in December 2012 (found here; includes 2010 and 2011 reviews), we pointed out that the stocks being dropped from the index typically outperform the stocks that are added to the index within the first year (our minimum benchmark). Below is the performance of the stocks that were added or dropped since the Nasdaq 100 changes on December 24, 2012:
|
Symbol
|
Name | 12/24/2012 | 7/10/2013 | % change | |
| ADI | Analog Devices, Inc. | 41.35 | 46.73 | 13.01% | added |
| CTRX | Catamaran Corporation | 49.2 | 47.31 | -3.84% | added |
| DISCA | Discovery Comm. | 60.82 | 82.86 | 36.24% | added |
| EQIX | Equinix, Inc. | 198.56 | 190.84 | -3.89% | added |
| LBTYA | Liberty Global Inc. | 60.31 | 77.42 | 28.37% | added |
| LMCA | Liberty Media Corporation | 110.5 | 135.06 | 22.23% | added |
| REGN | Regeneron Pharmaceuticals | 179.71 | 236.7 | 31.71% | added |
| SBAC | SBA Communications Corp. | 69.62 | 75.94 | 9.08% | added |
| VRSK | Verisk Analytics, Inc. | 48.84 | 61.67 | 26.27% | added |
| WDC | Western Digital Corporation | 37.78 | 67.23 | 77.95% | added |
| Average | +23.71% | ||||
|
Symbol
|
Name | 12/24/2012 | 7/10/2013 | % change | |
| APOL | Apollo Group Inc. | 21.02 | 17.89 | -14.89% | dropped |
| EA | Electronic Arts Inc. | 15.3 | 23.9 | 56.21% | dropped |
| FLEX | Flextronics International | 6.09 | 7.86 | 29.06% | dropped |
| GMCR | Green Mountain Coffee | 40.32 | 70.09 | 73.83% | dropped |
| LRCX | Lam Research Corporation | 36.37 | 49.52 | 36.16% | dropped |
| MRVL | Marvell Technology Group | 8.21 | 11.71 | 42.63% | dropped |
| NFLX | Netflix, Inc. | 93.3 | 243.82 | 161.33% | dropped |
| RIMM | Research In Motion Limited | 14.04 | 9.28 | -33.90% | dropped |
| VRSN | VeriSign, Inc. | 35.9 | 45.66 | 27.19% | dropped |
| WCRX | Warner Chilcott plc | 11.7 | 19.53 | 66.92% | dropped |
| Average | +44.45% |
As can be seen in the table above, on average, the stocks that were “added” underperformed the stocks that were “dropped” by 87%. To be fair, if we exclude the gains of Netflix (NFLX), then the gains of the stocks “dropped” from the index would fall to +31.47%. However, this is still nearly 33% greater than the gains achieved by the stocks that were “added” to the Nasdaq 100 Index. Alternatively, if the highest performing stocks were deleted from each group, then the gains would be +17.69% for “added” versus +31.47% for “dropped”.
We understand that the parameters for addition and deletion of companies to the Nasdaq 100 are mechanical and therefore cannot discern qualitative aspects of the stocks being included in the index. However, individual investors should strategize around some of the demonstrated weakness and strengths of companies added to and dropped from the Nasdaq 100 Index.
Tesla Downside Targets
With Tesla being added to the Nasdaq 100 after the stock has climbed a parabolic wall of worry, it seems fitting that we are now able to project downside targets for the stock applying Edson Gould’s Speed Resistance Lines (SRL). Below is the SRL for Tesla Motors as of July 10, 2013:

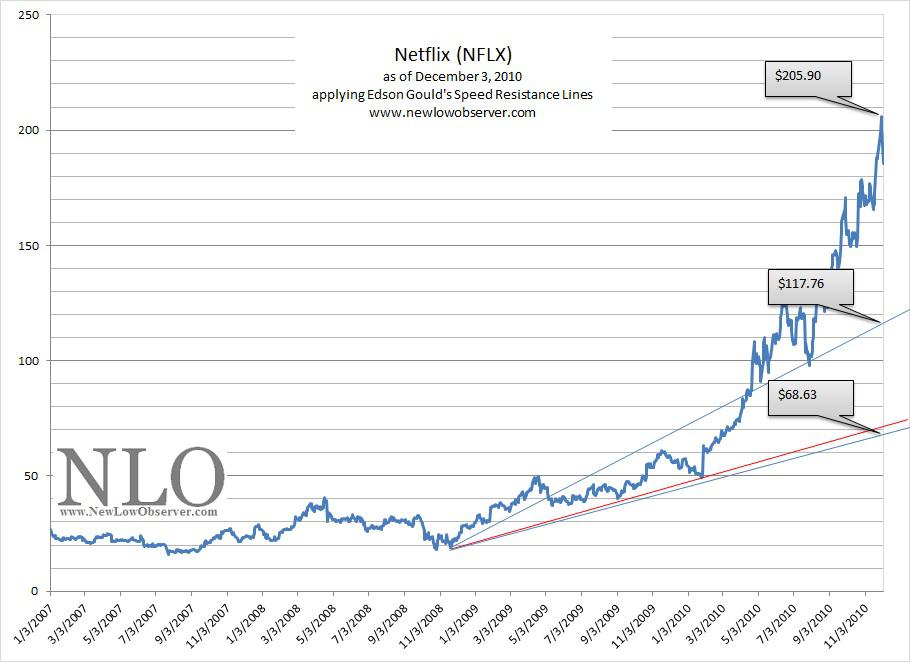
Few stocks that we have run the SRL on had such an extraordinary climb in price. Even our Netflix SRL (found here) from December 3, 2010 had a more gradual rate of increase. Based on Edson Gould’s SRL, TSLA has a conservative downside target of $64.56 while the extreme downside target is set at $41.77. There is the off-chance that TSLA could go as low as $30. However, this interpretation cannot be taken into consideration until TSLA reaches the $41 level.
Keep in mind that falling by half is not an easy task. As was the case with our Netflix SRL from December 3, 2010, NFLX climbed +61.08% before falling below both our conservative and extreme downside targets. We don’t short stocks based on SRL. Instead, we consider buying stocks once they achieve our downside targets.
With Tesla Motors being added to the Nasdaq 100 Index after having an increase in price by +264% in the last six months, there will be plenty of action for this stock in the short and long-term.
Posted in Nasdaq 100, Netflix, NFLX, Tesla Motors, TSLA