Below is a chart of the Netflix (NFLX) from 2010 to 2022, reflecting Price Momentum data. Continue reading

- Japan
- Market Indicator
- Price Momentum Indicators
- Richard Russell
- Silver
- Speed Resistance Lines
- U.S. Dividend Watch List

Below is a chart of the Netflix (NFLX) from 2010 to 2022, reflecting Price Momentum data. Continue reading
On July 8, 2013, it was announced that Tesla Motors (TSLA) would join the Nasdaq 100 starting on July 15, 2013 (PR here). Our analysis of Tesla will follow the review and performance of additions and deletions to the NASDAQ 100 Index.
As has been well documented on our site, the Nasdaq OMX has a history of adding and deleting companies on the Nasdaq 100 Index in a manner that is consistent with a money losing speculator. The most recent example of the NASDAQ OMX follies, prior to TSLA, was when Netflix (NFLX) was added to the index after the stock price rose +141.32%…after being dropped from the index on December 24, 2012 (PR here). Not to be outdone by itself, the NASDAQ OMX team previously added NFLX to the Nasdaq 100 on December 20, 2010 (PR here).
Our NASDAQ OMX debrief on NFLX additions and deletion:
In our annual Nasdaq 100 Re-Rank Review in December 2012 (found here; includes 2010 and 2011 reviews), we pointed out that the stocks being dropped from the index typically outperform the stocks that are added to the index within the first year (our minimum benchmark). Below is the performance of the stocks that were added or dropped since the Nasdaq 100 changes on December 24, 2012:
|
Symbol
|
Name | 12/24/2012 | 7/10/2013 | % change | |
| ADI | Analog Devices, Inc. | 41.35 | 46.73 | 13.01% | added |
| CTRX | Catamaran Corporation | 49.2 | 47.31 | -3.84% | added |
| DISCA | Discovery Comm. | 60.82 | 82.86 | 36.24% | added |
| EQIX | Equinix, Inc. | 198.56 | 190.84 | -3.89% | added |
| LBTYA | Liberty Global Inc. | 60.31 | 77.42 | 28.37% | added |
| LMCA | Liberty Media Corporation | 110.5 | 135.06 | 22.23% | added |
| REGN | Regeneron Pharmaceuticals | 179.71 | 236.7 | 31.71% | added |
| SBAC | SBA Communications Corp. | 69.62 | 75.94 | 9.08% | added |
| VRSK | Verisk Analytics, Inc. | 48.84 | 61.67 | 26.27% | added |
| WDC | Western Digital Corporation | 37.78 | 67.23 | 77.95% | added |
| Average | +23.71% | ||||
|
Symbol
|
Name | 12/24/2012 | 7/10/2013 | % change | |
| APOL | Apollo Group Inc. | 21.02 | 17.89 | -14.89% | dropped |
| EA | Electronic Arts Inc. | 15.3 | 23.9 | 56.21% | dropped |
| FLEX | Flextronics International | 6.09 | 7.86 | 29.06% | dropped |
| GMCR | Green Mountain Coffee | 40.32 | 70.09 | 73.83% | dropped |
| LRCX | Lam Research Corporation | 36.37 | 49.52 | 36.16% | dropped |
| MRVL | Marvell Technology Group | 8.21 | 11.71 | 42.63% | dropped |
| NFLX | Netflix, Inc. | 93.3 | 243.82 | 161.33% | dropped |
| RIMM | Research In Motion Limited | 14.04 | 9.28 | -33.90% | dropped |
| VRSN | VeriSign, Inc. | 35.9 | 45.66 | 27.19% | dropped |
| WCRX | Warner Chilcott plc | 11.7 | 19.53 | 66.92% | dropped |
| Average | +44.45% |
As can be seen in the table above, on average, the stocks that were “added” underperformed the stocks that were “dropped” by 87%. To be fair, if we exclude the gains of Netflix (NFLX), then the gains of the stocks “dropped” from the index would fall to +31.47%. However, this is still nearly 33% greater than the gains achieved by the stocks that were “added” to the Nasdaq 100 Index. Alternatively, if the highest performing stocks were deleted from each group, then the gains would be +17.69% for “added” versus +31.47% for “dropped”.
We understand that the parameters for addition and deletion of companies to the Nasdaq 100 are mechanical and therefore cannot discern qualitative aspects of the stocks being included in the index. However, individual investors should strategize around some of the demonstrated weakness and strengths of companies added to and dropped from the Nasdaq 100 Index.
Tesla Downside Targets
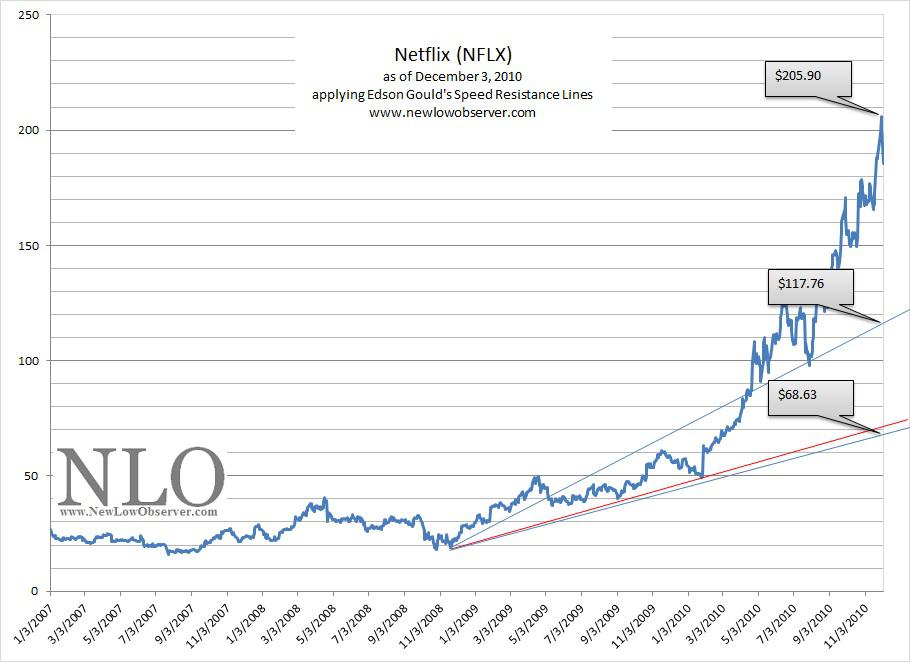
With Tesla being added to the Nasdaq 100 after the stock has climbed a parabolic wall of worry, it seems fitting that we are now able to project downside targets for the stock applying Edson Gould’s Speed Resistance Lines (SRL). Below is the SRL for Tesla Motors as of July 10, 2013:

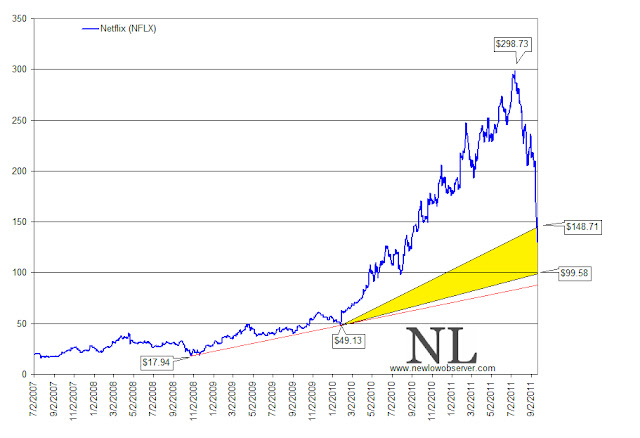
Few stocks that we have run the SRL on had such an extraordinary climb in price. Even our Netflix SRL (found here) from December 3, 2010 had a more gradual rate of increase. Based on Edson Gould’s SRL, TSLA has a conservative downside target of $64.56 while the extreme downside target is set at $41.77. There is the off-chance that TSLA could go as low as $30. However, this interpretation cannot be taken into consideration until TSLA reaches the $41 level.
Keep in mind that falling by half is not an easy task. As was the case with our Netflix SRL from December 3, 2010, NFLX climbed +61.08% before falling below both our conservative and extreme downside targets. We don’t short stocks based on SRL. Instead, we consider buying stocks once they achieve our downside targets.
With Tesla Motors being added to the Nasdaq 100 Index after having an increase in price by +264% in the last six months, there will be plenty of action for this stock in the short and long-term.
Posted in Nasdaq 100, Netflix, NFLX, Tesla Motors, TSLA
In retrospect, everything appears “oh so clear.” We love history and attempt to interpret events from the past as a means to project into the future, assuming everything remains the same. Which is why the chart below seems so stunning to us.
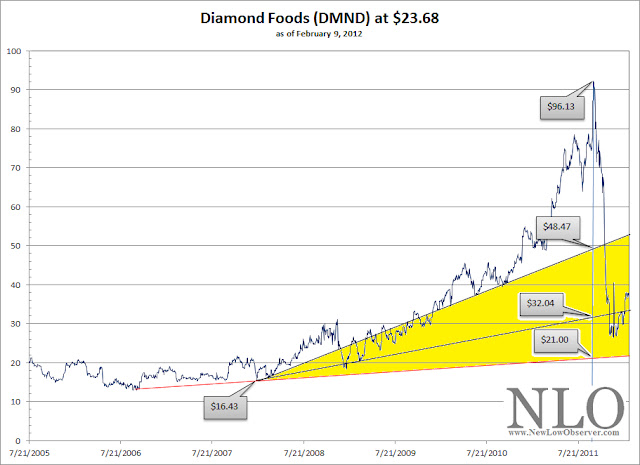
The above chart of Diamond Foods (DMND), which has recently been blown out the water due to some accounting “irregularities” and the dismissal of the CEO and CFO, demonstrates the seeming power of Edson Gould’s speed resistance lines (SRL). First, notice that the high of DMND was at$96.13, the starting point for all analysis of SRLs. Based on the high of $96.13, the conservative downside target would have been the $48.47 level. At the same time, the extreme downside target would have been the $21.00 level with an intermediate downside target of $32.04.
Amazingly, every downside target has been met with DMND reaching as low as $21.44 , on an intraday low. By the way, little mention has been made of the accounting firm that signed off on Diamond Foods spurious books.
Already, in our prior work, we've seen a Netflix (NFLX) SRL, done in December 2010, give us an extreme downside target of $66. Almost a year later, NFLX declined through the $66 level to fall to as low as $62.37 on November 30, 2011. Another SRL that we ran before it came to fruition was Green Mountain Coffee Roasters(GMCR) on October25, 2011. At the time, GMCR was trading at $64.75. We estimated, using the SRL, that GMCR had an extreme downside target of $37.21. The stock recently fell as low as $39.42 as reviewed in our February2, 2012 posting.
Below is the latest speed resistance lines for a stock that we've been curious about for some time, Clean Harbors (CLH).
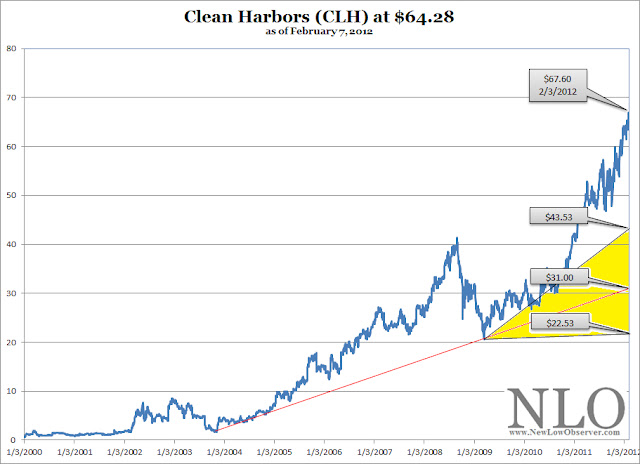
Some could reasonably argue that we’re allowing correlation to equal causation, which we’d gladly confess to. However, this explains why we a reactively seeking companies which we can run Edson Gould’s SRLs beforehand to ensure some semblance of integrity in the concept. We want to run this examination through as many companies as we can before the actual decline.
A word of warning, the fact that a stock reaches the extreme downside target does not necessarily mean that the stock or index is considered to be a “buy.” Nor does it suggest that the stock or index cannot fall further. Instead, it only reflects what potentially could happen on the downside. Additionally, SRLs do not suggest a time frame that a decline is expected to occur.
For the NLO team, speed resistance lines appeal to our sense of considering the worst case scenario, which has saved us a lot of money simply by avoiding situations that would create significant loss. Using history to assist us in projecting the downside risk is the primary reason we started examining speed resistance lines.
Posted in Clean Harbor, CLN, Diamond Foods, DMND, Edson Gould, Netflix, NFLX, speed resistance line
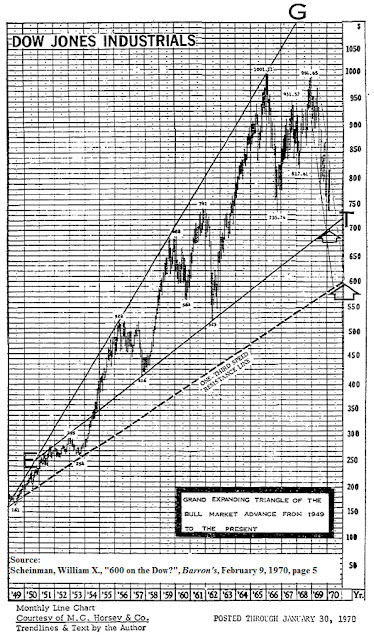
“Resistance lines decline or ascend at one-third or two-thirds the rates of actual declines and advances between significant bottoms and tops. Resistance to advance or decline is frequently encountered at such trendlines; however, if the resistance line is decisively penetrated, the price-action often tends to accelerate in the direction of the penetration.”

Comments Off on Netflix and Speed Resistance Lines
Posted in Edson Gould, Netflix, speed resistance line, William X. Scheinman, XAU