Category Archives: Clean Harbor

Clean Harbors: Coincidence Confirmed, Again

On February 9, 2012, we posted Edson Gould’s Speed Resistance Lines [SRL] regarding Clean Harbors (CLH).  Our hope at the time was that our prior work on the top of Gould’s work would be handily refuted or confirmed.  At the time we posed the following SRL:

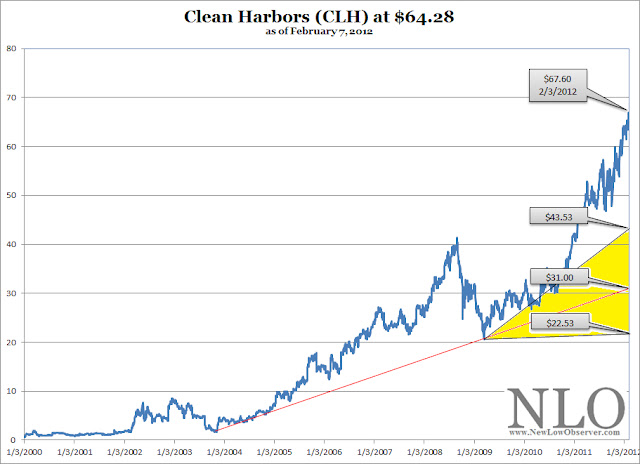
For us, our expectation was that the Clean Harbors would, at minimum, descend to the conservative downside target of $43.53.  Well, the timing and coincidence were in our favor as CLH fell –40% to the appointed levels that we thought the stock should descend.

As with all Speed Resistance Lines, there is a chance that the stock will continue to move higher.  However, at each point higher we readjust the SRL and arrive at new downside target.  In the case of CLH, the stock increased from the $67.60 price to as high as $70.30 thereby requiring an adjustment of the downside targets higher as well.  Remember, if the stock does not hit downside targets avoid it.  When and if the stock falls to the target, review for potential investment.

Finally, for no explicable reason, when all seemed in favor of the stock, CLH declined from the $70.30 peak to the low of $37.09 achieved in January 2016.  By achieving such an improbable low (improbable to those who were buying CLH in February 2012) CLH stock price appeared to be worth considering.  For this reason, we iterated a review of CLH for investment consideration on December 14, 2015. Since our mid-December 2015 review, CLH has increased by +39%.

image

At this point, we’d consider our general analysis of CLH a success from the December 2015 posting.  What do we see going forward?  We see two critical upside resistance levels to watch for.  The first upside resistance is at $59.00 and the second upside resistance level is at $69.00.  Obtaining a +39% gaining in a 1-year period might suggest that an investor consider selling all of their CLH holdings and reinvesting the funds somewhere else.

The Cold Hard Truth

Granted, luck and timing have a lot to say in any and all the work that we produce, however, that does not mean that our efforts on the topic should be dismissed as there may be some value in what we’re trying to accomplish.  Since the very first of our SRLs we’ve had more than 80% of the SRL downside targets achieved at the point of the initial examination.  This generally could could be considered a success.  However, of the 20% that have not been successful are positions that we’ve taken a real world investment in, which totally sucks.

In spite of the prevailing reality we continue to attempt to mitigate the available information with the stocks of interest to us.  We’ll narrow down this situation to a point where the SRL will work and/or we’ll still be able to benefit regardless of whether an immediate rebound is experienced.

Clean Harbors Meets Downside Target

On January 28, 2015 we said the following:

“So far, CLH has adhered to the SRL that was initially outlined in 2012.  If we consider the period of 2007 to 2009, when the stock fell as low as $20.54 and extend that same decline to the current period, then CLH could decline as low as $41.40.  This assumption is predicated on the stock market not experiencing a precipitous decline from the current level.  A broad market decline would easily bring CLH to the ascending $23.43 level in the SRL.”

image

The assessment was based on our February 2012 review of Clean Harbors when the stock was trading at $64.28.  Since Clean Harbors has reached our technical target, it is now time to assess the fundamentals through a source like Value Line Investment Survey and Morningstar.  Morningstar typically gives a bearish case on a stock so if Clean Harbors has full coverage it be helpful to carefully read the negative assessment to contrast the upside review.

Clean Harbors (CLH): Downside Targets

On February 9, 2012, when the stock was trading at $64.28, we reviewed the Speed Resistance Lines for Clean Harbors (CLH).  At that time we indicated the Clean Harbors had the following downside targets (found here):

  • $43.53
  • $31.00
  • $22.53

Currently, Clean Harbors (CLH) has declined to the $54.80 level which, in our view, happens to be a critical support level for shareholders of the stock.  As can be seen in the chart below, the price of CLH fell below the 200-day moving average (red line) on June 1, 2012.  Additionally, on three occasions the price of CLH attempted and failed to exceed the 200-day moving average (red line).

image

CLH is now bouncing along the support level of $55 (blue line).  It is not clear whether the stock is going to retest the 200-day moving average which presently sits at $61.94.  However, any additional decline in the stock price will likely lead to falling to $47.83.

Diamond Foods and Speed Resistance Lines

In retrospect, everything appears “oh so clear.”  We love history and attempt to interpret events from the past as a means to project into the future, assuming everything remains the same. Which is why the chart below seems so stunning to us.

The above chart of Diamond Foods (DMND), which has recently been blown out the water due to some accounting “irregularities” and the dismissal of the CEO and CFO, demonstrates the seeming power of Edson Gould’s speed resistance lines (SRL).  First, notice that the high of DMND was at$96.13, the starting point for all analysis of SRLs.  Based on the high of $96.13, the conservative downside target would have been the $48.47 level.  At the same time, the extreme downside target would have been the $21.00 level with an intermediate downside target of $32.04.

Amazingly, every downside target has been met with DMND reaching as low as $21.44 , on an intraday low.  By the way, little mention has been made of the accounting firm that signed off on Diamond Foods spurious books.

Already, in our prior work, we've seen a Netflix (NFLX) SRL, done in December 2010, give us an extreme downside target of $66.  Almost a year later, NFLX declined through the $66 level to fall to as low as $62.37 on November 30, 2011.  Another SRL that we ran before it came to fruition was Green Mountain Coffee Roasters(GMCR) on October25, 2011.  At the time, GMCR was trading at $64.75.  We estimated, using the SRL, that GMCR had an extreme downside target of $37.21.  The stock recently fell as low as $39.42 as reviewed in our February2, 2012 posting.

Below is the latest speed resistance lines for a stock that we've been curious about for some time, Clean Harbors (CLH).

Some could reasonably argue that we’re allowing correlation to equal causation, which we’d gladly confess to.  However, this explains why we a reactively seeking companies which we can run Edson Gould’s SRLs beforehand to ensure some semblance of integrity in the concept.  We want to run this examination through as many companies as we can before the actual decline.

A word of warning, the fact that a stock reaches the extreme downside target does not necessarily mean that the stock or index is considered to be a “buy.” Nor does it suggest that the stock or index cannot fall further.  Instead, it only reflects what potentially could happen on the downside.  Additionally, SRLs do not suggest a time frame that a decline is expected to occur.

For the NLO team, speed resistance lines appeal to our sense of considering the worst case scenario, which has saved us a lot of money simply by avoiding situations that would create significant loss.  Using history to assist us in projecting the downside risk is the primary reason we started examining speed resistance lines.

More about SRLs here