Category Archives: Uncategorized

In-Depth Analysis: W.W. Grainger

We came across W.W. Grainger (GWW) on  last week's U.S. Dividend watch list. At the time, Grainger traded down to its yearly low and on the surface appeared to be very intriguing. As such, we did some research and would like to share some findings. Continue reading

A Fundamental Case for Toy Maker, Mattel (MAT)

It hasn’t been fun and games for the leading toy maker, Mattel (MAT). Last week, the struggling company announced that the CEO, Bryan Stockton resigned. The preliminary result from the holiday season was dismal with profits falling -59% from a year earlier. The stock was one of the worst performing in S&P 500 over the last year. Shares fell -34% in 2014 and are already down as much as -14% in 2015. Continue reading

Analysis of Long-Term Return – Equity Market

Ask any market participate for their estimated long-term rate of return from equity market and majority of the time they will say 9%-10%.  That's a fact most of us know.  What market participants may not know is that the average is obtained through big volatility and market never return 10% year in and year out.  The nature of the market is to overshoot on the upside as well as the downside.

Let's take a look at the market return of the S&P 500 from the start of its inception in 1957 through 2013.  The average return for this time frame is 9% per year.  Interestingly, we rarely see returns in the range of 9% plus or minus 3% deviation.  Out of 64 years, we saw only 7 instances (11% of the time) when  the market registered a return between 6% to 12% (a 3% standard deviation).  We'd have to widen the range to 11.2% standard deviation to achieve a 50/50 split.  This mean that out of 64 years, the market had a gain/loss between -2% and 20% in 32 years.

Market 1950-2013

What does all of this mean?  Simply put, don't expect an average gain, of +10%, from the equity market in the short-term. As the chart shows, market return are nearly random with gains as high as 44% and losses as big as -38%.

U.S. Dividend Watch List: January 3, 2014

Below are the 23 companies on our U.S. Dividend Watch List that are on our radar. Stocks that appear on our watch lists are not recommendations to buy. Instead, they are the starting point for doing your research and determining the best company to buy. Ideally, a stock that is purchased from this list is done after a considerable decline in the price and rigorous due diligence.

Continue reading

Update: Sysco Corporation (SYY)

On September 26, 2013, we purchases a 19% position of Sysco Corporation (SYY).  Since that time, SYY has gone from near a 1-year low to a 1-year high all within three months.  Today it was announced that Sysco Corporation would merge with U.S. Foods.  The fair value target in our transaction alert on September 26, 2013 (found here) has been achieved but we expect that the stock will close below the fair value level on the day.  Dow Theory suggests that SYY should re-test the fair value level at least once more.

image

Our upside targets for SYY are substantial from a fundamental standpoint.  However, we’d rather draw your attention to an article that we posted about companies in the industry and how Warren Buffett is utilizing similar companies as a hedge on the coming inflation.  The article, titled “Warren Buffett Leverages Up on Inflation Hedge” (found here), outlines a longstanding thesis we have that if you believe inflation is coming then food processors, producers and distributors is the best way to take advantage of this trend going forward.  We recommend considering related stocks once they hit our watch list as SYY at current prices are not as compelling as when we purchased the stock.

Transaction Alert

Continue reading

Investment Observation: Bank of Montreal (BMO)

Today’s Investment Observation is Bank of Montreal (BMO).  According to Yahoo!Finance, Bank of Montreal “…provides various retail banking, wealth management, and investment banking products and services in North America and internationally.”

While there is considerable attention to the ability of Canadian banks to grow in spite of the travails of American banks, the premise of our interest in Bank of Montreal is only based on the fact that the company has a solid dividend history, near a new low and has an easily discernable Altimeter.

Bank of Montreal has a stellar dividend history which we believe the company has the ability to maintain.

image

Using Edson Gould’s Altimeter, as seen below, we find that BMO is bouncing along the lower end of the range which would suggest that the stock is approaching the undervalued range.

image

Whenever BMO trades above 99.24 on the Altimeter the stock should be considered for selling and anytime the stock declines below 73 it should be considered for acquisition.  Below is the track record for this indication since 1996:

Date Close Altimeter buy/sell %change
2/5/1996 12 72.73 buy 67.67%
3/10/1997 20.12 100.6 sell -15.81%
8/10/1999 16.94 72.09 buy 48.29%
12/8/2000 25.12 100.48 sell -14.21%
2/6/2002 21.55 71.83 buy 52.25%
8/26/2003 32.81 99.42 sell 61.20%
1/17/2008 52.89 72.65 buy 23.46%
4/26/2010 65.3 99.24 sell -17.53%
10/4/2011 53.85 72.87 buy ?????

In only one instance, August 26, 2003, when a sell indication was given, did the stock rise when it was expected to fall before another Altimeter buy indication was given.  The average gain after a buy indication was +47%.  This excludes any instance where the holder of the stock could have sold at much higher levels other than when the sell indication kicked in.

Dow Theory indicates that BMO has a fair value of $44.85.  This means that BMO is trading approximately 22.83% above fair value.  Our assessment of the Dow Theory fair value is based on the the trading high of 2010 and the trading low of 2009.  From the current price, BMO has the following Dow Theory downside targets:

  • $51.80
  • $37.90
  • $24.00

These downside targets are a broad overview of the potential downside risk, as each target is met we will be glad to provide intermediate and short-term downside targets.

According to Value Line Investment Survey, BMO is considered to be at fair value when the stock is trading 10.5 times earnings.  Using the most conservative figures available, full year 2011 reported earnings of $5.26, BMO would be trading at a fair value of $55.23.  From 1996 to 2011, Value Line indicates that BMO has increased the number of shares outstanding by only 23%.  This is significant because any bank that has managed to get through the banking crisis of 2006 to 2011 with such a “small” increase of shares is in a relatively stable condition.

We are reticent to recommend any kind of banking institution due to the many unexpected risks that occur outside of the purview of regulators and accountants.  However, Bank of Montreal is a reasonable banking investment if bought at the right price.  We believe that the right price begins at $51.80 and below.

Update on NUGT

On May 3, 2012 we posted a Transaction Alert indicating that we bought NUGT.

Although the transaction is currently at a breakeven level, we are revising our personal criteria for when to buy more and when to "consider" selling.  Our new criteria is as follows and is acceptable to only those who can accept 100% loss of capital invested:

We’re doing the transaction in two stages:

  1. 50% of the amount we wish to invest now (done)
  2. 50% of the amount we wish to invest after a decline of -20%
  3. we’re exiting the transaction after a total loss of -40% or greater
  4. we’re exiting the transaction when the next short-term signal buy DUST is indicated.

Those who have bought NUGT based on our initial purchase should re-read our more conservative entry and exit outline (found here), although the risks of loss are equally as high as our more aggressive strategy indicated above.

We bought NUGT based on the dual (short and long-term) indication from our Gold Stock Indicator as indicated in our April 4, 2012 article (found here).

Our preference for using Direxion Gold Miners Bull (NUGT) and Direxion Gold Miners Bear (DUST) ETFs are not for the risk averse.  DUST and NUGT are speculative vehicles and not investments meant to be held on a long-term basis.

U.S. Dividend Watch List: April 6, 2012

Watch List Summary

Tootsie Roll (TR) remains at the top of our list this week, making this the 8th weeks (since February 17th, 2012). Although we see potential in Tootsie Roll, the risk/reward we laid out in our March 16 list (found here) pushed us to pass on the name.

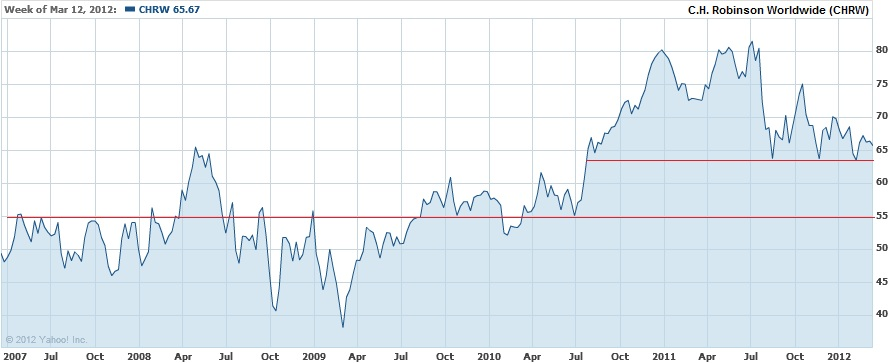
C.H. Robinson (CHRW) is second on the list for the fifth straight week. We believe this logistic company is forming a bottom with strong support at $63 (see chart). Trading now at $65 with estimated fair value of $75, you could say the risk/reward is attractive (-3% and +15% respectively). One word of caution is that, CHRW is a component of the Dow Jones Transport index which failed to test and exceed the July 2011 high, thus giving a bearish bias in the market trend.

CHRW_A

Making its way up the list is Matthews International (MATW) which operates in cemetery and funeral home.  MATW was last recommended by us on April 1, 2009 (found here) when the price was near the low at $28.52 (adjusted for dividends $27.79).  We later recommended selling MATW above a gain of 10% on August 3, 2009 (found here).

It sure doesn’t sound very excited but regardless of which direction the economy goes, there’re always need for the products of Matthews International. In fact, this company has been around since 1850, long before the "Great" Depression. The chart below indicates that the stock is showing signs of bottoming with great support at $29, in addition to stronger relative strength (RSI), as indicated by the blue line. More fundamental analysis to come on Matthews International.

MATW_A

Walgreen (WAG) continues to pop up on our list and in our view represents the best investment opportunity yet. Trading at its cheapest valuation ever, we believe shares could rise to the  mid-40s via multiple expansion as well as better than expected earnings. All of the bad news on the fallout from the breakup with Express Script (ESRX) has been priced in and on the day that the deal between Express Script and Medco (MHS) was completed, Walgreen rose +2%. To add icing on the cake, the technical pattern appears to be ripe and ready for WAG to move much higher. Great support at the $30 range will put your downside risk at 10% but a $45 would yield +36%.

Below are the 16 companies that meet our criteria and are within 11% of the 52-week low:

Symbol Name Price % Yr Low P/E EPS (ttm) Dividend Yield Payout Ratio
TR Tootsie Roll Industries Inc  22.33 0.95% 30.18 0.74 0.32 1.43% 43%
CHRW C.H. Robinson Worldwide, Inc.  65.12 4.53% 24.85 2.62 1.32 2.03% 50%
NFG National Fuel Gas Co. 47.12 5.86% 15.10 3.12 1.42 3.01% 46%
CWT California Water Service 17.94 7.75% 19.93 0.9 0.63 3.51% 70%
MATW Matthews International Corp.  30.89 8.12% 12.76 2.42 0.36 1.17% 15%
WAG Walgreen Co. 32.84 8.24% 11.21 2.93 0.90 2.74% 31%
UNS UniSource Energy Corporation 35.99 9.19% 13.09 2.75 1.72 4.78% 63%
ANAT American National Insurance 71.77 9.22% 9.97 7.2 3.08 4.29% 43%
CLX Clorox Co. 68.96 9.36% 16.82 4.1 2.40 3.48% 59%
ATO Atmos Energy Corp. 31.44 10.28% 14.23 2.21 1.38 4.39% 62%
WEYS Weyco Group, Inc.  22.98 10.37% 16.77 1.37 0.64 2.79% 47%
NJR New Jersey Resources Corp. 43.74 10.45% 13.54 3.23 1.52 3.48% 47%
PPL PP&L Corporation 27.63 10.52% 10.23 2.7 1.44 5.21% 53%
HNZ HJ Heinz Co. 53.26 10.57% 17.75 3 1.92 3.60% 64%
JNJ Johnson & Johnson  65.34 10.60% 18.72 3.49 2.28 3.49% 65%
AROW Arrow Financial Corp.  23.8 10.70% 12.73 1.87 1.00 4.20% 53%
16 Companies

Top Five Performance Review

In our ongoing review of the NLO Dividend Watch List, we have taken the top five stocks on our list from April 8, 2011 and have check their performance one year later. The top five companies on that list can be seen in the table below.

Symbol Name 2011 Price 2012 Price % change
TGT Target Corp. 49.53 57.72 16.54%
SJW SJW Corp. 22.94 24.32 6.02%
SYY Sysco Corp. 28.07 29.47 4.99%
HCBK Hudson City Bancorp, Inc. 9.87 7.11 -27.96%
WABC Westamerica BanCorp.  50.73 47.4 -6.56%
Average -1.40%
DJI Dow Jones Industrial 12,380.05 13,060.14 5.49%
SPX S&P 500 1,328.17 1,398.08 5.26%

4.8.2012

Our watch list underperformed the market but 6% mostly due to the weakness from the regional banking sector.  Only Target (TGT) and Sysco Foods (SYY) were able to meet our criteria of achieving a 10% gain within a 1-year period.

Nasdaq 100 Watch List: March 30, 2012

Below are the Nasdaq 100 companies that are within 20% of their respective 52-week lows. Stocks that appear on our watch lists are not recommendations to buy. Instead, they are the starting point for doing your research and determining the best company to buy. Ideally, a stock that is purchased from this list is done after a considerable decline in the price and rigorous due diligence.

Symbol Name Price P/E EPS Yield Price/Book Div/Share % Chg from Low
FSLR First Solar, Inc. 25.05 -0.46 0.6 2.24%
EA Electronic Arts Inc. 16.49 -0.52 2.42 2.71%
CTRP Ctrip.com International Ltd. 21.64 19.29 1.12 2.74 3.00%
APOL Apollo Group Inc. 38.64 8.41 4.6 4.34 4.21%
CHRW CH Robinson Worldwide Inc. 65.49 25 2.62 2.00% 8.48 1.32 5.12%
VOD Vodafone Group plc 27.67 12.75 2.17 3.40% 1.07 0.95 13.82%
SRCL Stericycle, Inc. 83.64 31.09 2.69 5.95 14.50%
ORCL Oracle Corporation 29.16 15.28 1.91 0.80% 3.4 0.24 17.96%
RIMM Research In Motion Limited 14.7 3.46 4.25 0.69 18.07%
GMCR Green Mountain Coffee Roasters Inc. 46.84 24.11 1.94 3.67 18.82%

Watch List Summary*

Update: December 16, 2011 Summary Stocks

Today we’re going to review the price action of the Nasdaq 100 stocks profiled in the summary section of our December 16, 2011 watch list.  First on the list was BMC Software (BMC), we indicated the following about BMC:

  • “If BMC were to replicate the percentage decline from the May 2008 top to the October 2008 low, the stock would decline to a price of $31.11.”
  • “The $40 level seems reasonable within the next year for BMC even though it is 20% above the current price.”

BMC declined from the December 16th price of $33.17 down to the low $31.62 on January 10, 2012.  The actual low of $31.62 was within 1.64% of the projected downside target.  Additionally, BMC managed to close above the $40 level starting on March 26, 2012.

Virgin Media (VMED) was the second stock listed in our summary section.  We projected an initial downside target of $18.29.  This never materialized as the stock reversed its decline at $20.52, we said the following regarding the VMED’s upside target:

  • “The next upside target for VMED is $25.07 which assumes the best case scenario.”

From December 19, 2011 to February 7, 2012 VMED rose as high as $24.49 but struggled to move any higher.  On February 8, 2012, VMED jumped to $25.27 and managed to close as high as $25.93 on February 14, 2012.  This was a gain of +23.77%  in a month and a half.

Ctrip.com (CTRP) was the last stock that we reviewed.  At the time, we said the following about CTRP:

  • “…on a pace to replicate the performance from the high in April 2008 to the low of January 2009 which equaled a loss of -72%. A similar decline in CTRP from the high of $50.57 would bring the price down to $14.16.”
  • “CTRP sits one penny below the 2nd Dow Theory support level of $23.11. Any further deviation below the current price almost ensures that the stock is destined for the $10 range.”

On March 28, 2012, CTRP declined significantly enough below the $22.44 level for us to believe that the stock would fall first to the $14.16 level and possibly to the $10 range.

*Stocks that are in our Watch List Summary section are those that we find the most compelling among all the stocks that appear in the watch list above.

Transaction Alert: AVP, ANAT and TR to be sold at the Market

Today we will be SELLING shares in the following holdings Avon (AVP), American National Insurance (ANAT) and Tootsie Roll (TR) at approximately 2:30pm EST.

  • Avon (AVP) has achieved our target goal of +10% since we bought the stock in November 2011
  • American National Insurance (ANAT) has only gained +1.72% since our September 2011 acquisition
  • Tootsie Roll (TR) has declined by –5% since our January 2012 purchase.

We’re offsetting the gains from Avon (AVP) and American National Insurance (ANAT) with the losses of Tootsie Roll (TR).  It should be noted that the losses of Tootsie Roll are significantly larger than the gains from AVP and ANAT.  However, acknowledging our losses and taking reasonable action in a timely manner is a must.  Additionally, we are taking the opportunity to exit out of undesirable investments and building cash holdings as we recommended in our October 15, 2011 posting.

Nasdaq 100 Watch List: March 23, 2012

Below are the Nasdaq 100 companies that are within 20% of their respective 52-week lows. This Nasdaq 100 Watch List is strictly for the purpose of researching whether or not the companies have viable business models or are about to go out of business. These companies are deemed highly speculative unless otherwise noted.

Symbol
Company Price P/E EPS Yield P/B % from Low
FSLR First Solar, Inc. $26.11 0 -0.46 0 0.64 3.24%
CHRW C.H. Robinson Worldwide $64.42 24.59 2.62 2 8.44 3.40%
CTRP Ctrip.com Int'l $22.83 20.37 1.12 0 2.93 3.68%
EA Electronic Arts Inc. $16.86 0 -0.52 0 2.49 5.05%
RIMM Research In Motion $13.66 3.22 4.25 0 0.7 9.72%
VOD Vodafone Group Plc $27.65 12.74 2.17 3.4% 1.07 13.74%
APOL Apollo Group, Inc. $42.41 12.02 3.53 0 4.1 14.37%
ORCL Oracle Corporation $28.55 14.96 1.91 0.8% 3.31 15.49%
SRCL Stericycle, Inc. $84.66 31.47 2.69 0 6.04 15.89%
AMZN Amazon.com, Inc. $195.04 142.36 1.37 0 11.29 16.81%
VMED Virgin Media Inc. $23.98 63.95 0.38 0.7% 6.82 16.86%

Watch List Summary

Because we’re still in a bear market and have had significant divergence between the Dow Industrials and the Dow Transports index, we believe there could be significant downside action in the near term.  With this in mind,  our first stock of interest is Oracle Corporation (ORCL). While the stock is slightly more than 15% above the 1-year low, it is necessary to plan your next purchase of this stock.

image

When viewed from a Dow Theory perspective, the following are the downside targets from the current price:

  • $25.48 (fair value)
  • $21.82
  • $14.48

The low of December 2011 is the exact level of ORCL’s fair value based on Dow Theory.  If Oracle were to fall below the December 2011 low the next downside target is $21.82.  We wouldn’t put it past Oracle to decline to $14.48, however, a 3-part purchase plan with the first at $25.28 would be reasonable.  If you have $10,000 to invest in ORCL then we’d arrange the purchased in the following order:

  • 1st-$5,000 at $25.48
  • 2nd-$3,500 at $21.82
  • 3rd-$1,500 at $14.48

The next stock that we’re considering is Stericycle (SRCL).  Stericycle first appeared on our October 17, 2009 Nasdaq 100 Watch List.  At the time, Stericycle was trading at $52.12.  Since then, SRCL has soared as high as $95.71 on an intra-day basis, a gain of 83.63%.  Don’t be fooled by the fact the Stericycle sports a “high” price relative to the $52 level.  The point of a stock approaching a new low is that it transmits new information on the relative value.

image

According to Dow Theory, Stericycle has the following downside targets:

  • $79.39
  • $71.23 (fair value)
  • $63.07
  • $46.75

We’d structure the purchase of Stericycle (SRCL) into two steps.  The first purchase at $71.23 (or lower) with 75% of the intended amount and the second purchase at $63.07 (or lower) with the remaining funds.

U.S. Dividend Watch List: March 23, 2012

U.S. stocks sold off this week amid weaker-than-estimated housing data. On the upside, jobless claims dropped to its lowest level in several years. The S&P lost 0.5% while the Dow dropped -1.14%. A dividend hike from HP (HPQ) didn't protect the blue-chip stock from losses.

Our watch list expanded slightly and has 10 companies that are within 11% of the 52-week low. A reminder to our readers, these are companies with a long track records of dividend payments.

Symbol Name Price % Yr Low P/E EPS Dividend Yield Payout
TR Tootsie Roll  22.75 2.85% 30.74 0.74 0.32 1.41% 43%
CHRW C.H. Robinson Worldwide 64.42 3.40% 24.59 2.62 1.32 2.05% 50%
CLX Clorox Co. 67.99 7.82% 16.58 4.1 2.40 3.53% 59%
ATO Atmos Energy Corp. 30.8 8.03% 13.94 2.21 1.38 4.48% 62%
CWT California Water Service 18.23 9.49% 20.26 0.9 0.63 3.46% 70%
HNZ HJ Heinz Co. 52.77 9.55% 17.59 3 1.92 3.64% 64%
BDX Becton, Dickinson and Co. 76.4 9.79% 13.94 5.48 1.80 2.36% 33%
JNJ Johnson & Johnson  64.55 9.54% 18.50 3.49 2.28 3.53% 65%
WAG Walgreen Co. 33.56 10.61% 11.34 2.96 0.90 2.68% 30%
UNS UniSource Energy 36.47 10.65% 13.26 2.75 1.72 4.72% 63%
10 Companies

Watch List Summary

New additions to our list this week is HJ Heinz (HNZ), Johnson & Johnson (JNJ), Beckton Dickinson (BDX), and UniSource Energy (UNS). We’d like to highlight Johnson & Johnson which is actually closer to the high than the low but the historical dividend yield suggests it is undervalue at 3.5% yield. In addition, according to the Value Line Investment Survey JNJ should trade at 12x cash flow which  would suggest a fair value of $72. If that isn’t enough, current dividend yield is higher than 30-year T-bill.

C.H. Robinson (CHRW), one of the largest 3rd party logistic companies, remains second on our list this week. Valueline estimates that CHRW trades at a fair value of 22x cash flow which suggests that the stock should be trading for $75. In our recent review of the stock market, we are cautious because the Dow Jones Transportation Index has failed to test and exceed its July 2011 high.  This could impair the ability of transportation companies like CHRW to move higher in the short-term.

Top Five Performance Review

In our ongoing review of the NLO Dividend Watch List, we have taken the top five stocks on our list from March 25, 2011 and have check their performance one year later. The top five companies on that list can be seen in the table below.

Symbol Name 2011 Price 2012 Price % change
SJW SJW Corp. 22.65 24.55 8.39%
SYY Sysco Corp. 27.86 29.84 7.11%
WABC Westamerica BanCorp.  50.13 47.85 -4.55%
PPL PP&L Corporation 24.57 27.67 12.62%
TGT Target Corp. 49.95 58.19 16.50%
Average 8.01%
DJI Dow Jones Industrial 12,220.59 13,080.73 7.04%
SPX S&P 500 1,313.80 1,397.11 6.34%

2012_3_24

Companies on our watch list outperformed the market by 1-2 percentage points. In addition, two of the 5 achieved 10% within the first two months (SYY and PPL). At the same time, SJW and TGT achieved 10% gains within seven months of appearing on our list.

The biggest gainer was Target (TGT), one of the largest retailer in the nation. The biggest loser was WestAmerica (WABC) falling -4.55%. WABC's performance, however, wasn’t terrible when you compared it to the Citigroup (C), the financial sector ETF (XLF), and Bank of America (BAC) which lost -18.19%, -4.90%, and -26.92%, respectively. In addition, WABC raised their dividend 2.8% around October 2011.

Richard Russell’s Latest Miscue

The New Low team has been huge fans of Richard Russell for years. We've learn much about Russell's thinking process as well as his stock market strategy in his work from 1958 to the present. However, his most recent contribution appears to be counter to the whole point of Dow Theory. The following excerpt appears on Financial Sense as well as Dow Theory Letters.

What's the best performing stock of the last few years? Would you believe it -- it's a leading seller of bolts, screws and nuts. (Their products are known as threaded fasteners in the trade.) The name of the hot company is Fastenal.

The stock has been trading for 25 years. The stock has as gone from 13 cents on October 19, 1987 to a recent $50.85. Over the past year Fastenal has gained 60%.

The company stocks thousands of varieties of bolts, nuts, screws and cotter pins in 2,600 stores and serves retail and wholesale customers. For many companies, Fastenal's products are absolutely essential. Whole factories can shut down for lack of one of Fastenal's specially threaded bolts. Fastenal has no serious competition. It would be too difficult to compete with Fastenal's thousands of products for spot delivery. In other words, while Fastenal's products are mundane, many companies can't live without them. If maybe five of a certain bolt is needed, price is absolutely no object. The particular bolt may cost a dollar a piece, but if Fastenal can supply the bolt immediately, the price doesn't mean a thing.

Fastenal had 45 stores in 1987, which was the year its owner decided to take Fastenal public. The company offered 100,000 of the million shares to its employees. Up to date, the price of Fastenal has risen 38,565% and today the company has a market value of $15 billion. It has stores in all 50 states and has also moved into Mexico, Canada, Asia and Europe.

Lesson -- Deal in products that everyone needs. Supply those products in varieties that are beyond the capabilities of any other purveyor. Then offer your products for immediate delivery.

Followers of Dow Theory should know that investment values is the cornerstone of the theory.  This means that even if you don't know anything stock market technicals, buying stocks that are undervalued should be the primary focus.

Unfortunately, it seems that Mr. Russell will revert to the values of Dow Theory when it fits his "mood."  Russell suggests that the market is overvalued based on the dividend yield on the Dow Jones Industrial Average being below 3%.  Why then would he write about Fastenal (FAST) which is at an all-time high and trading at P/E of 43 with a book value of 4.94x?  Additionally, Value Line Investment Survey has estimated that FAST has a fair value at 22x cash flow. Given their 2012 estimate of $1.65 of cash flow per share, we can conservatively say this company is worth $36.

For the sake of reference, we've highlighted Fastenal (FAST) in an April 24, 2010 article titled "Low Yielding Stocks Offer Exceptional Gains".  At the heart of our article was to demonstrate that many stocks with low dividend yields can perform equally as well, if not better, than stocks with high dividend yields given the right conditions (i.e. payout ratio, historical yield range).

Sure this stock could turn out to be the next "Apple" but as an influential Dow Theorist, Russell shouldn't be preaching the merits of a company that is as over-valued as FAST.

Also, we'd like to critique Richard Russell's "lesson." The lesson rings hollow since it suggests investment in "wide moat" companies but doesn't offer up any reasonable alternatives.  This implies that investors acquire shares of FAST at the current price solely based on their "moat" while overlooking the fact that the company is not undervalued.  This is quite alarming since there is a broad range of companies which appears on our latest watch list.

Reference Sources:
What’s the Best Performing Stock of the Last Few Years?
Fastenal Key Statistic as of 3/20/2012
Low Yielding Stocks Offer Exceptional Gains
Dividend Watch List: March 16, 2012

Nasdaq 100 Watch List: March 16, 2012

Below are the Nasdaq 100 companies that are within 20% of their respective 52-week lows. This Nasdaq 100 Watch List is strictly for the purpose of researching whether or not the companies have viable business models or are about to go out of business. These companies are deemed highly speculative unless otherwise noted.

Symbol Name Price P/E EPS Yield Price/Book payout % from Low
CHRW C.H. Robinson Worldwide 65.67 25.06 2.62 2.00 8.55 50.38% 5.41%
VOD Vodafone Group Plc 26.41 12.28 2.15 3.60 1.02 44.19% 8.64%
EA Electronic Arts Inc. 17.46 0 -0.52 0.00 2.45 0.00% 8.79%
CTRP Ctrip.com Int'l 24.68 22.09 1.12 0.00 3.03 0.00% 12.08%
APOL Apollo Group 42.59 12.08 3.53 0.00 4.07 0.00% 14.86%
FSLR First Solar 29.08 0 -0.46 0.00 0.66 0.00% 14.99%
AMZN Amazon.com 185.05 135.07 1.37 0.00 10.82 0.00% 15.07%
RIMM Research In Motion 14.38 3.39 4.25 0.00 0.68 0.00% 15.50%
VMED Virgin Media Inc. 24.18 65.18 0.37 0.70 7 43.24% 17.84%
SRCL Stericycle, Inc. 86.88 32.3 2.69 0.00 6.11 0.00% 18.93%
DTV DIRECTV 47.47 13.68 3.47 0.00 -10.53 0.00% 19.21%
EXPD Expeditors Int'l of Wash 45.81 25.59 1.79 1.10 4.71 27.93% 19.76%

Watch List Summary

A company that we’re considering buying is C.H. Robinson Worldwide (CHRW), the first company on our list.  The primary consideration that we have is always the downside risk.  We almost ignore the upside targets and projections in order to come up with an idea on the best ways to avoid loss.

The following are two perspectives on the way to view the potential downside risk of buying CHRW. First, according to Dow Theory, CHRW has three significant downside targets that should be considered carefully. The three downside targets are as follows:

  • $60.34 (fair value)
  • $52.91
  • $38.06

The way we approach the Dow Theory downside targets is to buy CHRW if it falls to $60.34 (fair value according to Dow Theory). However, we prepare ourselves for the worst case scenario by expecting that CHRW will decline to the $38.06 level, the low for 2009. With this assumption, we ensure that our initial purchase does not include 100% of what we'd normally invest. Instead, we only invest 30%, 50% or 65% of the amount that we'd ordinarily invest. The remainder of funds is set aside for the possibility that the stock declines. Naturally the greater the amount invested initially, the greater the loss or gain if the stock declines or rises.

The second way to view CHRW's downside risk is strictly from the "technical" patterns based on a chart from the last 5 years.

3-16-2012

From a "technical" standpoint, there are significant support levels at $63.50, $55 and $38. These technical levels are not very different from Dow Theory even though the technical levels based on the chart above are strictly based on the visual cues. We specifically chose the last 5 years because Charles H. Dow has said that best way to gauge a company's future prospects is usually through careful consideration of the period when earnings, book value, price and other fundamental attributes are at their worst. For us, the inclusion of 2007 to 2009 is the best reflection of the worst that has been experienced recently.  With either approach to reviewing the downside risk of a stock, the purpose is ensure that you do not get caught off guard at the prospect of a major price decline.

Watch List Performance Review

In our ongoing review of the Nasdaq 100 Watch List, we have taken the topic 5 stocks from our March 6, 2011 Nasdaq 100 Watch List.   The top 5 companies from the watch list are provided below with the closing price from March 7, 2011 to March 6, 2012.

Symbol Company 2011 2012 % Change
CSCO Cisco Systems, Inc. $18.40 $20.03 8.86%
CEPH Cephalon, Inc. $56.17 $81.49 45.08%
AMGN Amgen Inc. $52.32 $67.38 28.78%
TEVA Teva Pharmaceutical Industries  $50.32 $43.08 -14.39%
ATVI Activision Blizzard, Inc $11.27 $12.65 12.24%
Average 16.12%
NDX Nasdaq 100 $2,328.07 $2,712.78 16.52%

3-6-2011 Top 5

Our primary goal at the New Low Observer is to achieve 10% gains within the span of a year inside of our tax deferred accounts.  In the case of AMGN, CEPH and ATVI our goal of 10% within a year was accomplished within the first four months.  CSCO was the last 10% gain that arrived at the end of the 1-year period.  Teva Pharmaceutical (TEVA) severely underperformed for the remainder of the 1-year period.  CEPH did not last very long since it was acquired by none other than Teva Pharmaceutical.  Cephalon was acquired by TEVA within two months of being on our watch list.

Our specific recommendation of Cephalon at $58.99 on February 15, 2011 and the subsequent acquisition explains why we’re drawn to companies at a new low.