Category Archives: Uncategorized

Nasdaq 100 Watch List: March 16, 2012

Below are the Nasdaq 100 companies that are within 20% of their respective 52-week lows. This Nasdaq 100 Watch List is strictly for the purpose of researching whether or not the companies have viable business models or are about to go out of business. These companies are deemed highly speculative unless otherwise noted.

Symbol Name Price P/E EPS Yield Price/Book payout % from Low
CHRW C.H. Robinson Worldwide 65.67 25.06 2.62 2.00 8.55 50.38% 5.41%
VOD Vodafone Group Plc 26.41 12.28 2.15 3.60 1.02 44.19% 8.64%
EA Electronic Arts Inc. 17.46 0 -0.52 0.00 2.45 0.00% 8.79%
CTRP Ctrip.com Int'l 24.68 22.09 1.12 0.00 3.03 0.00% 12.08%
APOL Apollo Group 42.59 12.08 3.53 0.00 4.07 0.00% 14.86%
FSLR First Solar 29.08 0 -0.46 0.00 0.66 0.00% 14.99%
AMZN Amazon.com 185.05 135.07 1.37 0.00 10.82 0.00% 15.07%
RIMM Research In Motion 14.38 3.39 4.25 0.00 0.68 0.00% 15.50%
VMED Virgin Media Inc. 24.18 65.18 0.37 0.70 7 43.24% 17.84%
SRCL Stericycle, Inc. 86.88 32.3 2.69 0.00 6.11 0.00% 18.93%
DTV DIRECTV 47.47 13.68 3.47 0.00 -10.53 0.00% 19.21%
EXPD Expeditors Int'l of Wash 45.81 25.59 1.79 1.10 4.71 27.93% 19.76%

Watch List Summary

A company that we’re considering buying is C.H. Robinson Worldwide (CHRW), the first company on our list.  The primary consideration that we have is always the downside risk.  We almost ignore the upside targets and projections in order to come up with an idea on the best ways to avoid loss.

The following are two perspectives on the way to view the potential downside risk of buying CHRW. First, according to Dow Theory, CHRW has three significant downside targets that should be considered carefully. The three downside targets are as follows:

  • $60.34 (fair value)
  • $52.91
  • $38.06

The way we approach the Dow Theory downside targets is to buy CHRW if it falls to $60.34 (fair value according to Dow Theory). However, we prepare ourselves for the worst case scenario by expecting that CHRW will decline to the $38.06 level, the low for 2009. With this assumption, we ensure that our initial purchase does not include 100% of what we'd normally invest. Instead, we only invest 30%, 50% or 65% of the amount that we'd ordinarily invest. The remainder of funds is set aside for the possibility that the stock declines. Naturally the greater the amount invested initially, the greater the loss or gain if the stock declines or rises.

The second way to view CHRW's downside risk is strictly from the "technical" patterns based on a chart from the last 5 years.
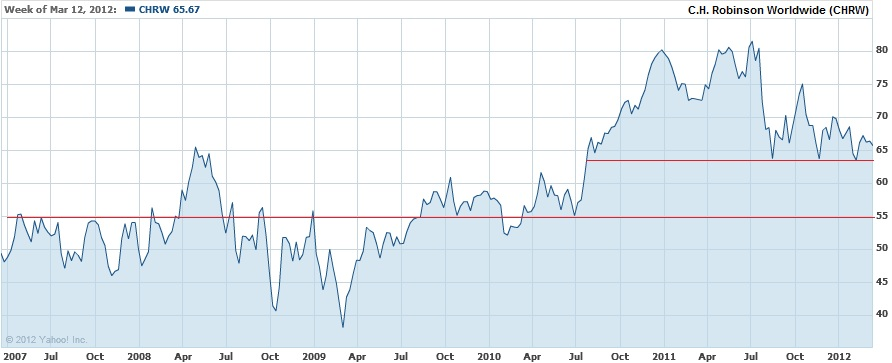
3-16-2012

From a "technical" standpoint, there are significant support levels at $63.50, $55 and $38. These technical levels are not very different from Dow Theory even though the technical levels based on the chart above are strictly based on the visual cues. We specifically chose the last 5 years because Charles H. Dow has said that best way to gauge a company's future prospects is usually through careful consideration of the period when earnings, book value, price and other fundamental attributes are at their worst. For us, the inclusion of 2007 to 2009 is the best reflection of the worst that has been experienced recently.  With either approach to reviewing the downside risk of a stock, the purpose is ensure that you do not get caught off guard at the prospect of a major price decline.

Watch List Performance Review

In our ongoing review of the Nasdaq 100 Watch List, we have taken the topic 5 stocks from our March 6, 2011 Nasdaq 100 Watch List.   The top 5 companies from the watch list are provided below with the closing price from March 7, 2011 to March 6, 2012.

Symbol Company 2011 2012 % Change
CSCO Cisco Systems, Inc. $18.40 $20.03 8.86%
CEPH Cephalon, Inc. $56.17 $81.49 45.08%
AMGN Amgen Inc. $52.32 $67.38 28.78%
TEVA Teva Pharmaceutical Industries  $50.32 $43.08 -14.39%
ATVI Activision Blizzard, Inc $11.27 $12.65 12.24%
Average 16.12%
NDX Nasdaq 100 $2,328.07 $2,712.78 16.52%

3-6-2011 Top 5

Our primary goal at the New Low Observer is to achieve 10% gains within the span of a year inside of our tax deferred accounts.  In the case of AMGN, CEPH and ATVI our goal of 10% within a year was accomplished within the first four months.  CSCO was the last 10% gain that arrived at the end of the 1-year period.  Teva Pharmaceutical (TEVA) severely underperformed for the remainder of the 1-year period.  CEPH did not last very long since it was acquired by none other than Teva Pharmaceutical.  Cephalon was acquired by TEVA within two months of being on our watch list.

Our specific recommendation of Cephalon at $58.99 on February 15, 2011 and the subsequent acquisition explains why we’re drawn to companies at a new low.

Broader Market and Dow Theory Suggest Proceeding with Caution

As the Dow Jones Industrial Average and S&P 500 exceed the highs set in 2011, there is an alarming coincidence with 1972, just before the Dow Industrial’s -44% decline, that we’d like to bring to your attention.  To set the stage, we must first point out an important factor about the Dow Industrials and S&P 500 that contributes to their ability to reach new highs.

First, the Dow Jones Industrial Average is what is considered to be a price-weighted index.  According to Investopdia.com, a price weighted-index is:

“A stock index in which each stock influences the index in proportion to its price per share. The value of the index is generated by adding the prices of each of the stocks in the index and dividing them by the total number of stocks. Stocks with a higher price will be given more weight and, therefore, will have a greater influence over the performance of the index.” (read more here)

Next is the S&P 500.  The S&P 500 is a capitalization-weighted index.  Again, referring back to Investopedia.com, a market-cap weighted index is:

“A type of market index whose individual components are weighted according to their market capitalization, so that larger components carry a larger percentage weighting. The value of a capitalization-weighted index can be computed by adding up the collective market capitalizations of its members and dividing it by the number of securities in the index.” (read more here)

Each of these indexes are biased in the way they reflect the overall market movement.  In the case of the Dow Jones Industrial Average, it is biased towards the highest priced members while the S&P 500 is tilted to the stocks that are similarly expensive, on a market-cap basis.  In order to get a true sense of how all of the stocks are faring, rather than a select few that have been favored by investors, it is best to track a broadly based “equal-weighted” stock index.  According to Investopedia.com, an equal-weighted stock index  is:

“A type of weighting that gives the same weight, or importance, to each stock in a portfolio or index fund. The smallest companies are given equal weight to the largest companies in an equal-weight index fund or portfolio. This allows all of the companies to be considered on an even playing field.” (read more here)

For the most part, an equal-weighted index reflects how all stocks have fared in a bull or bear market.  This is important because it allows for greater insight into where we are and potentially where we might be going.  One equal weighted index of over 1,700 companies that has been around since 1962 is the Value Line Geometric Index (found here).  In the chart below, we have compared the market action of the Value Line Geometric Index over a ten year period from 1962-1972 and 2002-2012.

Value Line Geometric

What should stand out the most between both charts is the fact that, according to the Value Line Geometric Index, while the general indexes like the S&P 500 and Dow Jones Industrial Average are making new highs, the majority of stocks have not participated in the rise.  In addition to not exceeding the peaks of 1968-1969 and 2007, the inability to exceed the 2011 highs is an indication of significant resistance as was experienced in 1971 and 1972 peaks.

Adding to our concern about the lack of participation by the broader stock market is the divergence between the Dow Jones Transportation Average and the Dow Jones Industrial Average since February 2012 (found here).  This divergence can also be found in the chart below in the period from April 6, 1972 to January 5, 1973 between the Transports and Industrials.  The declines that followed the divergence and peak of ‘72-‘73 were -59% and –44% for the Transports and Industrials, respectively.

DT '72

Until the Dow Theory divergence is resolved and the Value Line Geometric Index make new highs above the 2011 and 2007 peaks, we’re concerned that the stock market is skating on thin ice.

Dow Theory Update

It appears that Dow Theory is not understood, by even the best in the industry.  In an article titled “The Meaning of the Transports’ Weakness,” Mark Hulbert surveyed some of the industry’s best Dow Theorists for a clue as to what the market was expected to do next. What stands out in this article is the following remark:

“Frustratingly, not all Dow Theorists agree on an answer. In fact, two of the three monitored by the Hulbert Financial Digest — Jack Schannep of TheDowtheory.com and Richard Moroney of Dow Theory Forecasts — think the appropriate point of comparison is not last summer but late October. And because, near the end of December, the Dow averages rose above their late-October highs, both Schannep and Moroney believe that the Dow Theory is solidly in the bullish camp — notwithstanding where the Dow transports might be relative to their July high.”

Within this commentary is a revealing explanation as to the reason why we believe that Schannep and Moroney got it wrong, thereby issuing a bear market indication in August 2011 and a bull market indication in late December 2011.  In order to understand this, we must first point out a diagram of how Dow Theory reversals typically occur.

Plotting of Primary Reversal

Courtesy of Richard Russell’s Dow Theory Letters (www.dowtheoryletters.com), Figure 1a and Figure 1b show how the Industrials and Transports need to retest prior lows established at point A.  This retesting of the prior low would come after a medium-term rise at point B.  Once the market rests the prior low, the market would then need to exceed the medium-term high of point B.

With the diagram above, we can now see how Schannep and Moroney could have considered that a new bull market was in the making.  Once the market exceeded what they believed to be the POINT B in figure 1a and 1b, it then appeared to be a new bull market.  Unfortunately, while the Dow Industrials appeared to follow the script in Figure 1a, the Transports were far behind in providing a similar pattern of retesting the previous low.  This error led to an incorrect assessment of a new bull market.

Interestingly, Schannep and Moroney were inaccurate even in their call of a “bull market” using Dow Theory.  Based on the diagrams of figure 1, a new bull market should have been indicated in early October instead of late December.  In the chart below, it should be noted that the false bull market indication in October had much more to gain than the late December indication.  Worse still, only a month later, in February 2012, the Dow Transportation Average starts to diverge from the path of the Dow Jones Industrial Average.

2012 03 06 Dow Theory

The current divergence between the Industrials and Transports is a confirmation of the bear market trend.  Additionally, we expected that the Industrials and Transports are going to re-test the lows of 2011.  However, our suspicion is that both the Transports and Industrials will sink below the 2011 lows and possibly go strait to the 9,700 level on the Industrials.  The prospect remains that the bear market could potentially end if the Transports retest the lows of 2011 without falling significantly below.

As early as October 15, 2011 (article here), we indicated that the “…coming market volatility will provide great opportunities for traders and allow investors a chance to cash out of otherwise undesirable positions and take profits. Our expectation is that the Dow will go to the July 2011 highs before struggling at the May 2011 highs. Again, we’re still in a cyclical bear market until the Transports and Industrials exceed their respective 2011 highs.

We hope that our readers have benefitted from our advice to unload undesirable positions.

Best regards.

NLO Dividend Watch List: March 16, 2012

The $3 Billion Greek deal may have pushed some bulls back into the market. It was a volatile week but the market finished unchanged. The S&P was virtually flat but the blue chip lost 55 points for the week. There are some bargains to be had in our watch list this week which contains 11 companies that are within 11% of the 52-week low. A reminder to our readers, these are companies with a long track records of dividend payments.

Symbol Name Price % Yr Low P/E EPS (ttm) Dividend Yield Payout Ratio
TR Tootsie Roll Industries Inc  22.9 2.31% 30.95 0.74 0.32 1.40% 43%
CHRW C.H. Robinson Worldwide, Inc.  65.67 6.50% 25.06 2.62 1.32 2.01% 50%
ATO Atmos Energy Corp. 30.71 7.69% 13.90 2.21 1.38 4.49% 62%
CLX Clorox Co. 68.21 7.95% 16.64 4.1 2.40 3.52% 59%
CWT California Water Service 18.22 8.80% 20.24 0.9 0.63 3.46% 70%
UNS UniSource Energy Corporation 36.32 9.05% 13.21 2.75 1.72 4.74% 63%
PEP PepsiCo Inc. 64.47 10.27% 16.00 4.03 2.06 3.20% 51%
CAH Cardinal Health, Inc.  41.59 10.35% 15.40 2.7 0.86 2.07% 32%
8 Companies

Watch List Summary

Topping our list this week is Tootsie Roll (TR). Based on the work we’ve done on this stock, we are becoming less convinced of the upside based on historical valuation. Using dividend yield theory, we see very limited upside. Our estimate is that TR's fair value is at $24. There are several factors that we are increasingly concern about regarding. One is the declining profit margin which has been shrinking since 2001 as our chart shown below. Second is the stagnant trend in dividend payments since 2009 (please note that they reward shareholders with 3% special dividend in the form of stock.) As for a cash payout, they have been returning 35% of their earning to investors. Alternatively, the board opts for a share buyback and which reduced the shares outstanding from 66 million shares to 55 million shares. This strategy helped offset the dilution from the 3% stock issuance. We have never a fan of share repurchase, though a recent letter from Warren Buffett stated the benefits of share repurchases.

image

Readers may have noticed that the largest part of our portfolio is in Tootsie Roll (TR). The rational for such action is that we are utilizing this stock as a cash holding. Our observation is that stocks that appear and continue to show up on our watch list have a good probability of being near the bottom rather than the top of their respective price range. As such, we believe the downside is limited but the upside may be equally as limited for the reasons stated above. Our action may reverse if conditions in the stock price change signficantly. For now we continue to view Tootsie Roll (TR) as a cash holding.

C.H. Robinson (CHRW), one of the largest 3rd party logistic companies, is second on our list this week. The stock has been hammered because of the recent rise in the oil prices and we believe this could be a great opportunity to start your research if you have always wanted to own a cyclical stock. Valueline estimates that CHRW trades at a fair value of 22x cash flow which suggests that the stock should be trading for $75. If you’ve read our recent review of the stock market, you will know that we are cautious because the Dow Jones Transportation Index has failed to test and exceed its July 2011 high.

If cyclical stock aren’t your cup of tea, there are three that fit the undervalued mark based on a dividend yield thesis. These companies are Clorox (CLX), PepsiCo (PEP), and Cardinal Health (CAH). The first two are great household names that are considered defensive according to Wall Street. Cardinal Health (CAH) manufactures and distributes generic drugs. On average, if these shares revert to their historical dividend yield, CAH should return somewhere between 10% to 15% in the coming year.

Top Five Performance Review

In our ongoing review of the NLO Dividend Watch List, we have taken the top five stocks on our list from March 18, 2011 (not published) and have check their performance one year later. The top five companies on that list can be seen in the table below.

Symbol Name 2011 Price 2012 Price % change
HGIC Harleysville Group Inc.  30.56 57.54 88.29%
SJW SJW Corp. 22.48 24.22 7.74%
MCY Mercury General Corp. 37.84 43.95 16.15%
SYY Sysco Corp. 27.7 29.63 6.97%
JNJ Johnson & Johnson  58.57 65.12 11.18%
Average 26.06%
DJI Dow Jones Industrial 11,858.52 13,232.62 11.59%
SPX S&P 500 1,279.21 1,404.17 9.77%

Companies on our watch list outperformed the market by a wide margin. The biggest driver was Harleysville (HGIC) which received a buyout bid from Nationwide Mutual Insurance.  However, when you exclude the gains of HGIC, our top five retained a respectable +10.51% gain.

Insurance Watch List: January 27, 2012

The following is one of our personal favorite watch lists.  We started tracking the insurance industry in January 2011 and we're very impressed with the results so far. 
Anyone who wishes to be successful in insurance stocks should read the book The Davis Dynasty by John Rothchild.  The book starts with Shelby Collum Davis investing approximately $50,000 to $100,000 that ultimately grew to $900 million after 47 years.  The strategies employed by Davis seem more accessible to average investors as opposed to Warren Buffett's leveraged strategies and education from Benjamin Graham.


NamePriceP/EEPSYieldP/Bpayout ratio% from Low
Alleghany Corp.288.0518.0715.9400.880.00%3.98%
National Western Life Insurance143.27.2819.660.30%0.41.83%10.15%
American National Insurance72.6411.296.444.20%0.5347.83%10.55%
Tower Group, Inc.21.9110.82.033.40%0.8536.95%10.77%
HCC Insurance Holdings, Inc.27.9411.562.422.20%0.9325.62%13.30%
Loews Corp.37.6312.253.070.70%0.798.14%14.38%
XL Group plc20.328.190.722.20%0.6761.11%14.75%
Kansas City Life Insurance32.3613.62.383.30%0.5145.38%15.53%
Sun Life Financial20.1413.631.486.90%0.8293.24%15.75%
Everest Re Group85.1525.563.332.30%0.7657.66%16.09%
Unum Group22.928.012.861.80%0.7114.69%16.23%
Endurance Specialty Holdings37.0870.760.523.20%0.58230.77%17.08%
Willis Group Holdings38.7324.421.592.70%2.5165.41%17.22%
Hanover Insurance Group36.6935.871.023.30%0.67117.65%18.35%

Symbol
Y NWLI ANAT TWGP HCC L XL KCLI SLF RE UNM ENH WSH THG
Watch List Summary
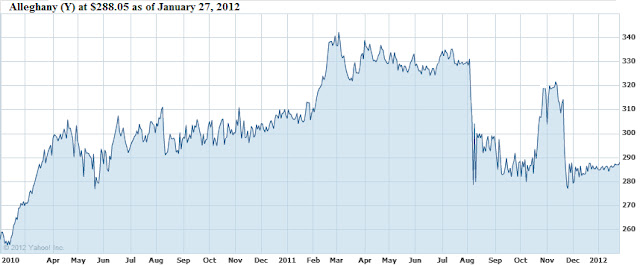
Alleghany Corp. (Y) appears to be an exceptional investment opportunity.  First and foremost, Alleghany Corp. has emerged as the suitor of our current holding of Transatlantic Holdings (TRH).  Even Warren Buffett was turned down by Transatlantic holdings after he lobbed a lowball offer for TRH.  Despite this fact, Alleghany is acquiring Transatlantic Holdings at a price nearly 10% below book value.  This alone suggests that Alleghany has an eye values.   We've been adamant that Transatlantic Holdings was a great value (found here) and is trading 8% below the offer price of $59.79.
The Punchline: Being within 4% of the 52-week low and 12% below book value, Alleghany (Y) is definitely a long-term buying opportunity at $288.  We'd make Alleghany a two part acquisition that comprises 15% of the portfolio when completed.  Keep in mind that the stock has a downside target of $266 based on Dow Theory.

NLO Dividend Watch List: November 25, 2011

The S&P 500 index closed down -4.7% for the week while the blue-chip Dow Jones Industrial index was down -4.6%. Our dividend list contains 29 companies this week. Those companies within 5% of the 52-week low are listed below.

November 25, 2011

Symbol Name Price % Yr Low P/E EPS (ttm) Dividend Yield Payout Ratio
AVP Avon Products, Inc. 16.09 0.00% 9.46 1.70 0.92 5.72% 54%
CCBG Capital City Bank Group  9.65 0.00% 21.93 0.44 0.40 4.15% 91%
FNFG First Niagara Financial Group 8.24 0.24% 12.48 0.66 0.64 7.77% 97%
TR Tootsie Roll Industries Inc  22.88 0.26% 31.78 0.72 0.32 1.40% 44%
WST West Pharmaceutical 35.6 0.28% 19.67 1.81 0.72 2.02% 40%
AROW Arrow Financial Corp.  21.58 0.37% 11.66 1.85 1.00 4.63% 54%
T AT&T Inc 27.41 0.77% 13.91 1.97 1.72 6.28% 87%
BMS Bemis Co Inc 27.62 1.51% 13.88 1.99 0.96 3.48% 48%
MTB M & T Bank Corp. 67.7 1.96% 9.80 6.91 2.80 4.14% 41%
CHRW C.H. Robinson Worldwide, Inc.  63.63 2.13% 24.76 2.57 1.16 1.82% 45%
BDX Becton, Dickinson and Co. 71.11 2.18% 12.65 5.62 1.64 2.31% 29%
BMO Bank of Montreal 53.22 2.68% 10.82 4.92 2.82 5.30% 57%
WFSL Washington Federal, Inc.  12.52 3.05% 12.52 1.00 0.24 1.92% 24%
LM Legg Mason, Inc.  23.31 3.10% 14.21 1.64 0.32 1.37% 20%
AVY Avery Dennison Corp. 24.25 3.10% 9.19 2.64 1.00 4.12% 38%
BCR CR Bard, Inc. 83.37 3.18% 21.43 3.89 0.76 0.91% 20%
BMI Badger Meter, Inc. 27.83 3.42% 17.29 1.61 0.64 2.30% 40%
VNO Vornado Realty Trust 70.73 3.42% 16.96 4.17 2.76 3.90% 66%
HCC HCC Insurance Holdings, Inc. 25.6 3.81% 10.58 2.42 0.62 2.42% 26%
SYK Stryker Corp. 45.52 4.09% 14.45 3.15 0.72 1.58% 23%
WFC Wells Fargo & Co. 23.51 4.12% 8.71 2.70 0.48 2.04% 18%
BXS BanCorp.South Inc. 8.57 4.13% 17.85 0.48 0.04 0.47% 8%
WEYS Weyco Group, Inc.  21.72 4.32% 16.58 1.31 0.64 2.95% 49%
BEN Franklin Resources, Inc. 91.63 4.47% 10.63 8.62 1.00 1.09% 12%
EXPD Expeditors Intl of Washington 40 4.58% 22.10 1.81 0.50 1.25% 28%
CTAS Cintas Corp.  27.63 4.70% 15.44 1.79 0.54 1.95% 30%
SIAL Sigma-Aldrich Corp.  58.89 4.82% 16.36 3.60 0.72 1.22% 20%
GE General Electric Co 14.7 4.85% 11.22 1.31 0.60 4.08% 46%
CWT California Water Service 17.47 4.92% 17.83 0.98 0.62 3.55% 63%

Watch List Summary

Topping our list this week is Avon Products (AVP). According to IQTrends (http://www.iqtrends.com/), AVP is considered undervalued once it reaches a 3.7% dividend yield. The yield rose to 5.7% this week from 5.05% two weeks prior. Any long-term investor would need to do some extensive due diligence prior to committing their hard earned capital to this company. The current payout ratio (dividend/earnings) is at 54% imply that earnings can fall by half before a dividend cut is considered. Please note that the company is being investigated by SEC.

Another company for yield seekers is AT&T (T).  The current yield of 6.28% is hard to ignore when the 10 year T-Bill pays 1.97%.  IQTrends estimates that AT&T is undervalued when the yield reaches 5.5%. A return to historical undervalued yield would equate to 14% upside move. The payout ratio of 87% is quite high but not unusual for AT&T. The recent M&A deal with T-Mobile was broken up.  This should provide an interesting backdrop for how AT&T would fight off competition from its main rival Verizon.

Disclaimer:
On our current list, we excluded companies that have no earnings. Stocks that appear on our watch lists are not recommendations to buy. Instead, they are the starting point for doing your research and determining the best company to buy. Ideally, a stock that is purchased from this list is done after a considerable decline in the price and extensive due diligence. We suggest that readers use the March 2009 low (or the companies' most distressed level in the last 2 years) as the downside projection for investing. Our view is to embrace the worse case scenario prior to investing. A minimum of 50% decline or the November 2008 to March 2009 low, whichever is lower, would fit that description. It is important to place these companies on your own watch list so that when the opportunity arises, you can purchase them with a greater margin of safety. It is our expectation that, at the most, only 1/3 of the companies that are part of our list will outperform the market over a one-year period. 

Please consider donating to the New Low Observer. Thank you.

NLO Dividend Watch List: September 16, 2011

The market rallied everyday this week taking the Dow Jones Industrial Average above the 11,500 mark.  The S&P 500 is back above 1,200 level. In regards to Dow Theory, we believe that the bear market is still intact (see Dow Theory Bear Market stands).  Until both the Industrials and Dow Jones Transports can break above their intermediate high, we believe the market remains very vulnerable.

September 16, 2011 

Symbol Name Price % Yr Low P/E EPS (ttm) Dividend Yield Payout Ratio
ANAT American National Insurance 70.88 1.10% 11.74 6.04 3.08 4.35% 51%
TMP Tompkins Financial Corp. 36.51 2.41% 11.59 3.15 1.44 3.94% 46%
HGIC Harleysville Group Inc.  26.76 3.60% 15.12 1.77 1.52 5.68% 86%
SYY Sysco Corp. 27.4 3.71% 13.98 1.96 1.04 3.80% 53%
BRO Brown & Brown, Inc. 19.01 4.51% 17.28 1.10 0.32 1.68% 29%
PEP PepsiCo Inc. 62.05 4.73% 15.79 3.93 2.06 3.32% 52%
SFNC Simmons First National Corp.  21.8 5.47% 10.48 2.08 0.76 3.49% 37%
GBCI Glacier BanCorp., Inc.  10.64 5.56% 18.67 0.57 0.52 4.89% 91%
ALL Allstate Corp.   24.94 5.59% 23.75 1.05 0.84 3.37% 80%
GD General Dynamics Corp. 60.6 5.59% 8.64 7.01 1.88 3.10% 27%
SYBT S.Y. BanCorp., Inc.  19.4 5.66% 11.21 1.73 0.72 3.71% 42%
VLY Valley National BanCorp.  11.11 5.71% 13.23 0.84 0.69 6.21% 82%
CBSH Commerce Bancshares, Inc.  37.36 5.78% 13.25 2.82 0.92 2.46% 32%
CATO Cato Corp. 24.03 5.86% 10.97 2.19 0.92 3.83% 42%
MMM 3M Co 80.53 5.96% 13.67 5.89 2.20 2.73% 37%
CTBI Community Trust BanCorp., Inc.  24.65 6.02% 10.53 2.34 1.24 5.03% 53%
FRS Frisch's Restaurants, Inc 19.66 6.10% 10.51 1.87 0.64 3.26% 34%
BDX Becton, Dickinson and Co. 77.25 6.19% 12.98 5.95 1.64 2.12% 28%
BXS BanCorp.South Inc. 10.31 6.29% 21.94 0.47 0.04 0.39% 9%
T AT&T Inc 28.94 6.40% 8.41 3.44 1.72 5.94% 50%
CFR Cullen/Frost Bankers, Inc. 48.98 6.43% 13.88 3.53 1.84 3.76% 52%
NTRS Northern Trust Corp.  37 6.69% 14.68 2.52 1.12 3.03% 44%
DOV Dover Corp. 52.34 6.71% 11.45 4.57 1.26 2.41% 28%
SJW SJW Corp. 22.31 6.80% 16.77 1.33 0.69 3.09% 52%
BRK-A Berkshire Hathaway Inc. CL 'A' 107100 6.82% 14.36 7457.95 N/A N/A N/A
TR Tootsie Roll Industries Inc  24.89 7.01% 28.94 0.86 0.32 1.29% 37%
MDP Meredith Corp. 24.28 7.05% 8.73 2.78 1.02 4.20% 36%
MTB M & T Bank Corp. 74.15 7.11% 10.44 7.10 2.80 3.78% 39%
FNFG First Niagara Financial Group Inc.  10.46 7.28% 15.61 0.67 0.64 6.12% 96%
MATW Matthews International Corp.  31.25 7.35% 12.86 2.43 0.32 1.02% 13%
EOG EOG Resources, Inc. 90.16 7.44% 56.70 1.59 0.64 0.71% 40%
SWK Stanley Black & Decker, Inc. 56.73 7.59% 15.80 3.59 1.64 2.89% 46%
BOH Bank of Hawaii Corp. 40.13 7.62% 11.91 3.37 1.80 4.49% 53%
GS Goldman Sachs Group, Inc.   107.49 7.73% 10.54 10.20 1.40 1.30% 14%
ALB Albemarle Corp. 46.3 7.77% 10.72 4.32 0.66 1.43% 15%
PAYX Paychex, Inc.  27.08 7.80% 19.07 1.42 1.24 4.58% 87%
CYN City National Corp. 42.13 7.89% 13.95 3.02 0.80 1.90% 26%
PRK Park National Corp. 53.56 7.92% 12.06 4.44 3.76 7.02% 85%
ATNI Atlantic Tele-Network, Inc. 32.6 7.95% 31.65 1.03 0.88 2.70% 85%
FFIN First Financial Bankshares, Inc.  28.23 8.00% 13.70 2.06 0.96 3.40% 47%
CWT California Water Service 18.05 8.41% 18.61 0.97 0.62 3.43% 64%
WEYS Weyco Group, Inc.  22.81 8.41% 18.85 1.21 0.64 2.81% 53%
JCI Johnson Controls Inc   30.19 8.48% 13.48 2.24 0.64 2.12% 29%
THFF First Financial Corp. 28.75 8.49% 11.88 2.42 0.94 3.27% 39%
SHW Sherwin-Williams Co. 75.37 8.49% 16.53 4.56 1.46 1.94% 32%
TRV The Travelers Companies, Inc. 50.61 8.56% 9.57 5.29 1.64 3.24% 31%
BANF BancFirst Corp.  34.61 8.60% 12.49 2.77 1.08 3.12% 39%
EGN Energen Corp. 47.11 8.75% 12.30 3.83 0.54 1.15% 14%
TRMK Trustmark Corp.  20.24 8.88% 12.19 1.66 0.92 4.55% 55%
WMT Wal-Mart Stores, Inc. 52.65 8.98% 11.20 4.70 1.46 2.77% 31%
CB Chubb Corp.   60.39 9.03% 8.69 6.95 1.56 2.58% 22%
BMO Bank of Montreal 60.07 9.08% 11.55 5.20 2.82 4.69% 54%
AVP Avon Products, Inc. 22.1 9.14% 12.92 1.71 0.92 4.16% 54%
UMBF UMB Financial Corp.  36.79 9.17% 14.96 2.46 0.78 2.12% 32%
DNB Dun & Bradstreet Corp. 66.59 9.25% 12.96 5.14 1.44 2.16% 28%
FFIC Flushing Financial Corp.  11.20 9.27% 8.55 1.31 0.52 4.64% 40%
ASBC Associated Banc-Corp.  10.32 9.32% 32.25 0.32 0.04 0.39% 13%
ARE Alexandria Real Estate Equities, Inc. 68.56 9.57% 23.97 2.86 1.80 2.63% 63%
HNZ HJ Heinz Co. 51.52 9.66% 17.12 3.01 1.92 3.73% 64%
FUL HB Fuller Company 20.89 9.95% 12.90 1.62 0.30 1.44% 19%
SEIC SEI Investments Company  16.88 9.97% 13.84 1.22 0.24 1.42% 20%
BMS Bemis Co Inc 31.25 10.00% 15.55 2.01 0.96 3.07% 48%
GCI Gannett Co Inc 10 10.05% 4.73 2.13 0.32 3.18% 15%
ADM Archer Daniels Midland Co. 28.62 10.08% 9.14 3.13 0.64 2.24% 20%
AFL AFLAC Inc. 36.33 10.09% 9.56 3.80 1.20 3.30% 32%
CBU Community Bank System, Inc. 23.99 10.30% 12.30 1.95 1.04 4.34% 53%
AOS AO Smith Corp. 37.51 10.32% 11.20 3.35 0.64 1.71% 19%
CHFC Chemical Financial Corp.  16.74 10.42% 12.49 1.34 0.80 4.78% 60%
APD Air Products & Chemicals, Inc. 82.36 10.43% 15.34 5.37 2.32 2.82% 43%
EXPD Expeditors International of Washington, Inc.  44.33 10.44% 25.33 1.75 0.50 1.13% 29%
WFC Wells Fargo & Co. 24.95 10.50% 9.67 2.58 0.48 1.92% 19%
MUR Murphy Oil Corporation 52.21 10.52% 10.59 4.93 1.10 2.11% 22%
EMR Emerson Electric Co. 45.74 10.56% 14.12 3.24 1.38 3.02% 43%
UBSI United Bankshares, Inc.  21.52 10.70% 13.04 1.65 1.20 5.58% 73%
FII Federated Investors Inc 17.75 10.87% 11.02 1.61 0.96 5.41% 60%
GE General Electric Co 16.33 10.94% 12.86 1.27 0.60 3.67% 47%
STT State Street Corp. 34.43 10.96% 10.90 3.16 0.72 2.09% 23%
77 Companies

Watch List Summary
Topping our list this week is a life insurance company, American National (ANAT), which is selling at half of its book value.  With a 4.35% dividend yield and a conservative dividend payout ratio, ANAT should entice most patience investors to look into this company.  We've initiated a 5% position of this company in our portfolio.
Another company we like and have mentioned many times is Sysco (SYY).  We again bring back the concept of using dividend yield to gauge valuation.  Sysco historically is undervalued at 2% thus making it very attractive at current levels.  If the yield returns to the historical undervalued range, the potential upside would be 90%.  With a payout ratio sitting at 53%, the earnings could take a hit and the dividend is would still be safe. We've initiated a 5% position of this company in our portfolio.
Pepsi Co. (PEP) is another name we'd like to highlight.  The earnings predictability of Pepsi Co. is high and investors could possibly extract additional information on key metrics such as cash flow or dividend outlook.  According to its historical trend, anytime Pepsi trades above 2.2% dividend yield, the stock is considered undervalued.  The current yield of 3.32% could reward long-term investor with 50% upside in a fairly short period of time.

Top Five Performance Review

In our ongoing review of the NLO Dividend Watch List, we have taken the top five stocks in our database from September 17, 2010 (not published) and have checked their performance one year later. The top five companies on that list can be seen in the table below.


Symbol Name 2010 Price 2011 Price % change
WST West Pharmaceutical 33.43 40.07 19.86%
OMI Owens & Minor, Inc. 26.63 29.89 12.24%
WFSL Washington Federal, Inc.  14.59 14.99 2.74%
FUL HB Fuller Company 19.32 20.89 8.13%
CSL Carlisle Companies Inc. 29.31 37.15 26.75%
Average 13.94%
DJI Dow Jones Industrial 10,607.85 11,509.09 8.50%
SPX S&P 500 1,125.59 1,216.01 8.03%

Last year's top five outperformed the market by more than 5%.  The best performer was Carlisle (CSL) whose share have risen as high as 73% and that occurred within 7 months.  West Pharma (WST) rose as high as 40% in just 6 months.

Disclaimer:

On our current list, we excluded companies that have no earnings. Stocks that appear on our watch lists are not recommendations to buy. Instead, they are the starting point for doing your research and determining the best company to buy. Ideally, a stock that is purchased from this list is done after a considerable decline in the price and extensive due diligence. We suggest that readers use the March 2009 low (or the companies' most distressed level in the last 2 years) as the downside projection for investing. Our view is to embrace the worse case scenario prior to investing. A minimum of 50% decline or the November 2008 to March 2009 low, whichever is lower, would fit that description. It is important to place these companies on your own watch list so that when the opportunity arises, you can purchase them with a greater margin of safety. It is our expectation that, at the most, only 1/3 of the companies that are part of our list will outperform the market over a one-year period.


Please consider donating to the New Low Observer. Thank you.

In the News: September 10, 2011

Please consider donating to the New Low Observer. Thank you.

Nasdaq 100 Watch List: September 9, 2011

Below are the Nasdaq 100 companies that are within 6% of their respective 52-week lows.  Keep in mind that we received a Dow Theory Bear Market indication on August 2, 2011 (article here).  This means that we have reallocated our positions to much lower levels than when we had a bull market indication on July 24, 2009 (article here).

Symbol Name Trade P/E EPS Yield P/B Div/Shr payout ratio % from Low
QGEN Qiagen N.V. 13.87 25.22 0.55 0 1.30 0 0.65%
ESRX Express Scripts, Inc. 43.67 17.89 2.44 0 12.25 0 0.81%
FISV Fiserv, Inc. 51.47 16.88 3.05 0 2.44 0 1.00%
INFY Infosys Limited 47.17 17.34 2.72 1.70% 4.57 0.85 31.25% 1.46%
AMAT Applied Materials 10.73 7.39 1.45 2.90% 1.67 0.32 22.07% 2.14%
PAYX Paychex, Inc. 25.93 18.26 1.42 4.60% 6.44 1.24 87.32% 3.22%
BMC BMC Software 38.46 15.19 2.53 0 4.23 0 3.41%
FSLR First Solar, Inc. 84.96 14.48 5.87 0 2.03 0 3.47%
WCRX Warner Chilcott plc 14.95 31.81 0.47 0 141.57 0 4.18%
URBN Urban Outfitters 24.56 16.63 1.48 0 3.01 0 4.51%
EXPD Expeditors Intl of Wash. 42.06 24.03 1.75 1.10% 4.88 0.5 28.57% 4.78%
VOD Vodafone Group Plc 25.77 10.6 2.43 7.30% 0.95 1.92 79.01% 4.80%
NIHD NII Holdings, Inc. 36.18 14.7 2.46 0 1.67 0 4.84%
VRSN VeriSign, Inc. 29.03 6.47 4.49 0 N/A 0 4.99%
PCAR PACCAR Inc. 35.38 17.96 1.97 2.00% 2.26 0.72 36.55% 5.20%
SIAL Sigma-Aldrich 59.18 17.45 3.39 1.10% 3.27 0.72 21.24% 5.34%
DTV DIRECTV 41.42 13.66 3.03 0 N/A 0 5.89%
CA CA Inc. 19.71 11.87 1.66 1.00% 1.76 0.2 12.05% 5.91%

From this list, we have initiated new positions in Applied Materials (AMAT) and Expeditors International of Washington (EXPD) on Friday September 9, 2011 equal to 5% of our portfolio, respectively.  As these stocks decline we expect to add to our positions.

Disclaimer:

On our current list, we excluded companies that have no earnings. Stocks that appear on our watch lists are not recommendations to buy. Instead, they are the starting point for doing your research and determining the best company to buy. Ideally, a stock that is purchased from this list is done after a considerable decline in the price and extensive due diligence. We suggest that readers use the March 2009 low (or the companies' most distressed level in the last 3 years) as the downside projection for investing. Our view is to embrace the worse case scenario prior to investing. A minimum of 50% decline or the November 2008 to March 2009 low, whichever is lower, would fit that description. It is important to place these companies on your own watch list so that when the opportunity arises, you can purchase them with a greater margin of safety. It is our expectation that, at the most, only 1/3 of the companies that are part of our list will outperform the market over a one-year period.
Please consider donating to the New Low Observer. Thank you.

The General Nature of Bear Market Declines According to Charles H. Dow

"The stock market seldom has uninterrupted advances or declines. Its gains and its losses are the net outcome of an irregular movement. Even in a bear market, days of advance are very frequent.
"This is because there are always strong people long of stocks and hopeful enough to be willing to add something to their lines. It is because the seller of short stocks must become a buyer, while the holder of long stocks is not necessarily a seller. It is because whenever stocks become oversold, and there is difficulty in borrowing, somebody endeavors to start covering in order to make a turn out of frightened shorts. These, and other causes, combine to make more rallies in a bear market than there are relapses in a bull market, even where the total movement is about the same.
"Furthermore there is always a feeling on the part of traders when the market has gone one way for several days in succession, that it ought to turn, and stocks are bought in anticipation of recovery. The buyers are sometimes numerous enough, and powerful enough, to make by their own purchases the rally which they anticipate."
Quick Summary
  • Declines are seldom uninterrupted
  • Short sellers must eventually buy, investors that are long the market can remain inactive
  • There are more rallies in a bear market than there are secondary reaction in a bull market even when the total movement is the same
  • Buyers produce self-fulfilling rebounds in the market
Dow, Charles H. Wall Street Journal. October, 9, 1901
Sether, Laura. Dow Theory Unplugged. W&A Publishing. 2009. page 339.
Bishop, George W. Charles H. Dow and the Dow Theory. Appleton-Century-Crofts. 1960. page 167.

Please consider donating to the New Low Observer. Thank you.

A Review of Projection Strategies

There are two articles that we published in 2010 on Seeking Alpha (also found on our site) that explore different methodologies but come to the same conclusion.  The first article is titled "Three Upside Scenarios for the Dow Industrials."  In that article, we covered the timing aspect of the Dow Industrials reaching the old high of 14,164 using price projection lines.The second article on Seeking Alpha is titled "A Market Cycle Worth Observing" which covers the 4-4 1/2 year market cycle.  Although the first article incorrectly anticipates the Dow Industrials going back to the old high of 2007, in both cases they arrive at a market top occurring between the months of January and June of 2011. 
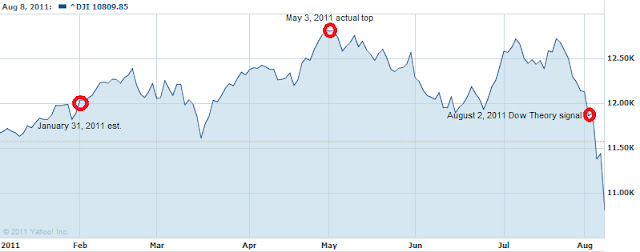
If we look at the Dow Industrials in the chart above, we can see that May 3, 2011 was the actual top.  Coincidentally, the May 3, 2011 top was 93 days from our January 31, 2011 estimate and 91 days from the Dow Theory bear market indication on August 2, 2011. The two different approaches to analyzing the market may prove useful for market projections going forward.

Please consider donating to the New Low Observer. Thank you.

In the News: August 7, 2011

Buy this market at MarketWatch
Transatlantic Holdings (TRH) gets lowball offer from Buffett
 It was announced on Sunday August 7, 2011 that Warren Buffett has put up a bid for Transatlantic Holdings (TRH).  The all cash offer is coming in at $52, a premium of nearly 15% above the closing price of Friday August 5, 2011.  In a market that appear on the brink of collapse, the all cash offer from Berkshire Hathaway appears to be tantalizing.  However, we know for a fact that Buffett is making a lowball offer.
According to Yahoo!Finance, Transatlantic Holdings has a book value of $67.  According to Valueline Investment Survey, TRH has a book value of $66 and is expected to have a book value of $70 in 2012.
This is among the many stocks that we’ve tracked and then Buffett has subsequently made an offer for.  In fact, only two days after our investment recommendation of Wesco Financial, Buffett made an offer to buy the company out. In our August 29, 2010 Dividend Watch List, we said the following:
Our Investment Observation of Wesco Financial (WSC) on August 24, 2010 was quickly verified as being undervalued by Warren Buffett's offer to buy the remaining portion that he didn't already own on Thursday August 26th. We were able to provide a new Investment Observation of Transatlantic Holdings (TRH). With Transatlantic Holdings selling below book value, median price-to-earnings and dividend increases every year since going public, we believe TRH is a great alternative to Wesco Financial.
After we made the switch from Wesco to Transatlantic Holdings (TRH), we later sold Transatlantic Holdings within two days of the 52-week high.  Subsequent to our sell recommendation of Transatlantic Holdings the stock declined from $53.52 to $44.  On our June 12, 2011 Dividend Watch List we reiterated Transatlantic Holdings as a stock that should be considered.  Three suitors later, we’re getting the lowball offer from Buffett.  We’re hopeful that the Davis Advisors and other large shareholders fight this offer.
Please consider donating to the New Low Observer. Thank you.

NLO Dividend Watch List: August 6, 2011

Quick Take: U.S. rating downgrade
Late Friday evening, Standard & Poor's downgraded the debt of the U.S. from AAA to AA+.  The full implications of such action are yet to be known.  However, we believe that there are some interesting points to be made.  A lower debt rating will require the U.S. government to increase the yield offered on new issuance's. A more competitive yield might draw money out of the stock market and into fixed income securities. As rates rise, utilities and real estate investment trusts (REITs) might come under extreme pressure as the markets try to weight the benefit of holding assets that offer no guarantee and relatively less competitive yields.
Also, it has not gone unnoticed by us that the U.S. first got tagged with the AAA rating in 1941 and had held that rating through a completed interest rate cycle.  It seems almost ironic that the AAA rating ascribed to the U.S. when interest rates were at their lowest would be taken away at the same level 70 years later.  We also note that rating agencies tend to show up late to the party.  The chart below tells us that it only gets interesting from here.
  
NLO Dividend Watch List
At the end of the week, our list contained over 120 companies. We had to pare down the number of companies on the list so we decided to post only those stocks trading within 5% of the 52-week low.
symbol name price p/e earnings yield p/b % from low
GBCI Glacier Bancorp, Inc. 12.41 21.66 0.59 3.9 1.05 0.08%
SYBT S.Y. Bancorp, Inc. 21.47 12.41 1.71 3 1.72 0.28%
BOH Bank of Hawaii 43.04 12.77 3.37 4 2.03 0.49%
O Realty Income 30.01 28.5 1.04 5 2.21 0.81%
SFNC Simmons First National 23.47 11.29 2.15 3 1.03 0.95%
FNFG First Niagara Financial 11.06 16.58 0.76 5 0.79 1.10%
CHFC Chemical Financial 18.05 13.52 1.34 4.2 0.88 1.12%
MLM Martin Marietta 67.63 36.76 2.24 2 2.16 1.17%
SUSQ Susquehanna Bancshares 6.8 39.53 0.17 1 0.45 1.19%
CFR Cullen/Frost Bankers 51.28 14.53 3.5 3.4 1.46 1.24%
PRK Park National 60 13.52 4.51 5.8 1.42 1.52%
TCB TCF Financial 11.83 13.77 0.99 1.5 1.07 1.55%
SON Sonoco Products 29.9 15.03 2.04 3.5 1.91 1.63%
CMA Comerica 29.13 14.98 1.68 1.2 0.88 1.75%
IBKC IBERIABANK 49.18 28.84 1.84 2.3 1 1.80%
ALL Allstate 26.29 25.06 2.45 3 0.72 1.94%
EMR Emerson Electric 45.39 13.99 3.11 2.5 3.15 1.95%
BRK-A Berkshire Hathaway 107k 16.3 6.6k - 1.1 1.98%
MCY Mercury General 36.54 13.43 2.72 6.2 1.11 2.07%
MDP Meredith 26.56 9.56 2.85 3.4 1.58 2.08%
NTRS Northern Trust 41.3 16.39 2.71 2.4 1.41 2.13%
FII Federated Investors 19.53 12.14 1.67 4.3 3.75 2.20%
GS Goldman Sachs 125.18 12.28 9.13 1 0.94 2.31%
HGIC Harleysville 29.5 10.56 2.79 4.7 1.03 2.36%
SEIC SEI Investments 17.76 14.56 1.22 1.2 3.11 2.36%
AFL AFLAC 41.72 10.97 4.44 2.7 1.65 2.38%
PG Procter & Gamble 60.59 15.97 3.8 3.3 2.53 2.40%
BKH Black Hills 28.8 17.61 1.64 4.8 1 2.42%
LEG Leggett & Platt 19.3 16.31 1.16 4.6 1.88 2.50%
CINF Cincinnati Financial 25.97 14.36 2.27 5.8 0.84 2.53%
WMT Wal-Mart Stores 50.85 11.11 4.58 2.7 2.68 2.54%
AVY Avery Dennison 29.12 10.47 2.88 3.2 1.72 2.57%
UBSI United Bankshares, Inc. 22.66 13.73 1.66 4.8 1.24 2.58%
ANAT American Nat'l Insurance 76.02 12.85 5.91 4.1 0.55 2.59%
WEYS Weyco Group, Inc. 22.83 19.85 1.15 2.5 1.48 2.61%
NWN Northwest Natural Gas 42.8 16.31 2.62 3.7 1.58 2.64%
AVP Avon Products 23.21 13.56 1.62 3.3 4.87 2.72%
TDS TDS 25.47 19.59 1.3 1.6 0.7 2.83%
RBCAA Republic Bancorp 17.29 3.95 4.36 2.9 0.83 2.86%
CYN City National 48.58 16.09 3.02 1.5 1.27 2.95%
BXS BancorpSouth 11.92 25.36 0.16 0.3 0.83 3.03%
LLTC Linear Technology 27.08 10.83 2.36 3.1 12.52 3.08%
MRK Merck & Company 31.71 59.94 0.53 4.2 1.79 3.12%
EV Eaton Vance 23.29 15.12 1.54 2.5 5.71 3.14%
TRH Transatlantic Holdings 45.24 17.2 3.06 1.7 0.69 3.17%
TEG Integrys Energy Group 47.58 12.67 3.75 5.2 1.23 3.19%
NUE Nucor 34.95 23.6 0.82 3.6 1.48 3.22%
SCG SCANA Corp 37.32 12.56 2.97 4.7 1.24 3.38%
VLY Valley National Bancorp 12.15 14.45 0.77 5 1.6 3.47%
VNO Vornado Realty Trust 80.78 18.75 4.31 2.8 2.61 3.48%
ADM Archer-Daniels-Midland 28.64 9.15 3.25 2.1 0.97 3.58%
FCBC First Community Banc 12.04 9.48 1.25 2.7 0.76 3.70%
ECL Ecolab Inc. 47.78 21.51 2.23 1.4 4.77 3.71%
UVV Universal 36.33 6.7 5.42 5.1 0.84 3.74%
VAL Valspar 30.17 13.94 2.16 2.1 1.82 3.78%
BMI Badger Meter 35.27 20.04 1.76 1.5 3.01 3.80%
GCI Gannett Co. 10.8 5.07 2.13 2.3 1.19 3.85%
LOW Lowe's 20.15 14.18 1.42 2.4 1.53 4.13%
PEP Pepsico 64.67 16.45 3.74 3.1 4.17 4.22%
SJW SJW 22.86 17.2 1.28 2.8 1.67 4.48%
MUR Murphy Oil 55.2 11.64 4.74 1.6 1.29 4.55%
FFIN First Financial 30.44 14.79 1.99 2.8 2 4.85%
KMB Kimberly-Clark 64.07 15.12 4.4 4.1 4.22 4.93%
Top 5 Performance review
In our ongoing review of the NLO Dividend Watch List, we have taken the top five stocks on our list from August 6, 2010 and have check their performance one year later. The top five companies on that list can be seen in the table below.
Symbol Company 2010 2011 % change
PBI Pitney Bowes Inc   20.71 20.02 -3.33%
WST West Pharmaceutical Services 35.26 41.91 18.86%
PAYX Paychex, Inc.  25.56 27.09 5.99%
HGIC Harleysville Group 30.9 29.5 -4.53%
CWT California Water Service Group 17.49 18.09 3.43%
Average 4.08%
^DJI Dow Industrials 10653.56 11444.61 7.43%
^GSPC S&P 500 1121.64 1199.39 6.93%
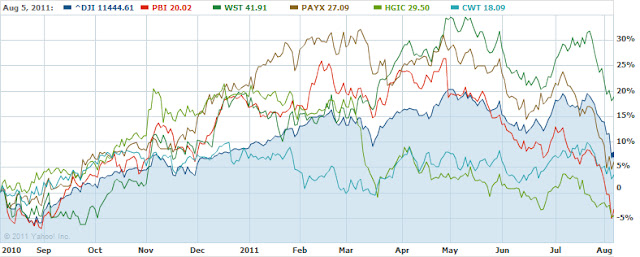
The top 5 companies on our list last year underperformed the major indexes by a wide margin.  However, in the chart below, you'll notice that all 5 stocks achieved 10% gains (our ideal target for selling) within 4 months of the August 6th posting; such a gain approximates nearly 30% annualized returns.  We cannot emphasis enough the value of selling these stocks if a 10% gain is accomplished within a year while inside of a tax-deferred account.  As you can see, the year end results vastly differ from the gains that could have been made.
Please consider donating to the New Low Observer. Thank you.

Nasdaq 100 Watch List: July 29, 2011

Below are the Nasdaq 100 companies that are within 20% of the 52-week low. This list is strictly for the purpose of researching whether or not the companies have viable business models. Although these companies are very risky, based on the current price they are at reasonable values and offer significant opportunity to outperform the market in the coming year.
Symbol Name Price P/E EPS Yield P/B % from Low
RIMM Research In Motion 25 3.97 6.3 0.00% 1.38 0.77%
YHOO Yahoo! Inc. 13.1 14.79 0.89 0.00% 1.38 1.24%
QGEN Qiagen N.V. 16.94 29.21 0.58 0.00% 1.57 2.17%
AKAM Akamai Technologies 24.22 25.63 0.95 0.00% 2.02 2.45%
LLTC Linear Technology 29.3 12.42 2.36 3.20% 17.06 2.99%
TEVA Teva Pharmaceutical 46.64 12.54 3.72 1.70% 1.8 3.97%
FSLR First Solar, Inc. 118.23 16.87 7.01 0.00% 2.84 6.13%
LIFE Life Technologies 45.03 22.45 2.01 0.00% 1.87 6.20%
PCAR PACCAR Inc. 42.81 21.73 1.97 1.70% 2.67 7.64%
CSCO Cisco Systems, Inc. 15.97 12.47 1.28 1.50% 1.87 8.05%
AMGN Amgen Inc. 54.7 11.37 4.81 0.00% 2 8.83%
ADBE Adobe Systems 27.71 14.84 1.87 0.00% 2.57 8.88%
SPLS Staples, Inc. 16.06 13.05 1.23 2.50% 1.57 8.88%
INFY Infosys Limited 62.22 22.88 2.72 1.40% 5.69 9.68%
WCRX Warner Chilcott plc 21.02 32.9 0.64 0.00% N/A 10.57%
VRSN VeriSign, Inc. 31.21 6.66 4.69 0.00% 9.89 12.27%
MRVL Marvell Technology Group, Ltd. 14.82 11.73 1.26 0.00% 1.87 12.53%
CHRW C.H. Robinson Worldwide, Inc. 72.31 28.92 2.5 1.60% 9.29 13.34%
ATVI Activision Blizzard, Inc 11.84 27.41 0.43 1.40% 1.34 13.85%
FLIR FLIR Systems, Inc. 27.46 20.95 1.31 0.90% 2.72 14.42%
PAYX Paychex, Inc. 28.23 19.88 1.42 4.40% 6.86 14.52%
LRCX Lam Research Corporation 40.88 6.96 5.88 0.00% 2.28 15.51%
MU Micron Technology, Inc. 7.37 11.66 0.63 0.00% 0.87 15.88%
SHLD Sears Holdings 69.67 N/A -0.49 0.00% 0.91 15.88%
URBN Urban Outfitters, Inc. 32.54 21.32 1.53 0.00% 3.96 16.38%
FFIV F5 Networks, Inc. 93.48 34.38 2.72 0.00% 6.53 16.85%
MSFT Microsoft Corporation 27.4 10.19 2.69 2.30% 4.07 17.50%
NIHD NII Holdings, Inc. 42.35 18.76 2.26 0.00% 2.04 19.13%
AMAT Applied Materials, Inc. 12.32 10.36 1.19 2.60% 2.01 19.96%

Watch List Performance Review

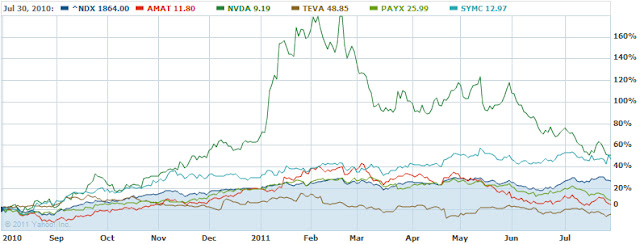
In our ongoing review of the Nasdaq 100 Watch List, we have taken the top five stocks on our list from July 30, 2010 and have checked their performance one year later. The top five companies on that list can be seen in the table below.
Symbol Name 2010 2011
% change
SYMC Symantec Corp. 12.97 19.06
46.95%
AMAT Applied Materials 11.80 12.32
4.41%
NVDA NVIDIA Corp. 9.19 13.83
50.49%
TEVA Teva Pharma. 48.85 46.64
-4.52%
PAYX Paychex, Inc. 25.99 28.23
8.62%
Average gain
21.19%
^NDX Nasdaq 100 1864.00 2362.81
26.76%
Please consider donating to the New Low Observer. Thank you.

In the News

Please consider donating to the New Low Observer. Thank you.