Category Archives: Richard Russell

Y2K: The Top of the Market

In the very first posting for 2018, we covered the prescient comments of Warren Buffett from November 22, 1999 when he said:

“Let me summarize what I've been saying about the stock market: I think it's very hard to come up with a persuasive case that equities will over the next 17 years perform anything like--anything like--they've performed in the past 17. If I had to pick the most probable return, from appreciation and dividends combined, that investors in aggregate--repeat, aggregate--would earn in a world of constant interest rates, 2% inflation, and those ever hurtful frictional costs, it would be 6%. If you strip out the inflation component from this nominal return (which you would need to do however inflation fluctuates), that's 4% in real terms. And if 4% is wrong, I believe that the percentage is just as likely to be less as more (Loomis, Carol. Mr. Buffett on the Stock Market. Fortune. November 22, 1999. accessed: everyday since.).”

In the 17 years since Buffett’s comments, the stock market has gained +2.27% when adjusted for inflation and compounding of dividends.  Even if we included the year 2017 in the picture, the CAGR of the S&P 500 would have been +3.15%.  It is easy to say that Warren Buffett is a genius because, after all, look at the wealth that he has managed to amass.  But what about the regular people out there?  How can they identify a market that has peaked?

One source that we like to cite is the work of the late Richard Russell of Dow Theory Letters (www.dowtheoryletters.com).  In his March 22, 2000 letter, Russell Provided what is known as the “Top Out Parade.”  That Top Out Parade provided much of the indications that the stock market had peaked.  To put the Top Out Parade in perspective, we’ve posted a chart of the Dow Jones Jones Industrial Average indicated in blue the Buffett quote and in red the Russell posting of the Top Out Parade.

image

Both Buffett’s commentary of the expected performance of the market over the next 17 years and Russell’s observation of the Top Out Parade identified keys area in the market that should have been obvious to everyone. 

Below is the original Top Out Parade list as published by Richard Russell on March 22, 2000 in Letter 1298.  We think that anyone who tracks similar data will have a decent idea of whether or not we’ve seen some kind of top in the market, provided the indicators do not make new highs. Enjoy.

Richard Russell: The Passing of an Icon

image

Read the full tribute here

Dow Theory: The Misunderstood Barometer

Dow Theory is a fickle beast.  While the theory is sound, those that interpret it have their challenges.  A recent article dated May 21, 2015 titled “Transportation Average – A Big Concern for Stock Bulls?” by Chris Ciovacco presents some of the difficulties with the topic of Dow Theory. In this article, we’ll attempt to clarify some issues that should be discussed when making interpretations of Dow Theory.

The article by Ciovacco starts off by pointing out the recent divergence between the Dow Jones Transportation Average and the Dow Jones Industrial Average.  A divergence exists when one index makes new highs or lows while the other index fails to go in the same direction.  According to Dow Theory, if there is a divergence, it could indicate that the previous trend will be reversed.  As the prior trend in the stock market from 2009 to 2015 has been bullish, the implication is that the bull market could be coming to an end.

image

In explaining whether investors should be worried about the “non-confirmation” exhibited by the divergence between the Industrial and Transportation Averages, the article identifies the period from 1989 to 1993 when there appeared to be a divergence between the same indexes.  However, at the time of the divergence, according to the author, the S&P 500 managed to gain as much as +25%.  What is not shown or discussed are the key indications of a bull or bear market in the period from 1989 to 1993.  These elements will complete a picture that is necessary for anyone hoping to understand and possibly benefit from Dow Theory.

Identifying the Bear Market

Below is a charting of the period 1989 to 1993 in smaller segments for a more accurate Dow Theory assessment.  First is the indication of a bear market based on Dow Theory which occurred on October 13, 1989.

image

Our ex post interpretation of when a bear market was signaled by Dow Theory is supported by the Dow Theorist Richard Russell in his Dow Theory Letters publication. In his official investment stance on October 4, 1989, Russell said:

image

This is contrasted by what Russell said in his October 18, 1989 posting:

image

Russell made clear that from a Dow Theory perspective, a bear market had been signaled.  As a side note, Russell’s PTI or Primary Trend Indicator did not confirm the bearish signal until February 7, 1990 (four months later).  The PTI is not a part of Dow Theory but has proven to be a useful market tool.

Identifying the Bull Market

Using our own ex post analysis of the charts of the Dow Jones Industrial Average and the Dow Jones Transportation Average, we find that a new Dow Theory bull market was signaled on January 18, 1991.

image

Richard Russell was suspicious of the Dow Theory bull market that was signaled on January 18, 1991 and chose to wait for his PTI to give the all clear.  Russell said the following on February 6, 1991:

image

But even the preceding commentary was buried by the following overriding thoughts by Russell:

image

The question is ultimately asked by Ciovacco, “Would it have made sense to sell all our stocks because the Dow Transports failed to make a new high?”  The point being, why get caught up in a “signal” that potentially will result in lost investment gains? After all, the S&P 500 index increased by +25% in the period when it appeared that there was a divergence between the Dow Jones Industrial Average and Dow Jones Transportation Average.

This is where a significant problem comes up in the analysis of Dow Theory.  First, if we assume that a divergence did occur in Ciovacco’s selected time frame, rather than a bear market indication, then an adherent of Dow Theory would accept that a divergence is merely a caution signal.  This would have meant that whatever the previous trend of the market was, it remains in place until a definitive reversal occurs.  In our most recent market action, a bull market was still the indication and thus there would be  no need “… to sell all our stocks…”

Another issue not mentioned is that Dow Theory does not give buy or sell signals as we pointed out in our July 25, 2011 article. Among the many things overlooked about Dow Theory is that it is intended to reflect the changes in the stock market, investment values, and the economy.  As a barometer, it merely indicates the direction that the stock market and economy might go three to nine months into the future. Those who take bull or bear market indications as buy or sell signals still need to be well versed in understanding values and compounding and their role in investing. If a person, not versed in values and compounding, believes that any indication means that they can haphazardly buy or sell stocks then they are most likely to suffer severe losses and quickly become disenchanted with the accumulation of assets.

Identifying Recessions

In the past, Dow Theory was often heralded as a peek into the future for the economy.  In the 1989 example above, the Dow Theory bear market preceded the National Bureau of Economic Research’s (NBER) definition of a recession by nine months.  Dow Theory signaled a bear market in October 1989 and the NBER indicated that a recession began July 1990.  However, the NBER announced their conclusion about when the recession began on April 25, 1991, a full year and a half after the Dow Theory bear market signal and nine months after their own designation of when the recession began.  Additionally, Dow Theory indicated that a new bull market was in place on January 18, 1991 or three months before the NBER announced that the recession ended in March 1991.

Final Thoughts

What some market bears would like to accomplish with Dow Theory is to anticipate scenarios where divergence leads to an actual bear market of significant magnitude like what happened in the period from 1972 to 1974.

DT '72

The decline experienced from the respective peaks was –59% and –44% for the Transports and Industrials.  Since the outcome of a divergence cannot be accurately anticipated, it is far “safer” to wait for the confirmation of the trend before considering any potential actions.  However, if investors had sold their stocks on October 13, 1989 and repurchased stocks on January 18, 1991 (and held until December 31, 1993), the gains would have been +40%, +41% and +76.04% for the S&P 500, Industrials and Transportation Index, respectively.

What some market bulls would like to accomplish without Dow Theory is not selling if the net effect is for the market to ultimately climb well beyond the point of the initial divergence.  As an example,  if we take the October 13, 1989 date and calculate the returns for the S&P 500, Dow Industrials and Dow Transports until December 31, 1993, we find that the returns were +39%, +46% and +25%, respectively.

Dow Theory only works as a barometer for the stock market when taken in the context of investment values and compounding.  As an indicator of coming recessions, as defined by NBER, Dow Theory has an unrivaled track record.  The translation of these ideas often get confused as recessions don’t necessarily result in jarring –50% declines in the stock market every time.

Our tactic on the divergence is to dump more funds into the cash portion of the brokerage account so that we can make large purchases if a precipitous decline ensues.  If a decline does not materialize, we will continue our slow and selective investment buying program for compounding purposes.

E. George Schaefer and Gold Stocks

E. George Schaefer is most synonymous with Dow Theory and its modern application.  However, E. George Schaefer was also known for his work in the selection and timing of gold and silver stocks.  As a bit of background on E. George Schaefer, in 1960, he wrote a book titled How I Helped 10,000 Investors to Profit in Stocks.image

The book was about Dow Theory and its application.   According to Richard Russell:

“…Schaefer started his ‘Dow Theory Trader’ service in 1948.  this analyst possesses a ‘feel’ for the market and an instinct for the big picture second to none.  He is one of the very, very few men who fully comprehend the concept of the primary trend.  A warning: if you have ever heard Schaefer speak, do not be fooled by his ‘hoosier-country boy’ style of delivery.  For Schaefer has been way ahead of the city boys on Wall Street for a long time.

“Schaefer provided his readers with many important technical studies during the late 1940’s and early 1950’s, and he has always labeled himself a ‘modern Dow Theorist.’ Schaefer has combined many technical considerations with his reading of the Averages, and I have found his thinking along these lines to be sound.

“In my library is a copy of Schaefer’s June 18, 1949 report, in which he predicted a major new bull market.  His reasoning was brilliant, and if he had never written anything else, he would rate a ‘superb’ on this one alone.  Personally, I wish that Schaefer had continued with his earlier technical studies, but those were written when the technical approach (and, in fact, almost any approach) was rare, and it is possible that he is now a bit tired of the ‘teaching’ approach which was a feature of his earlier letters.”

Our personal favorite by E. George Schaefer was a Barron’s article dated June 22, 1959 titled “Final Bullish Upsurge In Many Stocks Just Starting?” This article stands as a lone beacon for how modern Dow Theorists can understand the distinction between a bull and bear market as part of the primary trend.  We note that at the time, Richard Russell was of the view that the stock market was due for a bear market and called a bear market in 1961.  Schaefer was sticking to his 1959 call and told investors to hold onto their positions which was rewarded with another +40% increase in the Dow Jones Industrial Average.

Schaefer and Gold Stocks

Continue reading

Gold Stocks: Are We There Yet?

Below is a chart and commentary from Richard Russell’s Dow Theory Letters dated July 30, 1976.  It is key that those who are interested in precious metal stocks understand the significance of gold stocks to decline precipitously in spite of being in a gold bull market.  This piece punctuates that idea with some possible insight on how to recognize the bottom of a bear market. Continue reading

Dow Theory: The Beginning of a Cyclical and Secular Bull Market?

The world of Dow Theory was abuzz after the Dow Jones Industrial Average and the Dow Jones Transportation Average charged to all-time highs on March 5, 2013 (found here).  At the time, the Dow Jones Industrial Average had finally capitulated to the inexorable forces that had long since propelled the Dow Jones Transportation Average above the 2011 all-time high.  The confirmation of a Dow Theory bull market came when the Dow Jones Industrial Average finally exceeded the all-time high of 14,164 set in October 2007.

The action of the Dow Industrials and Transports has been so compelling that Dow Theorist Richard Russell acquiesced to the strength of the market on March 11, 2013 by saying the following:

“Yes, I know that this market is uncorrected during its long rise from the 2009 low, and I know that there are risks in buying an uncorrected advance that is becoming uncomfortably long in the tooth, but my suggestion is that my subscribers should take a chance (after all, Columbus took a chance) and take a position in the DIAs.”

In the same posting, Russell later punctuates the point by saying:

“I really believe that subscribers should take a flyer on this market. After all, after weeks of flirting with a new high in the Industrial Average, the Dow finally confirmed the previous record high of the Transportation Average. With the Industrials and the Transports both in record high territory, I think being in the market is justified under Dow Theory.”

By all indications, this Dow Theory bull market indication is the real deal, especially when it is endorsed by Russell’s 55 years of experience on the topic.  The implications of this signal are significant for one very important reason, this time we’ve achieved a secular bull market indication (learn about cyclical and secular trends).

Throughout stock market history, cyclical primary bull markets tend to last 2-4 years.  These bull markets require rapt attention to the nuances and vagaries of changes in the trend.  The last indication of a cyclical primary bull market was on July 23, 2009, when the Dow Industrials traded at 9,069.29.  Based on our interpretation of Dow Theory, we received a cyclical primary bear market indication on August 2, 2011 when the Dow Jones Industrial Average was at 11,866.62.

Secular bull markets, on the other hand, require very little attention and have typically lasted between 15 and 18 years.  Secular bull markets are the proverbial sweet spot of investing with the trend, where “buy-and-hold” is the rule. The two most prominent secular bull markets resulted in the Dow Jones Industrial Average increasing by 10-fold or more. From 1942 to 1966, the Dow rose from 100 to 1000 and in the period from 1982 to 2000, the Dow went from 1,000 to 11,722. If the current implications are correct, we could be on the cusp of a run to Dow 100,000.

Volume: The Lone Holdout

The three major components of Dow Theory are the Industrials, Transports and trading volume.  As described above, the Industrials and Transports have achieved the required all-time highs at (or near) the same time which would indicated that we are in a new cyclical AND secular bull market.  However, volume has been the holdout in the current move higher.

In the seminal book on Dow Theory titled The Stock Market Barometer, written by William Peter Hamilton, it says the following about trading volume, “It is worth while to note here that the volume of trading is always larger in a bull market than in a bear market. It expands as prices go up and contracts as they decline.

The average trading volume for the Industrials and Transports has been in a declining trend (contracting) since the 2009 low, as seen in the charts below.

image

image

In order for Dow Theory to have relevance, increasing volume needs to accompany the rise of the stock market to ensure that there is sufficient participation and interest.  Unfortunately, average trading volume, as indicated in the above charts for the respective indexes, has been trending lower since 2009.  This suggests that we could only be in an extended  cyclical bull market, within a secular bear market, rather than at the beginning of a cyclical and secular bull market.  The key to understanding trading volume and its interpretation are found in the table below.

volume price interpretation
decrease decrease positive
decrease increase negative
increase decrease negative
increase increase positive

In the days before volume was tabulated for the individual Dow indexes, the New York Stock Exchange trading volume was the proxy for the market trend in conjunction with the Industrials and Transports.  Below is the  200-day average trading volume of the NYSE since 2001.

image

What is evident is the dramatic rise and peak of average trading volume during the decline of the stock market from the peak in 2007 to the bottom in 2009.  However, once the market started taking off, the trading volume uncharacteristically plunged.  To emphasis the point, below we have included the charts for the cyclical bull markets from 2001-2007 and 2009 to the present.

image

In the chart from 2001, we can see that NYSE average trading volume hit a peak in 2002 and then flat-lined for a couple of years until 2005.   However, as the strength in the stock market grew, the trading volume accelerated to new highs.  This was the hallmark of a true bull market run, rising prices and rising volume.

image

In the chart from 2008, the average trading volume for the NYSE has had a declining trend throughout the whole bull market run from 2009 to the present.  As indicated in the table above, declining volume with increasing prices should be interpreted as a negative.  After volume has been in a declining trend for so long, the only alternative is for a dramatic increase.

When the increase in volume arrives, the question then becomes, will there be a dramatic increase or decrease in stock market price?  Will the general public’s lack of participation be the catalyst that charges the market to move higher?  This situation has to be resolved at some point.

To round out our thoughts on the potential secular bull market signal that we recently received, we thought we would compare it to the last secular bull market change in trend.  In the period from 1966 to 1982, the Dow Industrials never traded significantly above 1,000.  However, that all ended in late 1982 when the stock market broke above 1,000 and never looked back.

Below is a chart of the Industrials, Transports and NYSE trading volume from March 1982 to November 1982:

image

The most important information to be gleaned from this chart is the fact that all three of the essential indicators for Dow Theory were confirming each other at a critical point in time.  They all achieved clear bull market indications by rising in unison.  The current divergence between the Dow indexes with the NYSE trading volume suggests that we will be witness to the greatest transition in the history of the stock market.

The above examination of trading volume, based on a what we believe to be reliable sources, has us concerned that a new secular bull market is not really what we’re witness to.

As William Peter Hamilton has said in The Stock Market Barometer:

“The professional speculator is no more superfluous than the pressure gauge of the steam-heating plant in your cellar. Wall Street is the great financial power house of the country, and it is indispensably necessary to know when the steam pressure is becoming more than the boilers can stand.”

The pressure in the market is building and we may be watching the beginning of the most spectacular stock market blow-off ever.  Just before an even more astonishing decline.

NLO Q&A

Subscriber F.H. asks:

“[Have you] ever consider[ed] constructing a market trend indicator like Richard Russell’s PTI?”

Our Response:

This is a great question and one that we’ve examined in the past.

We are familiar with Russell's Primary Trend Indicator (PTI).  In fact, we know the exact constituents of the indicator.  According to Richard Russell, editor of The Dow Theory Letters since 1958( www.dowtheoryletters.com), the PTI is a “technical spectrum of the stock market” that cannot be manipulated.  Russell goes on to say "...you can fool one or two of these technical items, but you can’t fool all eight of them, and that’s what the PTI is all about."  The goal of the indicator is to provide solid indications of market direction that cannot be manipulated.

As a subscriber to Russell's Dow Theory Letters, you are well aware of the many times that the PTI was right and Russell was wrong about the direction of the stock market. However, we're more concerned with the fact of how much advantage does the PTI provide compared to simply using Dow Theory.

Here is what we’ve found.  According to Dow Theory, on July 23, 2009 a new cyclical bull market began.  At the time we recommended investing in the highest weighted stocks of either the Industrials or Transports index or the purchase of ETFs for the Industrials (DIA) or Transports (IYT) (article found here).

On the other hand, the Primary Trend Indicator (PTI) gave the first hint that we were in a cyclical bull market on August 25, 2009.  In addition, the PTI didn’t give the “all clear”, in terms of being in a bull market, until November 30, 2009 (as seen in chart below).  In fact, a good technical analyst would have had tremendous difficulty in getting a clear indication based on the PTI until after the December 8, 2009 rebound.

image

There is an alternative view on interpreting an earlier signal than the Dow Theory indication using the PTI.  However, you would need to apply Dow’s theory in order to properly achieve the earlier signal based on the PTI movement.  Using the purple line above, an individual could have interpreted that a cyclical bull market tentatively started as early as May 4, 2009, when the PTI exceeded the January 2009 peak.  Subsequent to the May 4th peak, the PTI did not decline below the 89-day moving average on May 27, 2009, suggesting that more upside existed.

However, when we refer back to Russell’s June 3, 2009 issue there is no indication that a tentative new bull market was in play.  No mention that May 4, 2009 or May 27, 2009 were possible indications of a new bull market in stocks.  In fact, Russell commented that “…ridiculous but unseen green shoots is now repeated everywhere. I’ve stated that a true bear market bottom usually requires many weeks or even months before the crowd turns bullish.”  This comment along with the picture of a bear at the top of his newsletter was the only indication that we had that we were still in a bear market, according to Richard Russell.

Because we have studied the PTI in detail, we've determined that it is not worth including in our work.  In fact, we’ve found that it is more noise on the market when compared to correct, albeit conservative, interpretation of Dow Theory.  If we get Dow Theory right, then we don’t need another indicator to follow that could potentially confuse our primary indications based on Dow’s work.  Yes, we will take in as many views as possible, however, we will rely on Dow Theory as the primary indicator for market direction.

Finally, to create an indicator that is supposed to be impervious to manipulation while at the same time practicing Dow Theory is doubling the effort necessary in watching the movements of the market.  We’ve outlined in extensive detail the role that manipulation plays in the stock market and how the interpretation of Dow Theory mitigates the most extensive manipulation possible (found here).

Subscriber F.H. Asks:

In regards to our recent posting of the 2012 Portfolio Performance Review F.H. asks, “…I am wondering if the methodology will allow this streak to continue. the process, as I understand it, is to buy stocks at their lows, hold them for a significant gain, and then sell a portion of the position but retain some % of original principal in the investment. won’t the portfolio eventually have such a large percentage of these residual holdings that the incremental effect on returns from the new positions will be overwhelmed?”

Our Response:

In theory, the primary drawback would be that we’ll be working with the same amount of cash over an extended period of time whenever we sell the principal.  However, we’re comfortable with continually adding new cash to the portfolio so that we are not faced with the very real potential of our residual holdings dwarfing our capital base.

Our strategy is the literal application of a concept that is outlined in the book Rocking Wall Street by Gary Marks.  In an interview on June 2, 2007 with Financial Sense Newshour host Jim Puplava (found here), Marks gives insight as to the reasons why an investor might want to employ the strategy that we’ve outlined with selling the principal and letting the profits run.  The interview is so good that we’ve indexed the various topics covered in the interview below.

minutes topic
3:57-4:57 Art and Craft of Investing
6:48-8:25 Investing is About Less Risk Over Time
16.03-17:13 Emotional Risk causes Gambling Modality
17:15-19:28 Myth of Tax Savings from Buy and Hold
19:29-21:39 Myth of Buy and Hold
25:32-28:10 Risk to Real Estate
28:11-31:57 Cash as a Hedge
38:58-42:05 portfolio construction & life balance

The discussion of the “Art and Craft of Investing,” as described by Marks, is exactly what we’re practicing and what we believe will give any investor the benefits that are claimed that the stock market can offer.  Our approach is in stark contrast to the belief that if you practice Dow Theory you must go all in when the signal is bullish and sell everything when the signal is bearish,  but at the same time you’re supposed to compound your way to investment wealth.

We agree with 95% of the strategies described by Marks in the Financial Sense interview.  After weighing the merits of various investing approaches, we’ve tried to responsibly provide methods for investing while limiting the risk of excessive loss.

Dow Theory Update

We may be on the cusp of a Dow Theory cyclical and secular bull market signal.  However, where the rubber hits the road when it comes to Dow Theory is discretion and confirmation.  Discretion is needed for the purpose of avoiding frequent and erroneous calls. Confirmation is needed to ensure the quality of the analysis. We’re hoping that the chart below clarifies what investors need to know about the recent stock market activity.

Continue reading

Richard Russell’s Latest Miscue

The New Low team has been huge fans of Richard Russell for years. We've learn much about Russell's thinking process as well as his stock market strategy in his work from 1958 to the present. However, his most recent contribution appears to be counter to the whole point of Dow Theory. The following excerpt appears on Financial Sense as well as Dow Theory Letters.

What's the best performing stock of the last few years? Would you believe it -- it's a leading seller of bolts, screws and nuts. (Their products are known as threaded fasteners in the trade.) The name of the hot company is Fastenal.

The stock has been trading for 25 years. The stock has as gone from 13 cents on October 19, 1987 to a recent $50.85. Over the past year Fastenal has gained 60%.

The company stocks thousands of varieties of bolts, nuts, screws and cotter pins in 2,600 stores and serves retail and wholesale customers. For many companies, Fastenal's products are absolutely essential. Whole factories can shut down for lack of one of Fastenal's specially threaded bolts. Fastenal has no serious competition. It would be too difficult to compete with Fastenal's thousands of products for spot delivery. In other words, while Fastenal's products are mundane, many companies can't live without them. If maybe five of a certain bolt is needed, price is absolutely no object. The particular bolt may cost a dollar a piece, but if Fastenal can supply the bolt immediately, the price doesn't mean a thing.

Fastenal had 45 stores in 1987, which was the year its owner decided to take Fastenal public. The company offered 100,000 of the million shares to its employees. Up to date, the price of Fastenal has risen 38,565% and today the company has a market value of $15 billion. It has stores in all 50 states and has also moved into Mexico, Canada, Asia and Europe.

Lesson -- Deal in products that everyone needs. Supply those products in varieties that are beyond the capabilities of any other purveyor. Then offer your products for immediate delivery.

Followers of Dow Theory should know that investment values is the cornerstone of the theory.  This means that even if you don't know anything stock market technicals, buying stocks that are undervalued should be the primary focus.

Unfortunately, it seems that Mr. Russell will revert to the values of Dow Theory when it fits his "mood."  Russell suggests that the market is overvalued based on the dividend yield on the Dow Jones Industrial Average being below 3%.  Why then would he write about Fastenal (FAST) which is at an all-time high and trading at P/E of 43 with a book value of 4.94x?  Additionally, Value Line Investment Survey has estimated that FAST has a fair value at 22x cash flow. Given their 2012 estimate of $1.65 of cash flow per share, we can conservatively say this company is worth $36.

For the sake of reference, we've highlighted Fastenal (FAST) in an April 24, 2010 article titled "Low Yielding Stocks Offer Exceptional Gains".  At the heart of our article was to demonstrate that many stocks with low dividend yields can perform equally as well, if not better, than stocks with high dividend yields given the right conditions (i.e. payout ratio, historical yield range).

Sure this stock could turn out to be the next "Apple" but as an influential Dow Theorist, Russell shouldn't be preaching the merits of a company that is as over-valued as FAST.

Also, we'd like to critique Richard Russell's "lesson." The lesson rings hollow since it suggests investment in "wide moat" companies but doesn't offer up any reasonable alternatives.  This implies that investors acquire shares of FAST at the current price solely based on their "moat" while overlooking the fact that the company is not undervalued.  This is quite alarming since there is a broad range of companies which appears on our latest watch list.

Reference Sources:
What’s the Best Performing Stock of the Last Few Years?
Fastenal Key Statistic as of 3/20/2012
Low Yielding Stocks Offer Exceptional Gains
Dividend Watch List: March 16, 2012

Dow Theory Update

It appears that Dow Theory is not understood, by even the best in the industry.  In an article titled “The Meaning of the Transports’ Weakness,” Mark Hulbert surveyed some of the industry’s best Dow Theorists for a clue as to what the market was expected to do next. What stands out in this article is the following remark:

“Frustratingly, not all Dow Theorists agree on an answer. In fact, two of the three monitored by the Hulbert Financial Digest — Jack Schannep of TheDowtheory.com and Richard Moroney of Dow Theory Forecasts — think the appropriate point of comparison is not last summer but late October. And because, near the end of December, the Dow averages rose above their late-October highs, both Schannep and Moroney believe that the Dow Theory is solidly in the bullish camp — notwithstanding where the Dow transports might be relative to their July high.”

Within this commentary is a revealing explanation as to the reason why we believe that Schannep and Moroney got it wrong, thereby issuing a bear market indication in August 2011 and a bull market indication in late December 2011.  In order to understand this, we must first point out a diagram of how Dow Theory reversals typically occur.

Plotting of Primary Reversal

Courtesy of Richard Russell’s Dow Theory Letters (www.dowtheoryletters.com), Figure 1a and Figure 1b show how the Industrials and Transports need to retest prior lows established at point A.  This retesting of the prior low would come after a medium-term rise at point B.  Once the market rests the prior low, the market would then need to exceed the medium-term high of point B.

With the diagram above, we can now see how Schannep and Moroney could have considered that a new bull market was in the making.  Once the market exceeded what they believed to be the POINT B in figure 1a and 1b, it then appeared to be a new bull market.  Unfortunately, while the Dow Industrials appeared to follow the script in Figure 1a, the Transports were far behind in providing a similar pattern of retesting the previous low.  This error led to an incorrect assessment of a new bull market.

Interestingly, Schannep and Moroney were inaccurate even in their call of a “bull market” using Dow Theory.  Based on the diagrams of figure 1, a new bull market should have been indicated in early October instead of late December.  In the chart below, it should be noted that the false bull market indication in October had much more to gain than the late December indication.  Worse still, only a month later, in February 2012, the Dow Transportation Average starts to diverge from the path of the Dow Jones Industrial Average.

2012 03 06 Dow Theory

The current divergence between the Industrials and Transports is a confirmation of the bear market trend.  Additionally, we expected that the Industrials and Transports are going to re-test the lows of 2011.  However, our suspicion is that both the Transports and Industrials will sink below the 2011 lows and possibly go strait to the 9,700 level on the Industrials.  The prospect remains that the bear market could potentially end if the Transports retest the lows of 2011 without falling significantly below.

As early as October 15, 2011 (article here), we indicated that the “…coming market volatility will provide great opportunities for traders and allow investors a chance to cash out of otherwise undesirable positions and take profits. Our expectation is that the Dow will go to the July 2011 highs before struggling at the May 2011 highs. Again, we’re still in a cyclical bear market until the Transports and Industrials exceed their respective 2011 highs.

We hope that our readers have benefitted from our advice to unload undesirable positions.

Best regards.

Thoughts on Gold

A reader says:
“There's a reason Gold is the hottest in the world.Investors are simply losing faith in ALL fiat currencies. Hence, they areturning to one thing that has always been real money - GOLD!”
Our Take:
We don’t know about the far distant future of gold,governments and profligate spending. However, we've always enjoyed a historical perspective on the topic of “realmoney.”  We’ve pulled a few quotes fromRichard Russell’s Dow Theory Letterson the topic of “real money” in the same vein as described above.
The US is on a treadmill to disaster via the creation ofdebt. In time (and the time is moving very rapidly now) the debt will destroyalmost ALL forms of investments. Gold will withstand the destruction, becausereal money is never destroyed.” 
Dow TheoryLetters.  Issue 736. August 7, 1978. Page5.
Coming up in a month, a year, a few years (I can’t time it)is the BIG PROBLEM, the problem that I’ve warned about for a long time. How doyou get people to hold paper “money” when they have increasing doubts about itsworth? The answer: you must make it CONVERTIBLE into real money-gold.”
Dow TheoryLetters.  Issue 766. September 26, 1979. Page1.
My job now seems to be to try to save my subscribers fromthe deceitfulness and greediness of our own Government. So I talk about thetechnical position of gold, of where WC are, of whether gold is still a buy andwhether it will take 900 or 1000 paper dollars to buy an ounce of real moneysay six months or maybe even three months from now." 
Dow Theory Letters.  Issue 774. January 16, 1980. Page 7.
‘How can the Government ever be bankrupt if it is able to createmoney?’ The answer is that the Government could only be bankrupt if no onewould accept that money. And of course, that possibility is the reason why manysurvivalists will ‘never be without some kind of a position in real money -gold.’” 
Dow Theory Letters. Issue 805.March 25, 1981. Page 3.
Why could gold be bullish? Two opposing reasons: first,with a potential crisis in the world monetary system, people turn to real moneyas an insurance policy. Gold is real money. Second. With unbearable deficits facingthe US over coming years, politicians will be tempted to ‘print’ (monetize)some of those deficits (and suppose Edward Kennedy gets in in ‘84).
Dow TheoryLetters. Issue 841. August 11, 1982. Page 6.
Now, we’re not suggesting that the ultimate consequence ofprofligate spending isn’t coming.  Additionally,we’ve made a call for a secular bull market (as opposed to a cyclical bullmarket) in gold on September28, 2010 and silver on September5, 2009 .  However, much of thearguments during and after the peak in the price of gold are the same as today. 
Additionally, nothing has changed that was said about profligatespending at the peak in the price of gold in 1980 or the period from 1981 to1999, a time when the price of gold was in a declining trend.  Therefore, we have little to help us distinguish the difference between huge government spending when gold is rising and when gold is falling.  We're sticking to the view that Dewey and Dakins' assertion that gold vacillates in a 50 to 54-year cycle is right on target (our 2009 review of their work here). 


We’re opting for the view that goldexperiences good times and bad rather than the view that our nation is comingto an end.  After all, the redemption ofour gold, as with all forms of insurance, is not something that we look forwardto.

4-Year Cycle Update

On June14, 2010, we wrote an article titled “AMarket Cycle Worth Observing.”  Inthat article, we proposed that there was significant validity in the beliefthat the stock market ebbs and flows in a 4 to 4 ½ year cycle.
In aneffort to make our point, we provided examples from Charles H. Dow, co-founderof the Wall Street Journal, and Richard Russell editor of the Dow Theory  Letters (www.dowtheoryletters.com).  The examples were drawn from the late 19thand 20th century.  The purposeof connecting such disparate periods was to show that regardless of the changein times, some attributes of the stock market remain intact.
In ourclosing paragraph on the 4-year cycle we said the following:
“If my observations on thistopic are correct, then we have at least until January 2011 to June 2011 beforethe half cycle is complete. Afterwards, the market would either trade in arange or establish a well-defined bottom in accordance with the 4 to 4 ½ yearmarket cycle.”
Ourarticle of June 14, 2010 came after an -11% decline in the Dow Jones IndustrialAverage.  Subsequent market action led tothe Dow Jones Industrial Average rising +25.71%.  Coincidentally, the Dow Industrials peaked onApril 29, 2011 at 12,810.54 with two failed attempts at reaching new highs inJuly 2011.
Because we’rewithin 9 months of the second half of the 4-year cycle, we believe that thereis approximately another year to go of the stock market continuing to trade ina range or reaching an ultimate low.  
For themarket to trade in a range we expect that the Dow Jones Industrial Average doesnot exceed the high of 12.810.54 by more than 10% while not falling below10,655.30.  If both the Dow Industrialsand Dow Transports exceed their respective highs we would view such action as anew cyclical bull market.  Our downsidetarget for an ultimate low on the Dow Jones Industrial Average is tentativelyset at 8,540.36.
Althoughgiving our prognostication one year in advance (as indicated in an April 2010posting below), we were off by only one month for the last peak in the market. Furthermore, the evidence suggests that the 4-year cycle is still inplay.  We feel that an appropriateinvesting strategy can be constructed around this concept.  If investing in stocks is a must, then we’drecommend considering the relatively undervalued current and former dividendincreasing stocks from our latest dividend list below.
Symbol
Name
Price
P/E
EPS
% Yield
Price/Book
% from Low
Tootsie Roll
23.77
32.82
0.72
1.40
2.03
4.12%
C.R. Bard, Inc.
85.81
22.05
3.89
0.90
3.96
6.14%
Becton, Dickinson
74.24
13.22
5.62
2.50
3.26
6.70%
John Wiley & Sons
44.77
15.7
2.85
1.80
2.66
6.88%
California Water Service
17.83
18.29
0.98
3.40
1.64
7.09%
Owens & Minor
27.8
15.61
1.78
2.90
1.93
7.46%
Clorox Company
67.76
19.54
3.47
3.60
-116.98
8.64%
West Pharmaceutical
38.55
21.28
1.81
1.90
1.85
8.73%
Frisch's Restaurants
20.27
22.93
0.88
3.30
0.8
9.92%

A Strategy is Needed for Lagging Gold Stocks

For gold stock investors, a timing strategy is the most effective way to match or beat the coming metal price increase. Among our caveats, we’re excluding junior and exploration mining companies which will either go out of business, experience share price booms or get acquired by peers or the majors. What follows is our examination of whether the lagging gold stocks, the inability of gold stocks to perform equal to or greater than the price of physical metal, is unique to our time or a fundamental hallmark of gold bull markets.

There is considerable discussion about the divergence between the price of gold and gold stocks. In the divergence, the price of gold has tended to rise to new highs while gold stocks (majors) either trade in a range, decline or increase at a tepid rate compared to the physical metal.

Some argue that due to the divergence, gold stocks represent the best investment opportunity because inevitably, the stocks will catch up with the metal. Others say that, the lack of confirmation of gold stocks to exceed prior highs is an indication that the metal is overvalued or needs to decline.

Unfortunately, although both points seem well reasoned (along with many other explanations), evidence from the previous gold bull market suggests that gold mining majors typically underperform the metal. The primary source that we’re drawing from is Richard Russell’s Dow Theory Letters from 1970 to 1979 with data points confirmed in Barron’s and Kitco.com for the respective dates.

On numerous occasions, Richard Russell would express his concern for the divergence between the price of gold and gold stocks. Below are Russell’s observations of the failure of gold stocks to follow the price of gold higher:

Meanwhile, despite the recent highs in the price of gold bullion, the gold stocks are not keeping up with the price of the yellow metal. I have received many calls from subscribers asking why.” (Richard Russell, Dow Theory Letters, May 17, 1972, Letter 529, page 6.)

The general feeling seems to be that the gold stocks have been discounting [falling in advance of] a decline in bullion.” (Richard Russell, Dow Theory Letters, September 27, 1974, Letter 610, page 6.)

“‘What’s happening to the shares’ I am asked. ‘Why don’t they move with gold?’” (Richard Russell, Dow Theory Letters, January 2, 1975, Letter 618, page 5.

At the bottom of the chart is the Barron’s Gold Average (stocks). This may move, too, but this Average has a long way to go to hit its 1974 high while gold could better the old 200 high easily. That should tell us something. And it’s the reason I’ve been saying all along-gold, not gold stocks.” (Richard Russell, Dow Theory Letters, November 9, 1977, Letter 713, page 5.)

Since Barron’s Average is very heavily weighted in favor of ASA, we are looking to a large extent at the relative performance of the S. African gold shares against bullion. The picture is clear enough. The market, since mid-1974. has preferred bullion to the gold shares. And who am I to argue with the market? That’s the reason I’ve been recommending gold, not the shares.” (Richard Russell, Dow Theory Letters, February 17, 1978, Letter 722, page 6.)

Since late-January the gold stocks have been reactionary whereas gold has been hitting new 1977-78 highs. In March both stocks and the metal declined, and as you can see the stocks broke below their February lows. Yet the metal has not confirmed on the downside, holding well above its February low. I take this non-confirmation as a bullish indication. I think it is telling us that the metal will not respond to gold share weakness, and it is telling us that the metal ‘wants’ to go to new highs. Whether the stocks will follow is another story.” (Richard Russell, Dow Theory Letters, April 5, 1978, Letter 726, page 6.)

My chart of gold and the gold averages (see page 6) is now showing a dramatic divergence. The gold stock average has broke” below its November low, but the bullion price has held well above that point.” (Richard Russell, Dow Theory Letters, May 5, 1978, Letter 729, page 5.)

This non-confirmation between gold and the gold stock average which I discussed in the last Letter is still in force. Many feared that the reactionary tendencies [decline] in the gold shares were calling for a correction in gold. For this reason many advisors have been telling their clients to sell their gold or even short gold. The consequences have been unhappy for the sellers, disastrous for the shorts.” (Richard Russell, Dow Theory Letters, November 1, 1978, Letter 742, page 5.)

My chart of gold bullion (daily) and the Gold Stock Average (GSA) documents the extraordinary divergence which continues to build between gold and GSA. Why did gold and GSA rally in tandem up to the October highs and why are the gold shares so

reluctant now?” (Richard Russell, Dow Theory Letters, February 28, 1979, Letter 751, page 7.

My chart of daily gold and the gold stock average (GSA) continues to picture divergence, with Campbell Red Lake and ASA stubbornly refusing to move back to their October highs.” (Richard Russell, Dow Theory Letters, July 5, 1979, Letter 760, page 6.)

I obviously cannot tell at this time whether gold is going to surge above 307 to a new high- or whether gold is in the process of topping out. The gold stocks have been weak, and my gold stock average has broken below the three minor bottoms. But so far, even weakness in the gold shares has not rubbed off on the metal.” (Richard Russell, Dow Theory Letters, August 15, 1979, Letter 763, page 6.)

To add to the consternation of gold stock investors, the period after the peak in the price of gold in January 1980 showed gold stocks held up better than the metal. This threw off “seasoned” gold investors because it gave the false impression that gold’s collapse would recover somehow. The following is Russell’s comments on this matter after the peak:

The gold stocks did not act during the 1980 decline the way they did during the 1974 debacle. This time they tended to hold very well. Now they are looking bullish (despite the many troubles, the increasing troubles in So. Africa). The shares, in other words, show good relative strength against the metal. This is a good sign for gold in general.” (Richard Russell, Dow Theory Letters, June 4, 1980, Letter 784, page 5.)

Although gold stocks are a leveraged play on the price of gold, there are critical points in time when gold stocks should be bought and then sold in order to take advantage of the leveraged characteristics. Those who buy and hold gold stocks for the “long term” will be disappointed with the performance as compared to the price of gold. Therefore, it is necessary to have a timing indicator that will highlight the best times to invest in gold stocks.

Below we have constructed a gold stock indicator based on the Philadelphia Gold and Silver Stock Index (XAU) which reveals the best times to accumulate and dispose of gold stocks. The points above the red line indicates the time to sell gold stocks and the points below the green line indicate when to buy gold stocks. We’ve taken the liberty of considering a sell indication whenever the indicator first reaches the red zone on a move to the upside and a buy/accumulate when the indicator first falls to the green line on a move to the downside.
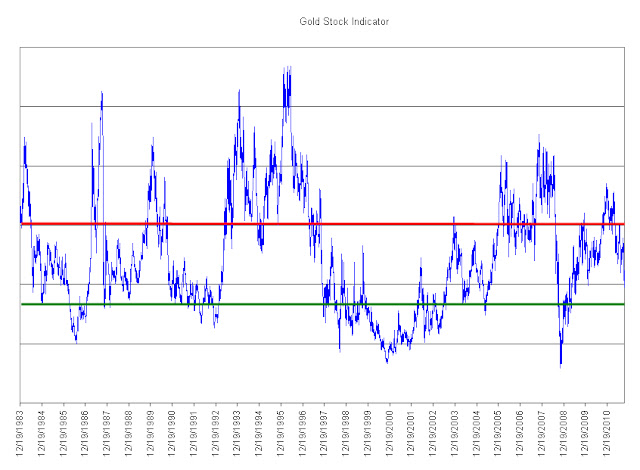
On average, sell indications occurred after a +52% increase in the XAU index. This does not account for the individual performance of gold stocks that are constituents of the index. The consistency of our Gold Stock Indicator reflected the best times to acquire the major gold stocks as well as the most ideal times to sell the gold stocks.
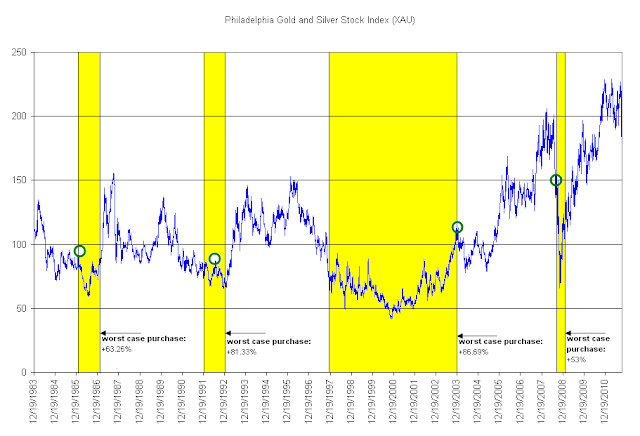
On the chart of the Philadelphia Gold and Silver Stock Index (XAU) above, we have shown where the indicated “buy/accumulate” recommendations would have taken place in yellow. The green circles show what would have happened if the purchase occurred at the worst possible time in the given period and is measured to the respective peaks in the XAU index soon after. As mentioned in many prior articles, we always account for at least -50% downside risk with any investment position that we take. This appears to be a minimum requirement when applying our indicator to the purchase of constituents of the Philadelphia Gold and Silver Stock Index (XAU).

For an investor who wishes to accumulate gold shares from within the XAU index, they would benefit from well timed purchases rather than getting whip-sawed by a wildly gyrating index that will inevitably underperform the price of gold in the “long-term.” We have identified the top five stocks that are likely to outperform the XAU index when the next buy signal is given. The five companies are AngloGold (AU), Yamana Gold (AUY), Gold Fields (GFI), Randgold (GOLD) and Royal Gold (RGLD).

The obvious alternative to buying gold stocks is with the physical asset. The paper version of gold is the SPDR Gold Shares (GLD). Although not truly tested through a full gold bull and bear cycle, GLD remains the among the most popular ways to “invest” in the physical asset. Our preference is for the non-paperized version of gold in the form of one-ounce coins.

As has been demonstrated in the gold bull market from 1970 to 1980, gold stocks (the majors) will generally underperform the price of gold. Those who are bound and determined to buy gold stocks can pursue the juniors and explorers which provide a wide range of outcomes that are independent of the price of gold (but helped by the rising value of gold) based on new discoveries, getting acquired or going bust. The alternative, buying the majors, should be done with a well constructed strategy that does not rely on hold-and-hope.

Richard Russell Review: Wrong About the Industrial Production Index

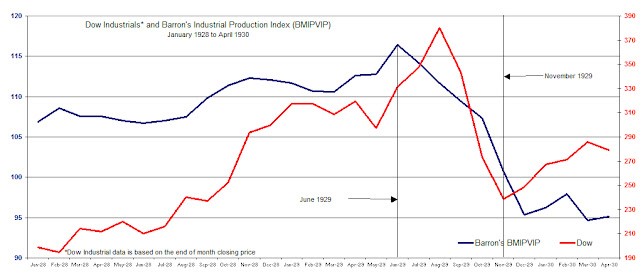
On June 6th, Richard Russell wrote an article on the Financial Sense website titled “Are We Fated to Live 1929-1930 All Over Again?” In that article, Russell discussed the Barron’s Monthly Index of Physical Volume of Industrial Production [BMIPVIP] reflecting on the movements of the index as compared to the Dow Jones Industrial Average in the period from the peak of the stock market in 1929 to the bottom in 1932.

Richard Russell pointed out that from November 1929 Barron’s Monthly Index of Physical Volume of Industrial Production [BMIPVIP] gave ample warning that the direction of the U.S. economy was still headed lower despite the rebound of the Dow Jones Industrial Average from November 1929 to April 1930 as depicted in the chart below.

Source: Persons, Warren. Barron's. May 15, 1933; pg. 18
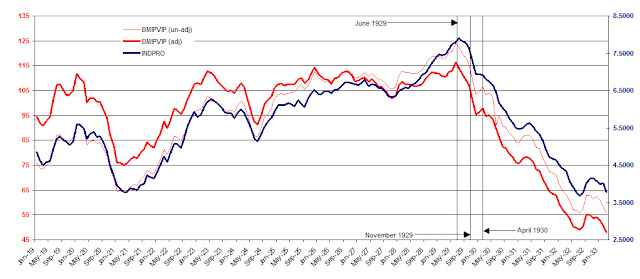
Because the BMIPVIP was discontinued in 1938, we’ve used the closest approximation which is the Federal Reserve’s Industrial Production Index (INDPRO) found at the St. Louis Federal Reserve website.  In order to make a comparison to the two indexes, we checked the performance of the INDPRO to the BMIPVIP.  Below is the chart of the Barron’s adjusted and unadjusted BMIPVIP index and the Federal Reserve’s INDPRO from 1919 to 1933.

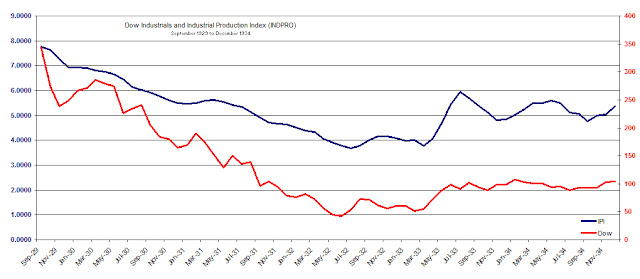
 It can clearly be seen that the Federal Reserve’s index (INDPRO), which is still in use today, can be used to measure against the Dow Jones Industrial Average.  Whenever the Barron’s index zigged the Fed’s index zigged, whenever the Barron’s index zagged so too did the Fed’s index.  We believe that using the Fed’s Industrial Production Index is the best and most consistent approximation to compare to 1929 to 1934 (shown below) as well as today’s market.

source: Person, Warren. Barron's. May 15, 1933. pg. 18.


According to Russell, the BMIPVIP hit its high in the month of June 1929.  This was a full 3 months before the peak in the Dow Industrials in September 1929.  The Federal Reserve index actually peak in July 1929 however, this was still ample enough time to gain inferences from the index’s movement.

Russell correctly observed that the BMIPVIP was critical in the evaluation of whether or not the economy and the stock market were on a rebound.  The great Dow Theorist Robert Rhea first introduced the use of Barron’s Industrial Production Index in his book Dow’s Theory Applied to Business and Banking.  Rhea used BMIPVIP as a means to confirm the signal provided by Dow Theory which contributed to his accurate call of a market bottom in July 1932.

Richard Russell’s point was that even though the stock market rallied strongly after the initial crash from the September 1929 high to the November 1929 low, the subsequent rebound was unsustainable when viewed from the perspective of the BMIPVIP or the INDPRO.  Unfortunately for Russell, his analysis of the BMIPVIP index and the Dow Jones Industrial Average comes to the wrong conclusion when attempting to bring actions of the past to market activity of the present.

Russell closes his article with the following thoughts:

“After April 1930, the post-crash rally ended, and a great bear market began. As the market turned down again, the US economy crumbled. By July 1930, Barron's Index of Industrial Activity had fallen to 85.5. The Great Depression was on.

“And I'm wondering about the comparison with today's action. Recently, we've seen the Dow climbing steadily from its March 2009 low, all the while with the economy neutral to weak. Then we see the Dow hitting a high last month in May with business today sluggish and even weaker than it was in January.

“And I'm wondering, ‘Are we fated to live 1929-1930 all over again?’ Is the stock market rally of March 2009 to May 2011 a repeat of the stock market rally of November 1929 to April 1930? In both instances, business weakened as the market climbed higher.

“But the scary part is that in 1930 when the Dow broke support, the Great Depression began and Barron's Business Index continued to plunge. Let's keep an eye on the March 2011 lows -- Dow......11613.30 and Transports ....4950.17.”

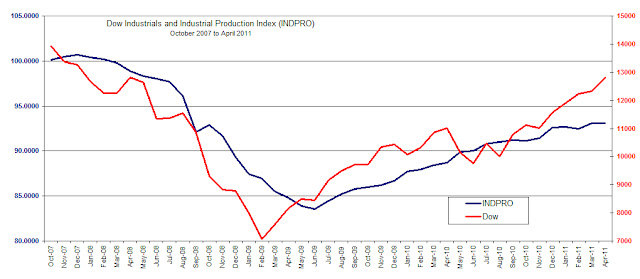
We’re disappointed that Russell’s remarks are uninformed and misleading with the intent of creating fear. First, Russell withholds the data necessary to test whether his assessment is accurate. Next, Russell implies that the Dow Industrials of today may be rising in spite of the Industrial Production Index falling. However, the Fed’s INDPRO has been in perfect alignment with the rise of the Industrial Average since 2007 as shown in the chart below.

Finally, Russell closes his article with an attempt at drawing the events of the past to the present.  Russell's effort lacks all substance when he speaks of targets for the Dow Industrials to watch for but doesn't introduce the Industrial Production Index nor it's relationship to 1929 and today. 

While the true test may come when the Dow Industrials and Industrial Production Index (INDPRO) attempt to exceed the prior high of 2007, there is little indication that Russell’s assessment is correct.

Please consider donating to the New Low Observer. Thank you.

Price Decline Equals Dividends Canceled

The question of retaining profits on quality dividend companies through the selling of a position seems to counter the whole point of dividend investing. After all, aren’t you supposed to allow the dividends to compound? In a small way, we described one approach and our rational for selling quality companies after small gains in yesterday’s article (Our Primary Concern: Retaining Profits).

However, there is another way to view the rationale behind selling a dividend stock after a “fair profit.”  In the early years of the Dow Theory Letters, Richard Russell would often cite a Robert Rhea quote about the impact of a stock decline.  Rhea said: 

“’Buying in bear markets is merely gambling and not very good gambling at that. Why not have cash instead of investments in bear markets? Why insist that one cannot afford to forego investment income when one day’s price shrinkage may cancel several years’ dividends?’”
Russell, Richard. Dow Theory Letter. May 10, 1960. Issue 103. page 2. www.dowtheoryletters.com.
The idea of canceling several years of dividends is at the forefront of our thinking when gains evaporate into losses.  In Richard Russell’s Dow Theory Letter dated November 23, 1960, he presents, in literal terms, the impact of price decline and the loss of years of dividend income in the process.  The table below is from Russell’s newsletter and needs little in the way of explanation.
Source: Richard Russell, Dow Theory Letters, http://www.dowtheoryletters.com/

Because stocks are not required to return principal with a stated yield as with many bonds, there is no assurance that the price will recover to the level that a purchase was initiated. Therefore, receiving short-term income on a dividend stock, although a necessary source of income for retired individuals, the prospect exists that an investor could end up with only a portion of the principal instead of the intended income plus principal.

The lack of assurance of principal and income with dividend stocks is why we believe people have become disenfranchised with technology stocks like Microsoft (MSFT) and Cisco Systems (CSCO).  If they’ve invested in the stocks with the belief that they’re in it forever, when the decline comes, absent any dividend, there is little recourse or hope of recovering lost funds or keeping up with inflation.

Even new investors to Microsoft and Cisco Systems, aware of their bold promises in 1999 and subsequent failure to deliver in 2011, are asking themselves, “is it really worth facing the prospect of no return?”  These questions are being asked when in some instances, especially with Microsoft, the timing probably couldn’t be better (especially now that they’re paying a dividend).  Our supplementary comments on Microsoft can be found here.

While we subscribe to the Graham/Buffett principles of investing (buying for the long-term, you’re buying a business, concentrate on values, etc.) we assume that since there are only a handful of billionaires hewn strictly from investing in stocks, we might do well to hedge our thinking and strategy.

Finally, further analysis of Robert Rhea’s claim on not being invested at all during bear markets is something that is at odds with Charles Dow and we’ve decided is not appropriate or necessary.  From our experience, bear markets are no guarantee of losses in your portfolio.  Charles H. Dow, founder of the Wall Street Journal, has said that:

"Even in a bear market, this method of trading will usually be found safe, although the profits taken should be less because of the liability of weak spots breaking out and checking the general rise."

Schultz, Harry D., A Treasury of Wall Street Wisdom, Investors' Press, (New Jersey, 1966). p. 12. Additional commentary here.

Evidence of the fact that bear markets don’t always equal destruction of wealth, while going long stocks, is demonstrated in our 2007, 2008 and 2009 performance review.  Naturally, 2008 is not expected to be replicated (having gains, while going long only, during a market decline of 40% or more).  However, we do know that being all in or timing the market to be all out during bear markets shouldn’t be the goal.  The goal, from our perspective, should be the preservation of gains whenever possible.

Please revisit New Low Observer for edits and revisions to this post.