Category Archives: Edson Gould

iShares Silver Trust (SLV) Debrief

On April 14, 2011, we provided what we believed to be the downside target for the Philadelphia Gold and Silver Index (XAU) in anticipation of the current decline that is taking place using Edson Gould’s speed resistance lines (article here).  Although appearing to be very similar, there is a distinct difference between Gould’s resistance lines and Charles Dow’s 1/3 support levels.  Gould’s lines have support levels based on 1/3 of high while Dow’s support levels are based on 1/3 the difference between the prior bottom and the most recent high.


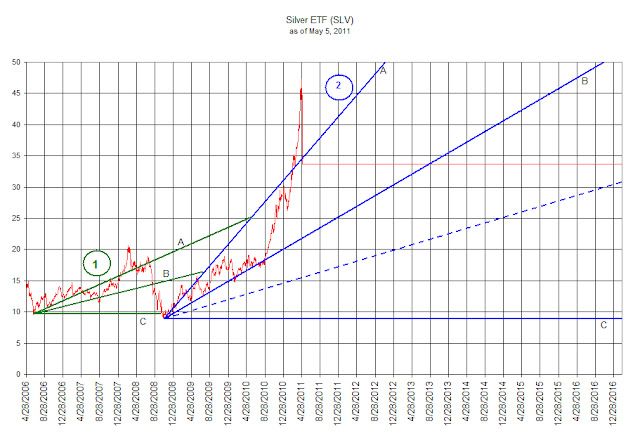
In this review we’re going to tackle the trading pattern of the very controversial iShares Silver Trust (SLV). In the chart below we have drawn the Dow Theory support levels where the price of iShares Silver Trust (SLV) is likely to revert to as part of a normal reaction.  As a point of clarification, according to Dow Theory, a bear market does not begin until the index or stock falls by at least 1/3 of the prior rise.  In the case of (SLV), today’s closing price at $33.72 heralds what is sufficiently below the first support $34.52 and should be considered to be a bear market. 


Although this could be considered a bear market based on Dow Theory, we only need to look back to 2008 to know how quickly and viciously a bear market in precious metals can begin and end.  The precious metals bear market of 2008 crushed the XAU gold and silver stock index with a 68% decline in eight months.  During the same time, the iShares Silver Trust (SLV) declined slightly more that 55%.  


Bear market or not, some observations are worth considering.  First, in the chart below, the overall pattern of the price decline in (SLV) for the Dow Theory indication numbered 1 (in green) is very similar to the current decline represented with the Dow Theory indication numbered 2 (in blue).  Since Dow Theory works on a relative basis, once initiated at a major low, the signals provided are not confused through the distortions of large or small numbers.  Headlines about SLV having declines of historic proportions are grossly exaggerated if there is no comparison on a percentage basis and compared to prior declines.

Second, at the beginning of each run at point 1 and 2, the price of SLV bounced off of the middle line B (also known as the 2/3 support line) before going parabolic. 

Finally, the decline from each peak was rapid and vicious.  One-third of the prior rise was wiped out in a matter of days after the peak.


What remains is a high level of uncertainty for (SLV) going forward.  However, in general, we should see SLV tread water for a brief period of time before falling back to the prior low which began with the current run back in November 2008.   Dow Theory suggests that a reasonable buying opportunity would exist at below line B (blue line B).  However, we wouldn’t jump in at the slightest move below line B.  Instead, we’d like to see the price decline to the dashed blue line at $15.41 or below.

Projecting Downside Targets for Gold and Silver Stocks

In our prior work on the topic of gold and silver, we indicated that the precious metals market had entered into a secular bull market. Our confidence in that thesis was based on the works of Edward Dewey and Edwin Dakins 1947 book titled Cycle: The Science of Prediction. In that book, Dewey and Dakins illustrated the cycles for inflation which indicated that a peak in inflation would occur in 1979 and a trough of inflation would occur around 2006. While the 1979 peak was accurate the 2006 bottom was off by a few years. However, we feel confident that being off by a few years within the context of a 50-year cycle allows for some margin of error.


As investors, the NLO team is primarily concerned with the downside risk and major downside targets. For the gold and silver market, we will use the Philadelphia Gold and Silver Stock Index (XAU) to determine where the next low might occur.


To project the downside target for the XAU, we will use speed resistance lines as pioneered by Edson Gould. William X. Scheinman wrote a piece in Barron’s titled “600 on the Dow” on February 9, 1970 that outlined exactly how Gould’s resistance lines work.


The forecast by Scheinman of a closing low for the Dow at 600 was off by 2.57% when the index closed at 584.56 on October 4, 1974. [As a sidebar, Dow Theory gave a bull market indication in January 1975 that would have investors fully invested.] Although being off by such a small amount, Scheinman also said that the low would occur approximately a year from the date that the article was written. We believe that the tactical error on the part of Scheinman was to expect that the decline would be based strictly on a set time frame rather than based on the level of the resistance line. The chart below is the original piece that was generate by Scheinman from 1970.


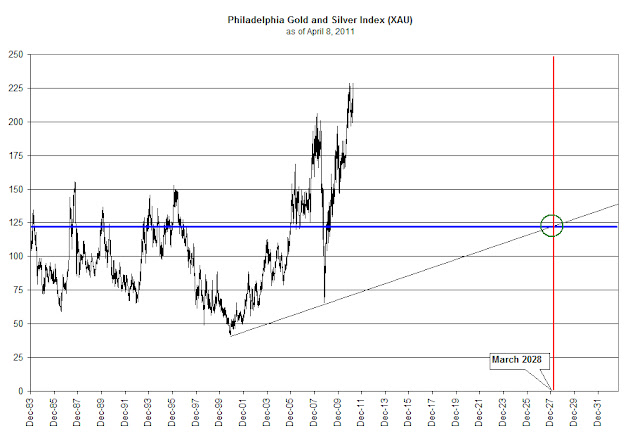
In our chart of the Gold and Silver Stock Index, we have drawn the XAU on a daily basis from 1983 to the present. As described by Scheinman, the counter-trend movement should revert to the speed resistance line or two-thirds of the established high. As an example, the previous peak of the XAU on March 14, 2008 was at the 206.37 level. 206.37 divided by 3 is 68.79. The reversal from the 2008 decline was 65.72 on the XAU. This was within 4.5% of the speed resistance level.


Based on the most recent high of 228.95 the downside target for the XAU index is 76.32. We recommend that whenever the XAU index falls at or below the speed resistance line drawn on the chart, between now and just before 2028, as part of the secular rising trend in interest rates/inflation, we would expect that the stocks in the index are underpriced. Confirmation of fair values should be determined for possible speculative positions at these times.


Note: A variation on this method is to divide the high by three then adding the first major low after the start of the bull market, in this case the October 27,2008 low for the XAU. An example of the usefulness of this technical approach to projecting downside targets can be found by dividing the 2007 top in the Dow Jones Industrial Average (14,164) by three and adding the 1987 low (1738.74). This provided a speed resistance line of 6460.07 which was within 2% of the actual March 9, 2009 low. The blue horizontal line, in our chart of the XAU above, represents the expected downside target when adding the October 2008 low to the speed resistance line.

Please revisit New Low Observer for edits and revisions to this post. Email us.

Northwest Natural Gas (NWN) Altimeter

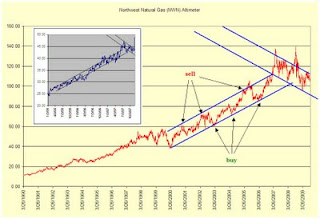
Today's altimeter is on Northwest Natural Gas (NWN) and there is a lot to appreciate when we exam the pattern that has been established so far. NWN has increased its dividend for 53 years in a row. With such a history of dividend increases, I think NWN will do everything it can to avoid cutting or leaving the dividend the same. At the price of $42.29, NWN is within 16% of the 52-week low.

NWN has a challenging altimeter to decipher until you take a closer look. The pattern that has been established since 2000 until the present is an exact replication of the move from the period 1995 to 1997 (shown in the inset.) After the 1995 to 1997 moves we can see that the stock traded in a wide range until the ultimate low in 2000. From the 2000 low the stock traded in a narrow ascending range, offering several clear opportunities to buy and sell the stock.

Although I have taken artistic license on the interpretation of this altimeter, I do believe that the possibility may exist that NWN will not go materially below the March 2009 low. With the recent decline in natural gas prices, NWN offers a reasonable investment opportunity with a long history of dividend increases and a fair payout ratio. NWN is definitely worth investigating at the current levels. Let us hope that the stock price declines while you're doing the research on this company. Touc.

Please revisit Dividend Inc. for editing and revisions to this post.

Weyco (WEYS) Altimeter

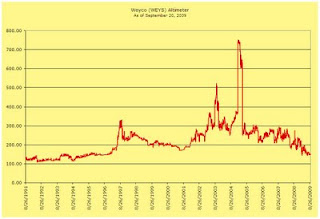
Below is a chart of the Weyco (WEYS) altimeter. As we can see, WEYS trades in a range between 275 on the high end and just above 150 on the low end of the range. Given WEYS balance sheet and the products that it produces (Florsheim shoes) this company is worth investigating.

One consideration is the fact that WEYS has tremendously low trading volume. Additionally, this stock has only increased its dividend 10 years in a row which means that we can't be sure that the company can weather an true economic cycle. However, as mentioned before, this company has no debt and my be worth a second look. Touc.

Bank of Hawaii (BOH) Altimeter

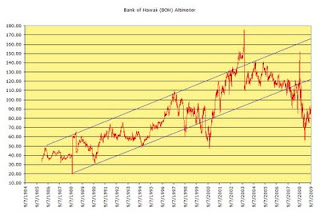
The chart below is a representation of the Bank of Hawaii (BOH) altimeter. BOH has increased its dividend every year for 31 years in a row. As we can see, BOH's altimeter has been in a rising trend for quite some time.That trend was recently broken during the recent banking crisis.
The channel that BOH has managed to fluctuate within suggests that the stock is overvalued at the high end and undervalued at the low end. The period of extreme overvaluation is reflected in 2003 and started to move in a declining trend to undervaluation when BOH increased the dividend from $0.19 to $0.30.
There are two periods of extreme undervaluation in the altimeter. The first level of extreme undervaluation hit bottom in October 2000. The second period was most recently in March of this year. If the stock were to go back to the "historical" low end of the range, BOH would be priced at $54 a share. Although we do not have an extensive history on the periods of extreme undervaluation, it could be inferred that, based on the altimeter, an investment in BOH while not risk free, could be considered low risk.

At least one hitch to my assessment on BOH, in terms of the altimeter, is the fact that the low in March 2009, around the 60 level, could be part of a normal low range that is being established for the stock. If the 60 level is the low end of a new long-term range, my best guess is that the 110 level is the upper end of the range. At the 110 level, BOH stock price would be $49.50.

Only time will tell whether the escalating failure of banks is going to spread even further. However, BOH has managed to fare better than most banks of a similar size. As a further indication of BOH's strength, the dividend increase in November 2008 suggests that management believes the company will survive through the present banking liquidation cycle. Regardless of BOH's strength, I wouldn't be surprised if BOH does not increase the dividend in November. However, if a cut in the dividend takes place then I would be more cautious on the company and the stock. Touc.

related articles:


Please revisit Dividend Inc. for editing and revisions to this post.

Wal-Mart (WMT) Altimeter

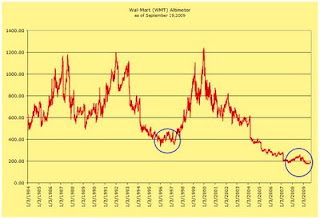
Below is a chart of Wal-Mart's altimeter. As mentioned before, the purpose of the altimeter, created by Edson Gould, is to determine the relative value of a company based on the quarterly dividend payment and the daily price of the stock or index.

Based on the above chart, we can see that WMT is traditionally overvalued between 1100 and 1200 level. Additionally, when WMT falls to the 550 level the company is considered undervalued. What should be noticed is the double bottom that took place in the 1995 to 1997 period. After that time, WMT took off like a rocket.

In the most recent period from 2007 to 2009, we can see that WMT is forming a similar double bottom. From this indication, we should look out for the stock to rise significantly over the next four years. The expected rise in WMT should be in spite of all the economic forecasts of a continued decline in the economy.

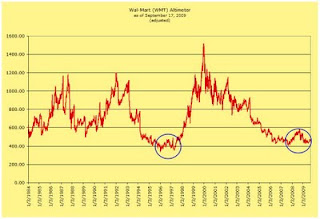
The chart below is my own interpretation of WMT if the company pursued a less aggressive policy of increasing the dividend at such a high rate.

In the first chart, you can see that after 2004 WMT fell to an extreme level of undervaluation. The reason this occur is because WMT continued in increase the dividend at a high rate even though the company didn't have the earnings to support such increases. With diminished earnings, WMT issued more shares to raise capital to fund the dividend payments at the expense of per share earnings.

My model continues to increase the dividend every year but at a rate of 50% less than what WMT did from the period of 2004 to the present. This lowers the number of shares that need to be issued. In fact, my model would not have required the issuance of new shares to cover the dividend.

At the moment, we could consider WMT undervalued. However, keep in mind the fact that the continued issuance of shares in order to keep the dividend history intact undermines future earnings growth.

related article:

Please revisit Dividend Inc. for editing and revisions to this post.