Category Archives: Edson Gould

Carbo Ceramics Altimeter

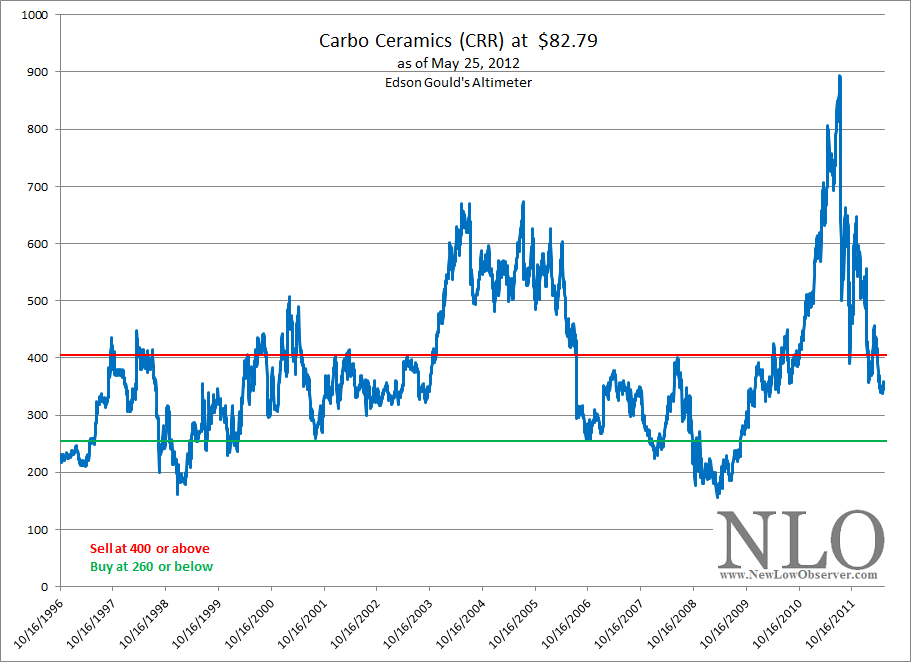
Below is the Altimeter for Carbo Ceramics (CRR) which is ranked number 7 on our May 25, 2012 U.S. Dividend Watch List (found here).  Using Edson Gould’s Altimeter, we have arrived at the conclusion that Carbo Ceramics (CRR) should be bought (green line) any time the Altimeter declines to 260 and below and should be sold (red line) whenever the Altimeter rises to 400 and above.
image

Below is a table which outlines the actual price and date when Carbo Ceramics’ Altimeter rises or falls to the indicated levels.

Date Altimeter level stock price buy/sell % change
6/13/1997 257.40 12.87 buy 59%
10/2/1997 410.80 20.54 sell -41%
8/27/1998 239.00 11.95 buy 67%
4/24/2000 399.60 19.98 sell -22%
8/20/2001 258.33 15.50 buy 56%
1/3/2002 403.00 24.20 sell 27%
10/3/2006 256.16 30.74 buy 82%
6/23/2008 401.50 56.21 sell -21%
10/6/2008 258.35 43.92 buy 65%
4/15/2010 403.55 72.64 sell ????????
???????? 260.00 62.40 buy  

Based on the current dividend for Carbo Ceramics, we have anticipated that the stock price will decline to $62.40 before the next buy indication is triggered.  However, as we’ll describe below, there are some careful considerations of what you give up when deciding to buy Carbo Ceramics based on Edson Gould’s Altimeter.

First, it is important to note that in all except one instance, January 3, 2002, Carbo Ceramics had reasonable gains when a buy indication was triggered and avoided losses when the sell indication was triggered.

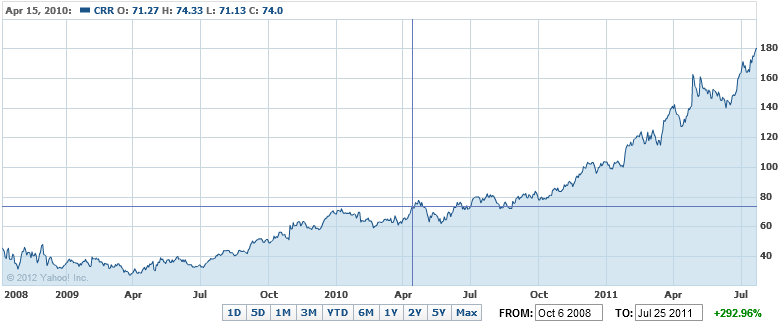
As an example, if you bought in October 6, 2008 and sold on April 15, 2010 (at crosshair below), you only gained 65% and you would have missed the additional 143% rise in the stock’s price, as seen in the following chart:
image

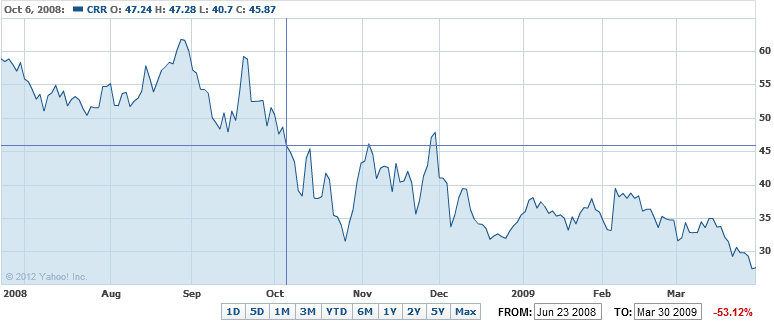
Likewise, the June 23, 2008 sell signal at $56.21 didn’t account for the –53% decline that occurred afterwards.  Instead,  Carbo Ceramics declined -21% from the $56.21 level by the time the next buy signal was indicated on October 6, 2008 (at crosshairs below).
image

So what does all this mean, “buy at the 160 level” and “sell at the 400 level” in the Altimeter?  For the New Low Team, it means that if we can gain an average of +60% in 1-1/2 years with each buy and sell cycle then we will do quite well if we can avoid all of the huge losses, at the expense of missing the huge gains.

Who is Edson Gould?

“Edson Gould spent over 60 years working in and studying financial markets. Gould studied the arts at Princeton, engineering at Lehigh (from where he graduated in 1922), and finance at New York University. In 1922, after working for a short time at Western Electric, he joined Moody’s Investor Service as an analyst and later was editor of Moody’s Stock Survey, Bond Survey, and Advisory Reports. In 1948, he began at Arthur Wiesenberger & Company, where he developed and edited the well-known Wiesenberger Investment Report and became a senior partner. He also was Research Director at E. B. Smith (which later became Smith Barney), and worked for Nuveen.”

(source: Market Technicians Association. Gould, Edson Beers, Knowledge Base. Accessed April 26, 2012. link MTA reference.)

“Market technician Edson Gould always laughed at the idea of having a significant influence on the stock market, but his predictions were the most precise around. He pinpointed major bull markets and prophesied bottom-out markets as if he had his own peephole into the future. But in place of a crystal ball and wacky off-the-cuff schemes, his were smart, intensely researched and time-tested theories that made him a legend in the investment community.”

(source: Fisher, Kenneth L.. 100 Minds That Made the Market. Business Classics, Woodside, CA. 1993. page 320.)
Should Berkshire Hathaway Be Trading at 1995 Prices?

No, this isn’t an article about the prospect of Berkshire Hathaway falling from the current price of $121,950 to $32,100.  Instead, this is what Edson Gould’s Altimeter suggests that Berkshire Hathaway’s (BRK-A) stock price is currently trading at.

Edson Gould’s Altimeter compares the current stock price relative to the dividend that is paid by a company.  As we all know, Berkshire Hathaway does not pay a dividend.  So, how did we arrive at a dividend for Berkshire Hathaway?  We borrowed the dividend policy of Charlie Munger’s Wesco Financial (WSC).  We thought that there would be no better corporate dividend policy to replicate other than that of Warren Buffett’s right hand man.

Exactly what portion of Munger’s dividend policy did we replicate? First, we took WSC’s average dividend payout ratio of 13% from 1999-2010 and applied it to Berkshire Hathaway’s 1977 reported operating earnings of $22.54 per share.  This resulted in a dividend of $2.93.

Next, we compared the compound annual growth rate [CAGR] of the dividend for Wesco Financial which was slightly more than the book value from 1999-2010, at 3.37% and 3.01%, respectively.  Additionally, we took into consideration the fact that by 2010 Wesco Financial had a 38-year history of consecutive dividend increases.  Because Berkshire Hathaway has a 19.8% CAGR of their book value (2011 annual report), we opted to cut that figure in half and assign a dividend growth rate of 9.9%.  Our decision to cut the CAGR of the book value in half was in deference to Buffett’s desire to better deploy the capital in other investment opportunities and the possible diminished impact of the succession team upon Buffett’s “retirement.”

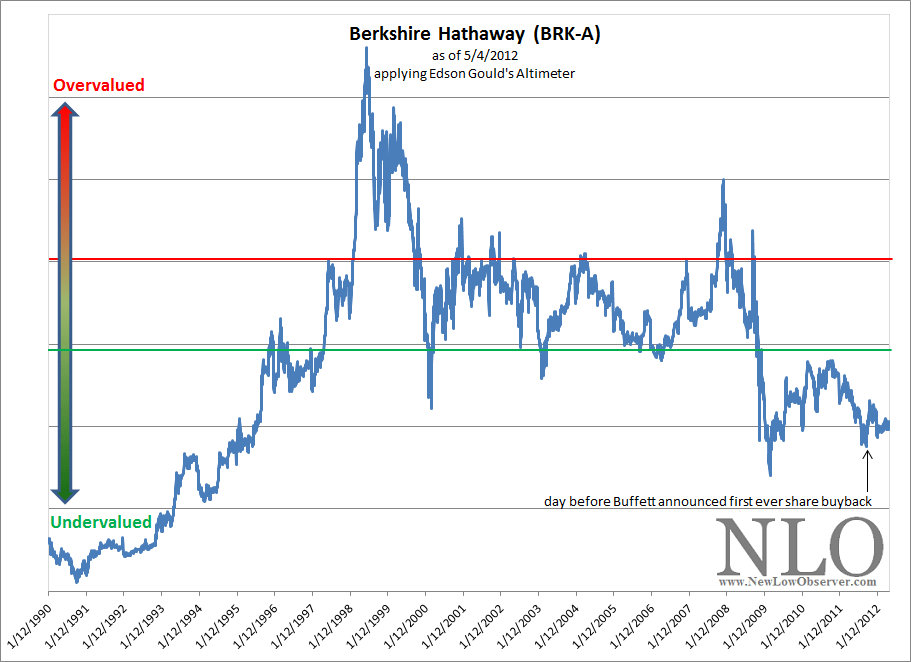
After borrowing the dividend policy from Buffett’s primary business partner and creating a hypothetical dividend and a compounded annual dividend growth rate, assuming regular dividend increases for the last 35 years, we believe that we have constructed a reasonable approximation of an Altimeter which is represented in the chart below.

image

Based on the Altimeter, our best guess is that the period from 1996 to 2008 provided consistent indications of when to add to your positions of Berkshire Hathaway (at or below green line).  The period from 2008 to 2009 provided exceptional opportunities for new investors to buy Berkshire Hathaway as the markets, economy and insurance industry were in crisis mode at the exact same time.

Once the recovery in stocks started it was off to the races for most investors.  Even Berkshire Hathaway was able to participate in the run-up from the 2009 low.  However, on a relative basis, Berkshire’s share price was not increasing  to a level that was reflective of its true value, this is in spite of getting within 10% of the 2007 high in late February 2010.  Based on the Altimeter, Berkshire is currently undervalued by at least 66% and below the 2007 peak by almost 95%.

Those considering the acquisition of Berkshire Hathaway have the following upside targets to consider in the coming 2-3 years, all things being equal:

  • $175,280
  • $197,190
  • $219,100

The following are the possible downside targets:

  • $120,767
  • $105,606

After constructing a fairly conservative dividend policy, the Altimeter clearly outlines the reasons why Warren Buffett would suggest that Berkshire Hathaway will “very aggressively” buy back shares even though the stock is well within striking distance of the all time high.

Who is Edson Gould?

"Edson Gould spent over 60 years working in and studying financial markets. Gould studied the arts at Princeton, engineering at Lehigh (from where he graduated in 1922), and finance at New York University. In 1922, after working for a short time at Western Electric, he joined Moody's Investor Service as an analyst and later was editor of Moody's Stock Survey, Bond Survey, and Advisory Reports. In 1948, he began at Arthur Wiesenberger & Company, where he developed and edited the well-known Wiesenberger Investment Report and became a senior partner. He also was Research Director at E. B. Smith (which later became Smith Barney), and worked for Nuveen."

(source: Market Technicians Association. Gould, Edson Beers, Knowledge Base. Accessed April 26, 2012. link MTA reference.)

"Market technician Edson Gould always laughed at the idea of having a significant influence on the stock market, but his predictions were the most precise around. He pinpointed major bull markets and prophesied bottom-out markets as if he had his own peephole into the future. But in place of a crystal ball and wacky off-the-cuff schemes, his were smart, intensely researched and time-tested theories that made him a legend in the investment community."

(source: Fisher, Kenneth L.. 100 Minds That Made the Market. Business Classics, Woodside, CA. 1993. page 320.)

Downside Targets for Herbalife (HLF)

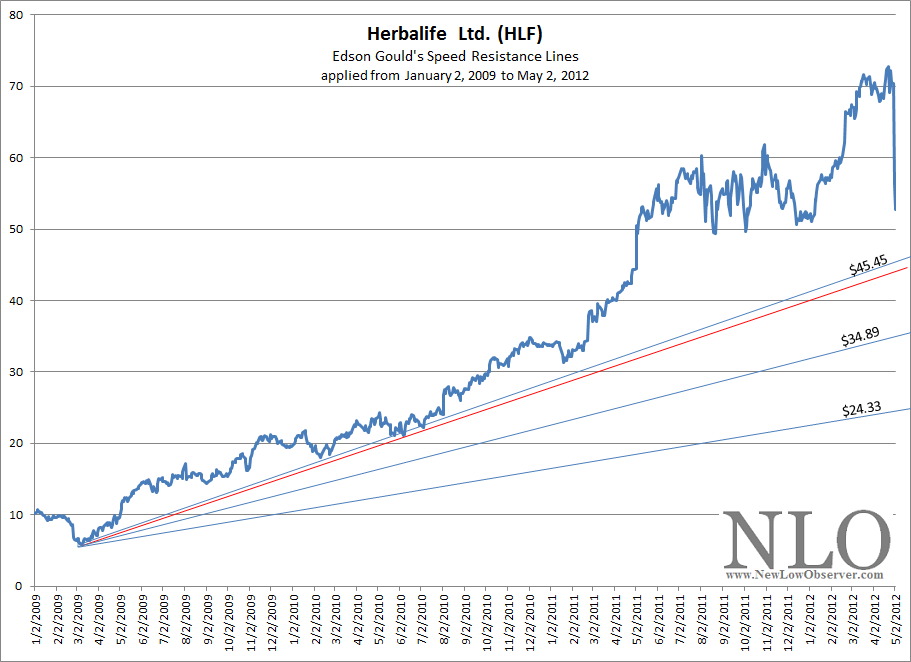
After the news of Herbalife (HLF) getting slammed, we were curious about what the downside targets for the stock might be using Edson Gould’s Speed Resistance Lines.  Below is a chart representing the conservative downside target of $45.45 and the extreme downside target of $24.33.

So far, HLF appears to have support for the stock price at $45.45.  However, if HLF falls below the $45.45 level, it would suggests that HLF will decline to, at minimum, $34.89 before finding stabilization in the stock price.  A decline $24.33 would mean that HLF could revisit the 2009 lows.

image

We believe that it is worth examining whether or not these downside targets are accomplished.  In our view, the downside targets are reasonable estimates of where the stocks could go before initiating new research on whether these companies have viable business models.

Disclaimer: This piece is a continuation of the examination of Edson Gould’s speed resistance lines as explained in prior articles. This is not an endorsement to sell short at the current levels nor buy these stocks once falling below the extreme downside targets.

Green Mountain Establishes New Downside Target

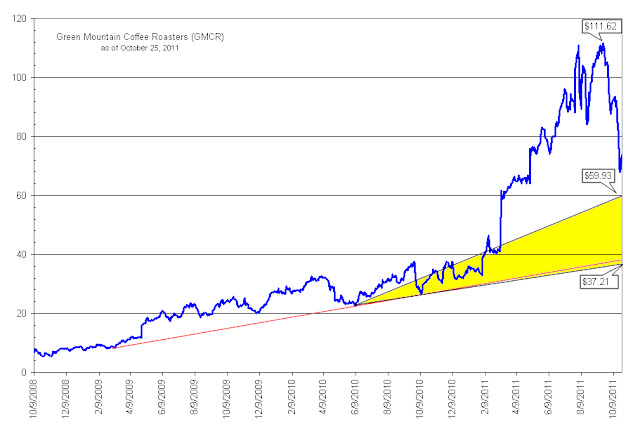
On October 25, 2011, we published a chart of Green Mountain Coffee Roasters (GMCR) that utilized Edson Gould’s Speed Resistance Lines [SRL] to determine what the possible downside targets might be.  At the time, Green Mountain Coffee Roasters was trading at $64.75.  However, our use of the SRL indicated GMCR had a conservative downside target of $59.63 and an extreme downside target of $37.21.

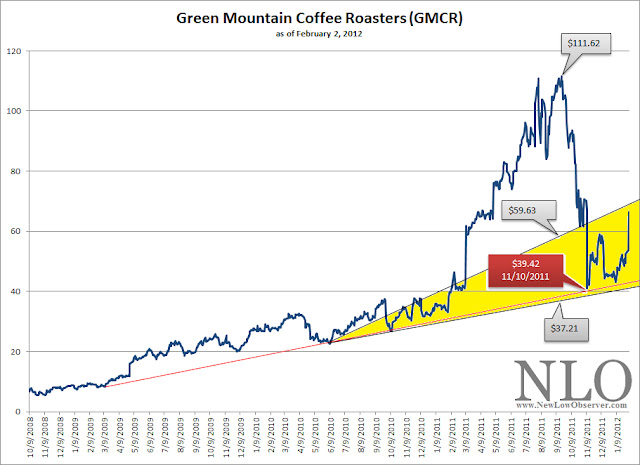
After reach the level of $59.63, GMCR’s stock price rose marginally before falling significantly to the downside resting at the $39.42 level.  Soon afterwards, GMCR rose as high as $70, but did not go above the SRL rising trend established at $59.63.

After reaching the $70 level, GMCR promptly fell to the $37.21 level which established what we believed to be a “support” level (green arrows; definition here).  Support levels, if broken, would result in the stock of GMCR going to the previous downside levels that helped to establish the upside trend at $22.53 and $8.30.

In after-hours trading on May 2, 2012, GMCR plummeted from the closing price of $49.52 to as low as $28.50, a loss of -42%.  We believe that GMCR  has a new support level of $22.53 and upside resistance (definition here) at $42.  If the price of GMCR falls significantly below $22.53 (i.e. $21) then we would expect that the new downside target of GMCR is $8.30.

image

As an investor, if you have a stop-loss order (definition here) at $45, then you’ll only be able to get out of the stock at the next best price.  This means that if GMCR opens at $30 tomorrow, you’re only able to get out of GMCR at $30, not $45-$44 under normal market conditions.  Right off the bat, you’ll lose 33% more than you had planned. 

Typically, when a stock crashes it would usually rebound to a higher level before continuing the declining trend (if it happens to be going lower).  The stop-loss order will trigger automatic selling of GMCR even though we expect that it might rebound from the $28.50 low of today to, at least, $35.50 tomorrow.  If nothing else, selling on the short-lived rebound would reduce the amount of loss while a stop-loss order typically ensures the maximum loss in the shortest period of time.

This explains why we are against the use to stop-loss orders as a means to avoid losses.  The best way to avoid significant lose is to consider the downside targets before buying a stock.  After considering the downside, we recommend putting an amount that you’re comfortable with even if the stock were to decline -50%.

A Warning for Chesapeake Energy Stockholders

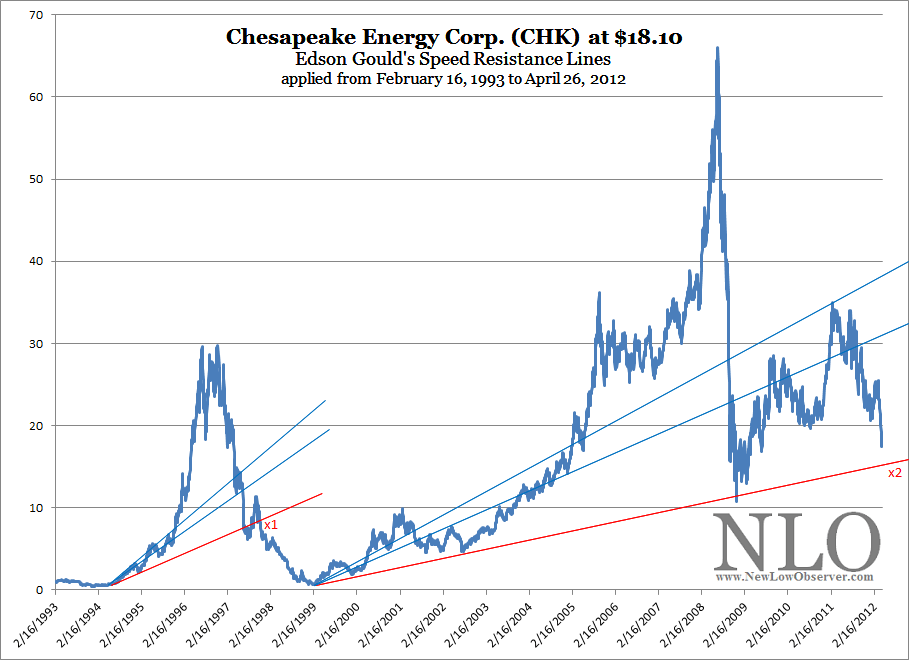
While it appears that Chesapeake Energy  (CHK) has seen all the punishment that could possibly lay ahead, we’re concerned that the previous technical pattern in the period from 1993 to 1999 is about to repeat.  In the chart below, we’ve applied Edson Gould’s Speed Resistance Lines [SRL] to the price of CHK in the period from 1993-1999 and 1999-2012.

image

Critical to our analysis using Edson Gould’s SRL is the fact that, so far, CHK has replicated every move that has occurred in the ‘93-‘99 period in the most recent price activity from ‘99-‘12.  While it would appear academic that the stock has been in a declining trend, we’re more concerned with the downside risk.

With this in mind, if CHK declines below the red line at x2, then we believe CHK will return to the pivot level of $4.94 with the possibility of declining all the way back to 1999 prices.  If CHK falls significantly below the $4.94 level, then the stock has a high likelihood of going all the way $0.67.  This would be a replication of CHK falling below x1, and returning to the previous pivot level of $2.00, set in 1994.

This “warning” does not suggest that CHK cannot go back to the prior highs at $55 (for now), instead, this review is strictly intended to consider the downside risk, which is our only concern.

Who is Edson Gould?

“Edson Gould spent over 60 years working in and studying financial markets. Gould studied the arts at Princeton, engineering at Lehigh (from where he graduated in 1922), and finance at New York University. In 1922, after working for a short time at Western Electric, he joined Moody’s Investor Service as an analyst and later was editor of Moody’s Stock Survey, Bond Survey, and Advisory Reports. In 1948, he began at Arthur Wiesenberger & Company, where he developed and edited the well-known Wiesenberger Investment Report and became a senior partner. He also was Research Director at E. B. Smith (which later became Smith Barney), and worked for Nuveen.”

(source: Market Technicians Association. Gould, Edson Beers, Knowledge Base. Accessed April 26, 2012. link MTA reference.)

“Market technician Edson Gould always laughed at the idea of having a significant influence on the stock market, but his predictions were the most precise around. He pinpointed major bull markets and prophesied bottom-out markets as if he had his own peephole into the future. But in place of a crystal ball and wacky off-the-cuff schemes, his were smart, intensely researched and time-tested theories that made him a legend in the investment community.”

(source: Fisher, Kenneth L.. 100 Minds That Made the Market. Business Classics, Woodside, CA. 1993. page 320.)
What Does Warren Buffett See in IBM? Maybe This

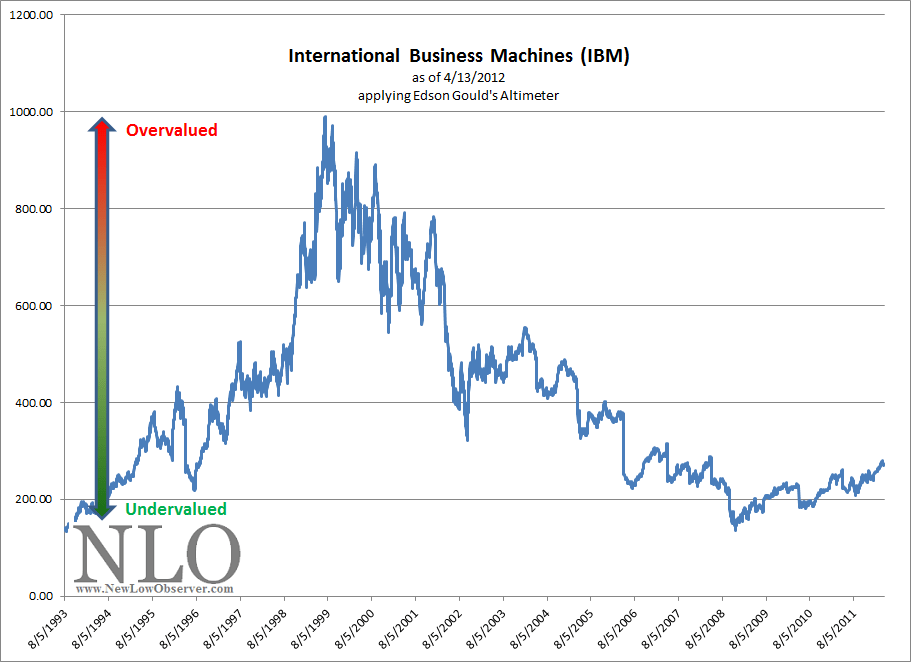
We don’t talk fundamentals much, if at all.  However, the chart below says a lot about why Warren Buffett might bother with buying IBM, a technology company, when the stock is trading near an all time high.

image

Buffett's latest annual report goes to great length in citing IBM's stock repurchase plan among other reasons why he bought the company's shares.  Buffett says the following:

"Let’s do the math. If IBM’s stock price averages, say, $200 during the period, the company will acquire 250 million shares for its $50 billion. There would consequently be 910 million shares outstanding, and we would own about 7% of the company. If the stock conversely sells for an average of $300 during the five-year period, IBM will acquire only 167 million shares. That would leave about 990 million shares outstanding after five years, of which we would own 6.5%.

"If IBM were to earn, say, $20 billion in the fifth year, our share of those earnings would be a full $100 million greater under the 'disappointing' scenario of a lower stock price than they would have been at the higher price. At some later point our shares would be worth perhaps $1.5 billion more than if the 'high-price' repurchase scenario had taken place." (Source: 2011 Berkshire Hathaway Annual Report. page 6)

In order for IBM to make ever increasing dividend payments and massive stock repurchases, IBM has to be generating serious cash flow.  The combination of the two are creating an undervalued situation that may not exist for quite some time in the future.

As we’ve said before, Edson Gould’s Altimeter is a summary of relative values for a stock's price which only requires additional fundamental information for support.  We saw a similar undervalued Altimeter in Transatlantic Holdings (TRH) and Wesco Financial (WSC) which prompted our articles titled "Transatlantic Holdings: A Value Proposition Worth Consideration" and "Wesco Financial: Fundamentals and Technicals Are Aligned" before Buffett made a bid for both companies.

In this case, the dividend has been rising much faster than the stock price, among the many reasons that Buffett might be interested in a technology stock near an all-time high.

Now, just imagine what the stock will look like after falling to a 52-week low.

Considering the Downside Prospects for Apple

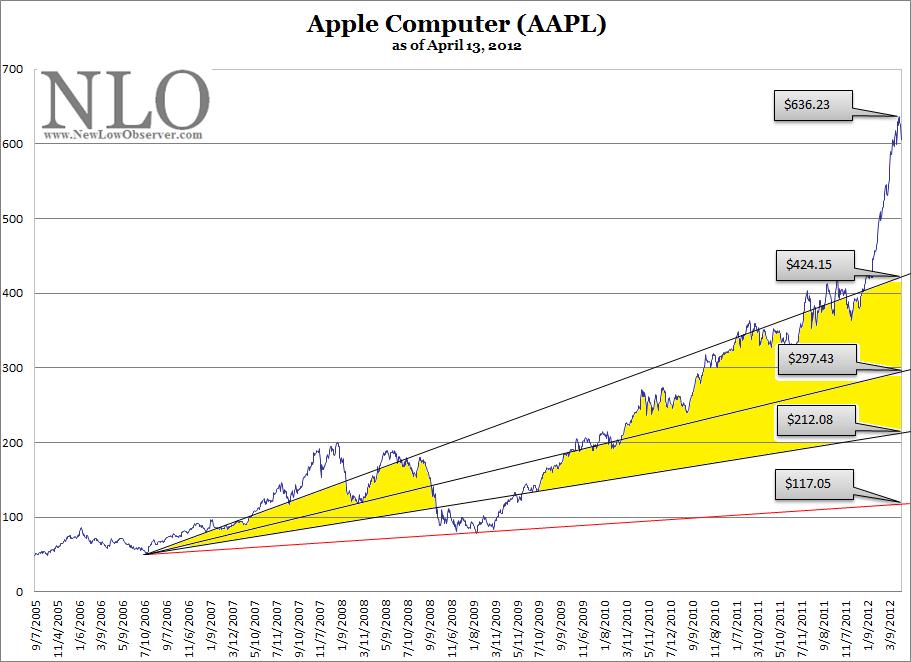
For the New Low Observer team, it has been an uneventful period in our watch of Apple Inc. (AAPL) stock since February 5, 2012 even though the price has risen nearly 40%.  What in the world would we consider eventful in regards to Apple stock? Well, we’d  like to see Apple hit one of Edson Gould’s speed resistance line downside targets.  The chart below is an update of the one that we submitted earlier this year (found here).

image

The new downside targets are as follows:

  • $424.15
  • $297.43
  • $212.08

Based on the current run in Apple Inc. stock, the Dow Theory fair value is $275.44. (636.23-85.35)/2=275.44

As we said on February 5, 2012, “the rampant enthusiasm for AAPL suggests that the stock isn't likely to decline to the indicated levels any time soon.” This has definitely been the case with the impressive run up since the beginning of the year.

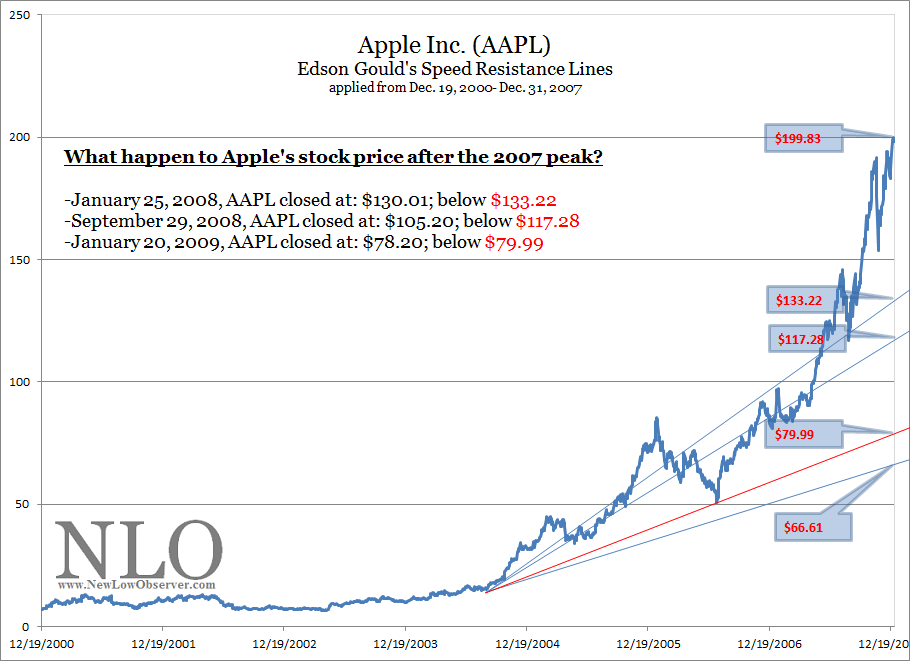
In order to diffuse the legitimate claims that we’re grasping at straws simply to make a bearish case against Apple Inc., we’ve provided the price performance of the stock over a similar 7-year period from December 19, 2000 to December 31, 2007 applying Edson Gould's speed resistance lines, in the chart below.

image

What stands out the most in the period from 2000-2007 is the percentage increase in Apple’s stock price compared to the current run-up as indicated below:

  • 12/19/2000-12/31/2007: +2,300.67%
  • 9/7/2005-4/13/2012: +1,079.56%

If we were to ask the question of what was the likelihood of Apple falling to $133.22 on December 31, 2007, we believe the chorus of Apple investors would say, “not likely, if ever.”  Similarly, we believe that, based on the current speed resistance lines, no one would expect Apple to decline to our conservative downside target of $424 let alone falling to the  $212.08 worst case price.

We’re not advocating that we’ve seen the peak in Apple’s stock price especially when we compare the fundamental data on AAPL between the 2007 peak and the current price:

Apple (AAPL) 2007 2012 % change
Sales per share 27.52 170.2 +518.45
‘‘Cash Flow’’ per share 4.37 46.5 +964.07
Earnings per share 3.93 43.8 +1,014.50
Div’ds Decl’d per share 0 2.65 N/A
Cap’l Spending per share 0.84 5.65 +572.62
Book Value per share 16.66 138.85 +733.43
Common Shs Outst’g 872.33 940 +7.76
P/E Ratio @ high price 43.53 17.23 -60.42
Source: Value Line Investment Survey Oct. 12, 2007 April 6, 2012

However, in 2007, it was justified for a non-dividend paying technology company to have a P/E ratio in the 40’s while a company that could easily become a dividend aristocrat would be considered fairly priced with a P/E ratio of 17.

Since we believe that markets are supremely inefficient, the perceived extremes to the upside are likely to be counteracted to the downside.  Edson Gould’s speed resistance lines provide a progressive downside target as Apple’s price increases.  If the price decline achieves any of the downside targets, we’ll be ready to re-examine the company fundamentals for long and short-term investment opportunities.

Barrick Gold or Newmont Mining?: Edson Gould’s Altimeter Makes the Call

There are few times that we’ll actually recommend individual gold stocks because much of the available statistical data supports the view that gold stocks are inferior investments when compared to products like SPDR Gold Trust (GLD) or the iShares Silver Trust (SLV), let alone the peace of mind with ownership of the physical metals. The following are the three most prominent examples of when gold stocks didn’t make the grade.

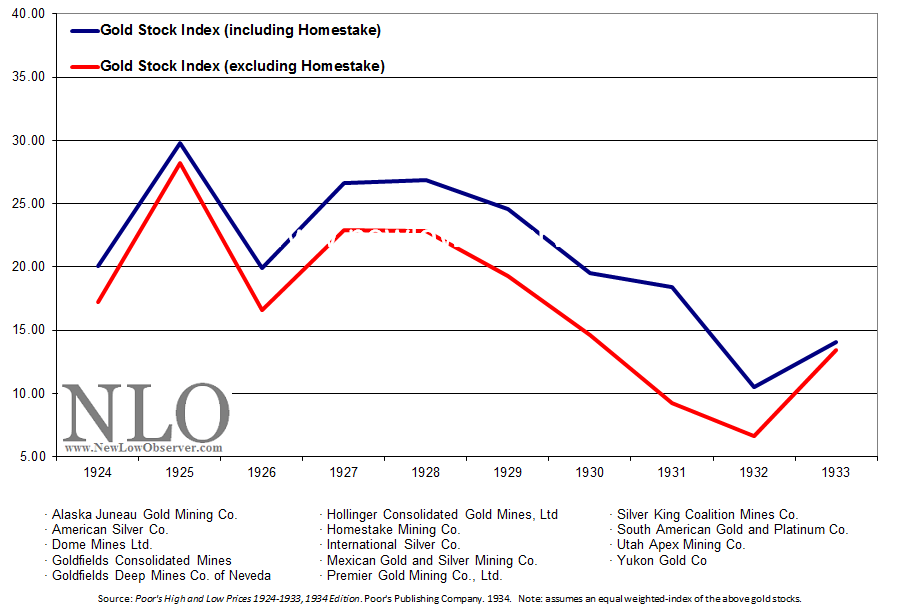
First,  in the period from 1925 to 1932, a basket of gold stocks declined as much as  -64.81% when Homestake Mining is included in the index.  In a article titled “The Lessons of Homestake Mining in Gold Bull and Bear Markets,” we’ve outlined a majority of the reasons why Homestake did so well when other gold stocks didn’t. If we exclude Homestake Mining from the 1925-1932 period, gold stocks declined –76.47% in an equal-weighted gold stock index as reflected below.

image

Second, in the period from 1940 to 1960, although interest rates on the 10-year Treasury bond doubled from 2% to 4% and the 3-month Treasury bill increased nearly 800%, Barron’s Gold Stock Index was virtually unchanged in the same period of time.  Additionally, investors who feared “the coming inflation” and stayed out of general equities missed an inflation adjusted gain of  nearly 400% in the Dow Jones Industrial Average (DIA).

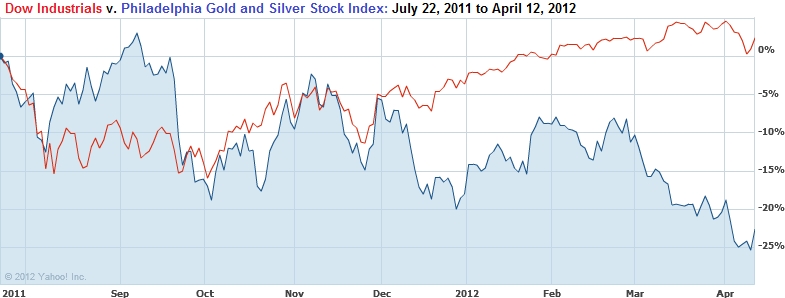
Third, in the middle of the raging gold bull market from 1971 to 1980, gold stocks routinely underperformed the price of gold.  In our articles on Seeking Alpha titled “A Strategy Is Needed for Lagging Gold Stocks” and “Why Gold Will Decline More Than the Markets,” we reviewed the instances where gold stocks routinely underperformed the price of gold or the stock market in general.  Worse still, Barron’s Gold Stock Index peaked in 1974 and declined -66% only to return to breakeven five years later, just before the blow-off stage in the gold bull market.  We can now add the selloff from July 2011 to April 2012 to the long list of severe underperformance of gold stocks, during a bull market in gold.

image

With the above facts in mind, it isn’t taken lightly that we would recommend gold stocks at this point.  However, a strategy is needed in order to outmaneuver the gold stock gremlins. In a recent Seeking Alpha instablog, we outlined the short and long-term gold stock price activity using our Gold Stock Indicator (found here) which is nearing a dual “buy” indication.

In our last article on gold stocks to consider, we used Edson Gould’s Altimeter highlighting Agnico-Eagle (AEM) and Gold Fields (GFI).  In this article we’re going to apply Gould’s Altimeter to Newmont Mining (NEM) and Barrick Gold Corp. (ABX). Gould’s Altimeter reflects the relative value of a stock based on the current dividend that is being paid.  Although Newmont Mining and Barrick Gold Corp. are near one year lows and have consistent dividend policies, Gould’s Altimeter sheds a completely different light on matters, leaving only one company a compelling investment opportunity after additional due diligence.

According to Yahoo!Finance, Newmont Mining engages “in the acquisition, exploration, and production of gold and copper properties. The company’s assets or operations are located in the United States, Australia, Peru, Indonesia, Ghana, New Zealand, and Mexico.”  There are a couple of fundamental attributes that are less than redeeming for Newmont Mining.  First, Newmont has a price to earnings ratio of 67.  This exceeds the norm for anyone who would buy a stock only if it had a p/e ratio of 20 or less.  The next issue is Newmont’s dividend which exceeds the trailing twelve months earnings by 91%.  This could be an issue down the road if earnings and the price of gold do not increase fast enough.

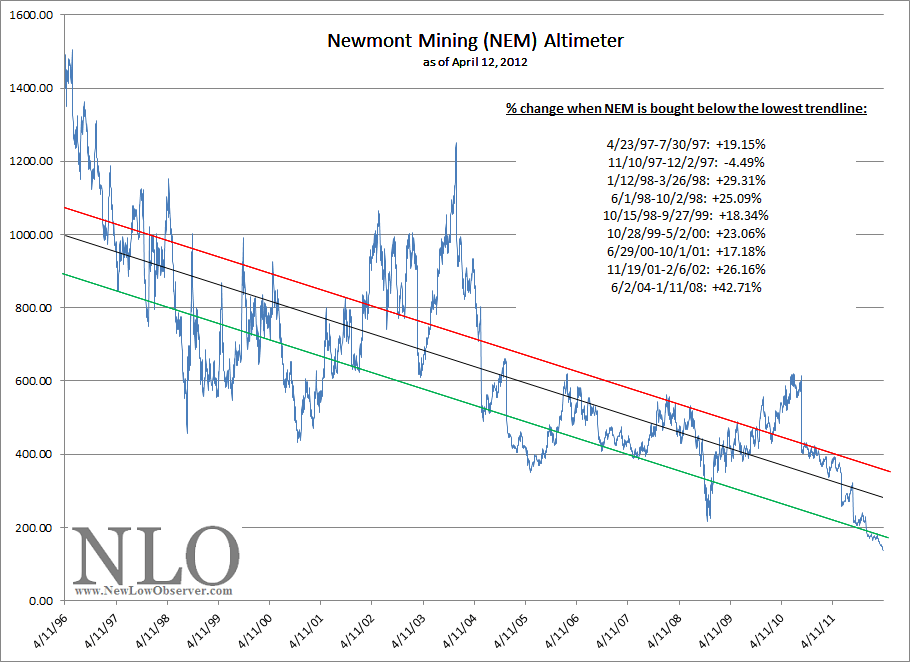
Considering these issues, Edson Gould’s Altimeter below suggests that, although the price of Newmont Mining (NEM) could decline from the current level, a purchase of the stock at or below $55 is considered a reasonable value.

image

The most impressive aspect of Edson Gould’s Altimeter for Newmont Mining is the period from 1996 to 2000 when the stock was in a clear downtrend during the entire time.  Despite this fact, the Altimeter gave clear indications of when Newmont was relatively “undervalued” (lowest trend line) and also overvalued (highest trend line).

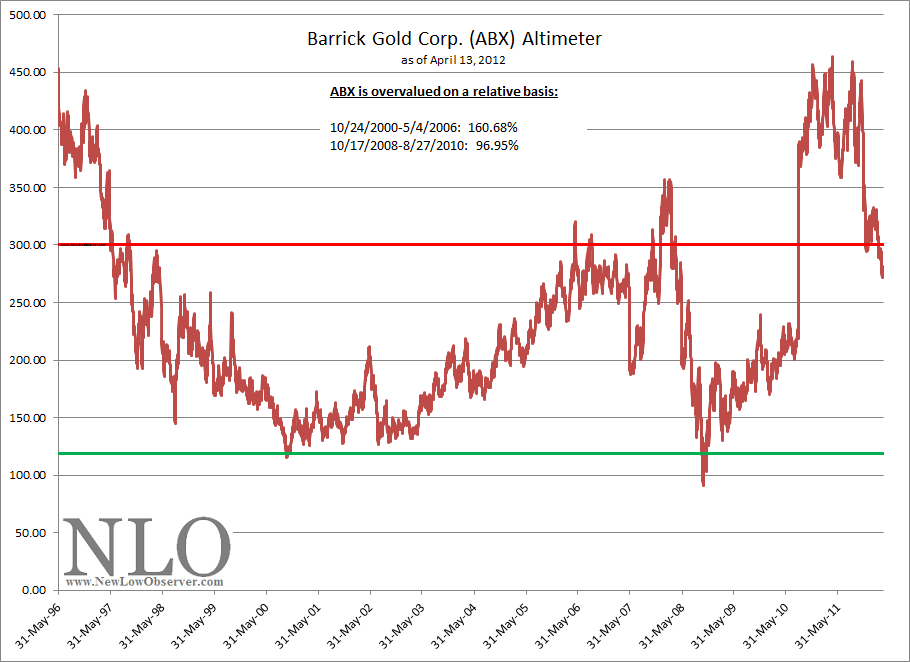
The next stock is Barrick Gold Corp. (ABX).  According to Yahoo!Finance, Barrick Gold is involved in “…the production and sale of gold and copper. The company has a portfolio of 26 operating mines, and exploration and development projects located in North America, South America, the Australia Pacific region, and Africa.”  With Barrick’s earnings at $4.48 and a dividend of $0.60, the dividend payout ratio sits at a paltry 13.39% of earnings.

image 

However, the reduction of the dividend near the middle of 2010 has had a major impact on how the Altimeter reflects Barrick’s relative value, which has played out in the movement in the stock price.  Had the dividend not been cut, Barrick would be characterized as though it were undervalued at the current price.  However, based on the Altimeter, Barrick is considered to be on a declining trend until the Altimeter falls below the 119 level.

In this instance, Newmont has the redeeming attributes that should carry the price much further than Barrick Gold Corp. based on the Altimeters above.

Note: As a word of warning, anyone compelled to invest in Newmont Mining should be mindful of the periods when the Altimeter declines by a wide margin from the lowest trend line (green).  This suggest that, in the short term, there is considerable downside risk.  However, the data in the chart for each period assumes that an investor were to buy at the moment the Altimeter first crosses below the lowest declining trend line.

Gold Stocks to Consider Based on Our Indicator

In light of our Gold Stock Indicator approaching the long term buy signal (found here), we have decided to go over the gold stocks that pay a dividend and are near their respective 52-week lows.  In this review, we’re going to cover Agnico-Eagle Mines Ltd. (AEM) and Gold Fields Ltd. (GFI).  When, and if, the Gold Stock Indicator actually reaches the long term buy indication it will be posted to our site.  The stocks that we cover here are for you to do additional due diligence before taking any action.

Agnico-Eagle Mines Ltd. (AEM) closed at $32.37 on Thursday April 5, 2012.  Agnico-Eagle is currently operating at an annual loss of -$3.36 according to Yahoo!Finance.  Contributing factors to Agnico-Eagle’s decline in price over the last year has been problems with the operation of their mines.

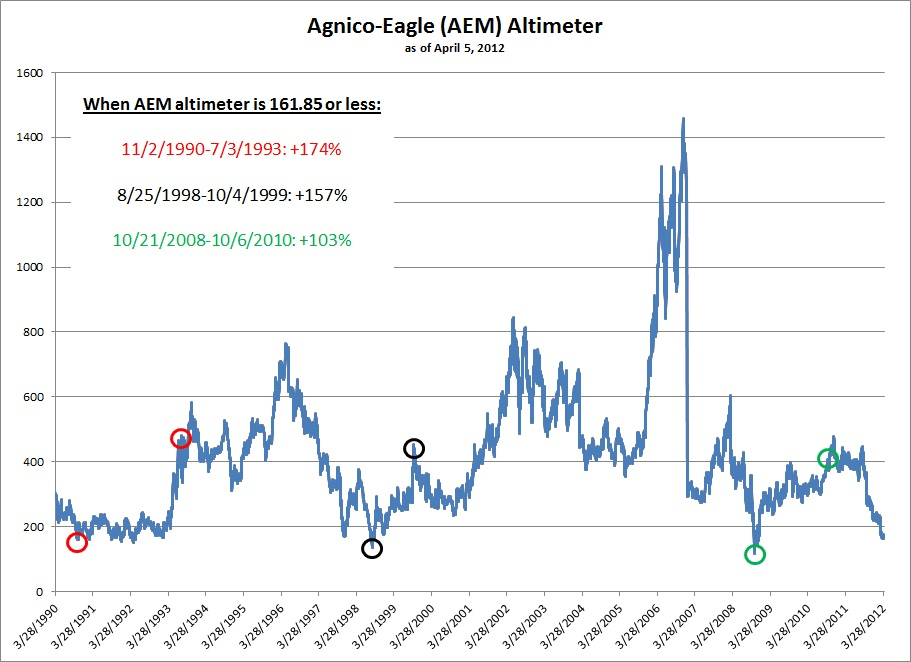
As described in many of our previous articles, Edson Gould’s Altimeter is based on the stock’s price relative to the actual dividend paid.  The Altimeter is a critical real-time assessment of value based on the company’s dividend.  Below is the altimeter for Agnico-Eagle:

image

In our assessment of Agnico-Eagle, we have compared the current level of the Altimeter at 161.85 and compared it to other times when Agnico-Eagle has trade at the same relative level, or below, and traded up to 400 on the indicator.  In the case of Agnico-Eagle there were two periods, before the bull market in gold stocks began, that the stock was selling at a low and was a great buy (based on the altimeter).  In the period from November 2, 1990 to July 3, 1993, Agnico-Eagle rose +174% and in the period from August 25, 1998 to October 4, 1999 rose +157%.

Since the gold bull market began, the only other time that Agnico-Eagle was selling below 161.85 and subsequently traded up to the 400 level was the period from October 21, 2008 to October 6, 2010 for a gain of 103%, this far exceeded the gains of the SPDR Gold Shares (GLD) over the exact same period of time.

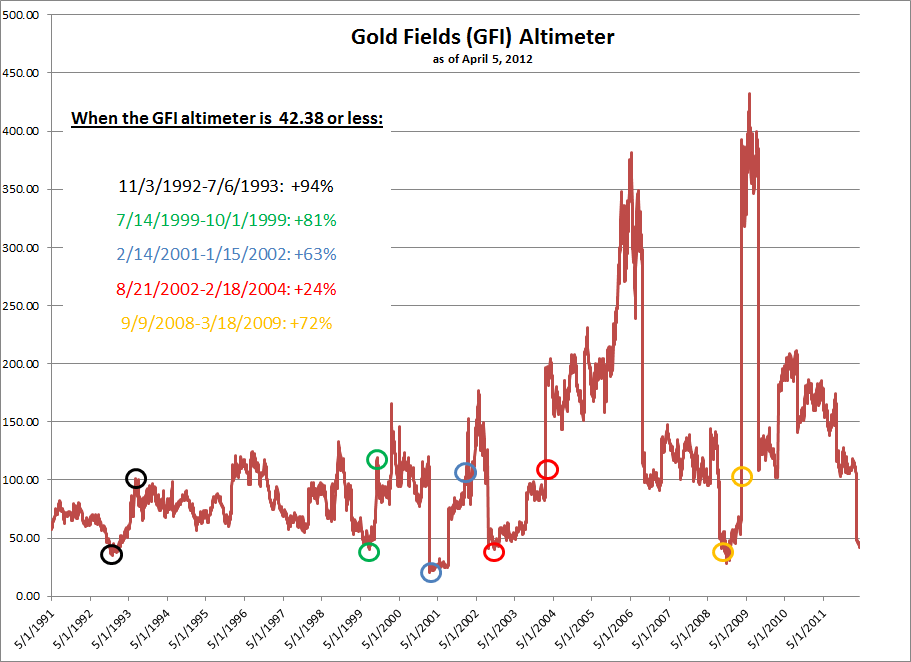
Next in our review is Gold Fields Ltd. (GFI).  Gold Fields sports trailing earnings of $1.22 in the last twelve months  and a dividend of $0.61 with a dividend yield of 4.70%.  Yahoo!Finance indicates that Gold Fields operates “in South Africa, Peru, Ghana, and Australia.” Based on the majority of countries that Gold Fields operates, there is some political risk to this investment.  However, Gold Fields has exhibited amazing consistency in the Altimeter below:

image

Presently, Gold Fields is trading at the Altimeter level of 42.38.  The chart depicts the times when GFI was bought at the 42.38 level and sold whenever the Altimeter reached 100.  The results are amazing and provide clear evidence on how gold stocks can outperform the price of gold when combining Edson Gould’s Altimeter with our Gold Stock Indicator.

Our approach to buying these stocks is to purchase in two stages, once at, or near, current levels and a second time only if the stocks fall -20% below the initial purchase price.  As an example, if we have $10,000 that we’d like to invest then we buy $5,000 now and hold the remaining funds unless/until the stock declines by -20%.  We’re basically hedging with cash if we’re wrong.  If we’re right about our first investment (the stock price rises) then we can use the cash to buy another stock near a new low.

Before bothering with the first of many gold stocks that we’ll be covering based on our Gold Stock Indicator, please review the following questions and answers:

  • Is there downside risk to taking positions in gold stocks at this time? Yes, price declines can reach as much as -50% within the first two months of the purchase.
  • Are you comfortable with declines of -50% or more?  If not, then don’t bother with these stocks at this time.  If you’re wondering about the logic of recommending anything that might decline by as much as –50% then please read our view on the topic (found here).
  • Could these stocks have been held for the “long-term?”  Ideally, yes, however, we believe that history is not on the side of gold stocks relative to the price of gold as we described in greater detail in our article titled “A Strategy is Needed For Lagging Gold Stocks”.

We believe that Edson Gould’s Altimeter, when revealing consistent relative values, yields highly favorable results.  While we always seek to purchases at a relative low, we always set a target for selling at higher levels rather than “holding for the long term.”  Our analysis could change if the stocks mentioned above dramatically increase or decrease their dividend.

Apple Inc.: Edson Gould’s Altimeter as if AAPL were a Dividend Achiever

As Apple Inc. (AAPL) announces that it will be paying a dividend of $2.65 per quarter starting in July 2012, we wondered what Edson Gould’s Altimeter would look like if it were applied to AAPL after 1995, when AAPL eliminated their quarterly dividend.  We want to see how Gould’s Altimeter would react to Apple Inc. if the dividend were increased every year from 1996 to the present with the assumption that the 2013 annual dividend would be $10.60 per share.

The Altimeter was first described by Edson Gould in Barron's on February 21, 1968. Gould asserted that the relationship between the price and the dividends paid on that stock, or index, tell investors of under or overvaluation.  It is important to make the distinction between Edson Gould’s Altimeter analysis and his Speed Resistance Line [SRL] analysis.  Altimeters are based on the dividend payment relative to the stock price while the SRL is based strictly on the price movement.

In the case of Apple Inc. (AAPL), there hasn’t been a dividend paid since 1995.  To arrive at a dividend payment from 1996 to today, we calculated a gradual annual dividend increase as would be the case with any blue chip stock like a Dividend Achiever.  Dividend Achievers are stocks that have increased their dividend every year for 10 consecutive years in a row.

We're running on the assumption that the July 2012 $2.65 quarterly dividend would be the latest increase in a long string of dividend increases since 1996.  Below is the assumed dividend increases from 1996 to the present:

Year Annual Quarterly
1996 $0.52 $0.13
1997 $1.13 $0.28
1998 $1.76 $0.44
1999 $2.40 $0.60
2000 $3.00 $0.75
2001 $3.64 $0.91
2002 $4.42 $1.11
2003 $4.88 $1.22
2004 $5.52 $1.38
2005 $6.14 $1.54
2006 $6.76 $1.69
2007 $7.40 $1.85
2008 $8.02 $2.01
2009 $8.64 $2.16
2010 $9.28 $2.32
2011 $9.89 $2.47
2012 $10.48 $2.62
2013 $10.60 $2.65

Based on the proposed annual dividend increases, we can now view what Edson Gould’s Altimeter would look like for Apple Inc. (AAPL) stock.  Below is the Altimeter from 1996 to the present.

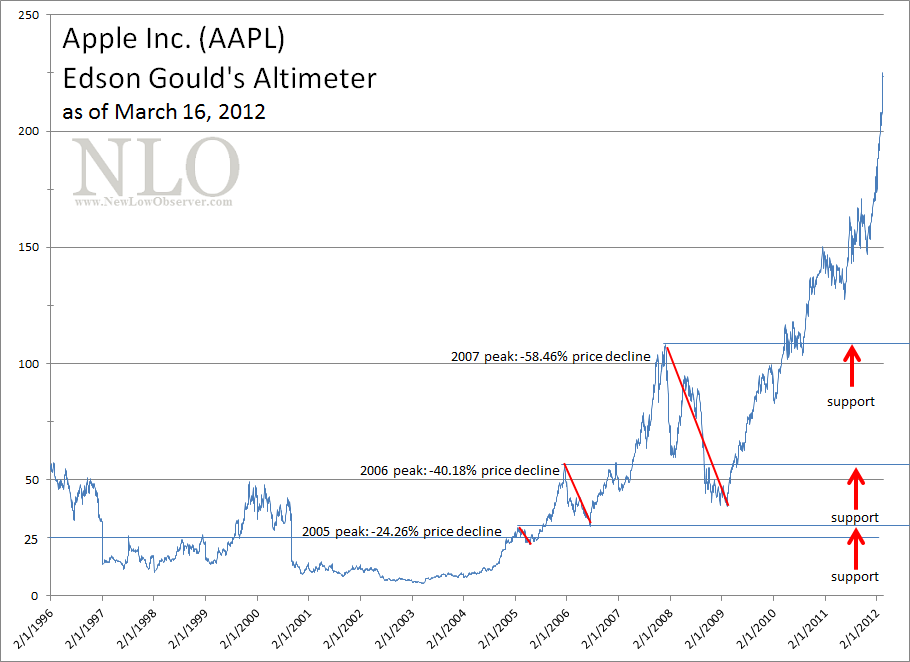
image

The first thing that is noticed, in the chart above, is the fact that from 1996 to 2007, Apple traded in a range of between 50 and 17 on the Altimeter (Altimeter level; not stock price).  Anytime AAPL was trading near 50 the stock was overvalued and when the stock traded around the 17 range the stock was considered undervalued.

However, the low of 2003 marked the beginning of a new relationship between Apple’s stock price and our hypothetical dividend that would have been received.  Starting in 2006, AAPL’s stock would decline, at minimum, to the previous Altimeter peak.  The decline from the 2006 peak stopped exactly at the 2005 peak.  The decline from the 2007 peak initially flirted with the 2006 peak but ultimately succumbed to the forces in play and fell well below the 2006 peak.

Our take on this “pattern,” based on hypothetical dividend increases every year from 1996 to the present, is that the next support level for Apple’s stock price would be at the 2007 peak, at minimum.  This suggests that APPL’s stock price could decline to $284.98.  Such a decline would constitute a –52.59% drop from the closing price of $601.10 on March 19, 2012.  Although the $284.98 level seems dismal, it is a far cry better than Edson Gould’s Speed Resistance Line [SRL] analysis which suggests that the extreme downside target is $201.66.  This is an increase from the February 5, 2012 downside [SRL] analysis done on Apple (found here).

Diamond Foods and Speed Resistance Lines

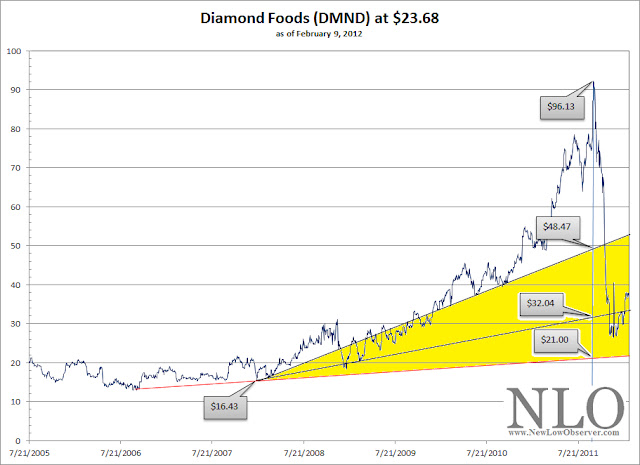
In retrospect, everything appears “oh so clear.”  We love history and attempt to interpret events from the past as a means to project into the future, assuming everything remains the same. Which is why the chart below seems so stunning to us.

The above chart of Diamond Foods (DMND), which has recently been blown out the water due to some accounting “irregularities” and the dismissal of the CEO and CFO, demonstrates the seeming power of Edson Gould’s speed resistance lines (SRL).  First, notice that the high of DMND was at$96.13, the starting point for all analysis of SRLs.  Based on the high of $96.13, the conservative downside target would have been the $48.47 level.  At the same time, the extreme downside target would have been the $21.00 level with an intermediate downside target of $32.04.

Amazingly, every downside target has been met with DMND reaching as low as $21.44 , on an intraday low.  By the way, little mention has been made of the accounting firm that signed off on Diamond Foods spurious books.

Already, in our prior work, we've seen a Netflix (NFLX) SRL, done in December 2010, give us an extreme downside target of $66.  Almost a year later, NFLX declined through the $66 level to fall to as low as $62.37 on November 30, 2011.  Another SRL that we ran before it came to fruition was Green Mountain Coffee Roasters(GMCR) on October25, 2011.  At the time, GMCR was trading at $64.75.  We estimated, using the SRL, that GMCR had an extreme downside target of $37.21.  The stock recently fell as low as $39.42 as reviewed in our February2, 2012 posting.

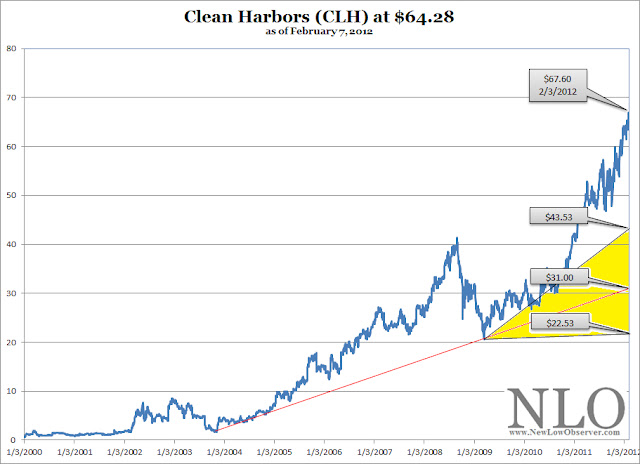
Below is the latest speed resistance lines for a stock that we've been curious about for some time, Clean Harbors (CLH).

Some could reasonably argue that we’re allowing correlation to equal causation, which we’d gladly confess to.  However, this explains why we a reactively seeking companies which we can run Edson Gould’s SRLs beforehand to ensure some semblance of integrity in the concept.  We want to run this examination through as many companies as we can before the actual decline.

A word of warning, the fact that a stock reaches the extreme downside target does not necessarily mean that the stock or index is considered to be a “buy.” Nor does it suggest that the stock or index cannot fall further.  Instead, it only reflects what potentially could happen on the downside.  Additionally, SRLs do not suggest a time frame that a decline is expected to occur.

For the NLO team, speed resistance lines appeal to our sense of considering the worst case scenario, which has saved us a lot of money simply by avoiding situations that would create significant loss.  Using history to assist us in projecting the downside risk is the primary reason we started examining speed resistance lines.

More about SRLs here

Green Mountain Coffee Roasters and Speed Resistance Lines

On October 25, 2011, we posted a speed resistance line for Green Mountain CoffeeRoasters (GMCR).  At that time, we proposed,based on Edson Gould’s work, that the conservative downside target was $59.93while the extreme downside target was $37.21.
 

Sixteen days later, on an intraday basis, GMCR fell as low as$39.42.  This was within 6% of the targetedextreme low of $37.21. In this example, we’re satisfied that Edson Gould’s speed resistance line has met our expectations.

Apple (AAPL) and Speed Resistance Lines

As describedin our article on speed resistance lines (SRL) dated September 22, 2011 (found here), Netflix (NFLX) fell below our projecteddownside target of $99.58. Although we thought that the stock would be worthconsidering below such a level, we had to concede that, “...the difficulty may be that thesentiment that pushed the stock price to $298.73 would likely be just theopposite to push the price down.” Assuming the purchase of thestock at $99.58, an investor would have gained 21.10% based on the currentprice of $120.59.
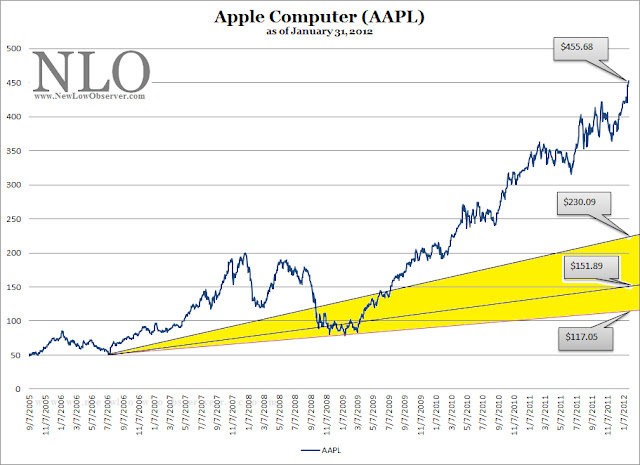
Naturally, wewondered what Edson Gould’s speed resistance lines would say about AppleComputer (AAPL). The very first thing that we look for, to determine speedresistance lines, is the most recent peak in the price.  Because AAPL is continually making new highs,we only need to use the latest price of $455.68 as our starting point.

Based onGould’s work, Apple (AAPL) has a conservative downside target of $230.09 and theextreme downside target is $151.89.  Whenwe ran the same calculations on Netflix (NFLX) in September 2011, we made aseemingly innocuous error.  We overlookedthe fact that NFLX had a lower support line (red line) at the price level of $85.  In this case, we have denoted AAPL’s supportline (also in red line), at $117.05, as a potential downside target for thestock.
As the priceof Apple increases, so too does the SRL lines based on the work ofEdson Gould.  The rampant enthusiasm for AAPLsuggests that the stock isn’t likely to decline to the indicated levels anytime soon.  However, when and if you seeAAPL start to make a swan dive, the levels indicated are reasonable downside targets.

Edson Gould’s Speed Resistance Lines: Chipotle & Green Mountain

As described in our article on speed resistance lines dated September 22, 2011 (found here), Netflix (NFLX) has fallen below the level of $99.58 in a quick crash. At the time that we first ran the speed resistance lines on NFLX on December 3, 2010 we calculated a conservative range of $117 and an extreme range of $66.

Although we thought that the stock would be worth considering below the indicated levels, at the time, we had to concede that,  “the difficulty may be that the sentiment that pushed the stock price to $298.73 would likely be just the opposite to push the price down.” Therefore, we’re not buyers of NFLX at these levels. However, we wondered what Edson Gould’s speed resistance lines would say about two other stocks that have had tremendous increases recently.

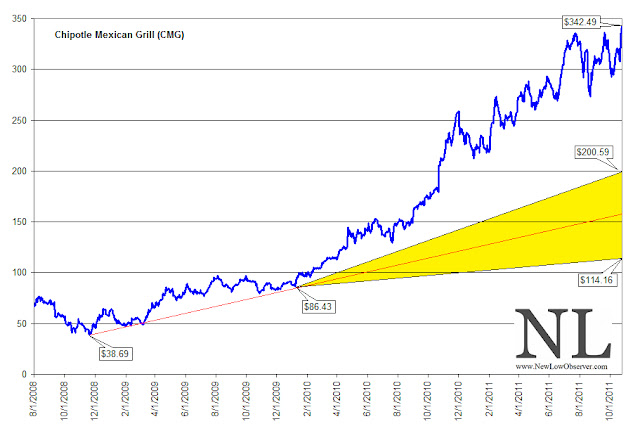
The first stock is Chipotle Mexican Grill (CMG) which has had a tremendous run-up in the last several years. In the chart below we can seen that Chipotle has recently peak around the $342.49 level. Based on Gould’s work, the near term conservative downside target is $200.59 while the extreme downside target is $114.16. If the stock price increases above $342.49 then so too will the downside targets.
The next company that we’re interested in seeing the outcome on is Green Mountain Coffee Roasters (GMCR). It is challenging to believe that Green Mountain Coffee Roasters is going to increase above the prior peak in the near term. However, there appears to be a tremendous amount of downside risk for this company despite the decline that has already taken place. The conservative downside target is $59.93 while the extreme downside target is $37.21.  Green Mountain Coffee Roasters (GMCR) appears to have the worst technicals since a move below the $37.21 price could bring the stock down to the old support level of $3. 
We believe that it is worth examining whether or not these targets are accomplished. Chipotle Mexican Grill (CMG) actually appears to have some upside momentum in it still. However, we believe that the downside targets are reasonable estimates of where the stocks could go before initiating new research on whether these companies have viable business models.
Disclaimer: This piece is a continuation of the examination of Edson Gould's speed resistance line as explained in prior articles.  This is not an endorsement to sell short at the current levels nor buy these stocks once falling below the extreme downside targets since the stocks have been randomly selected, at best.
Those who understand interest earn it, those who don't pay it.

Netflix and Speed Resistance Lines

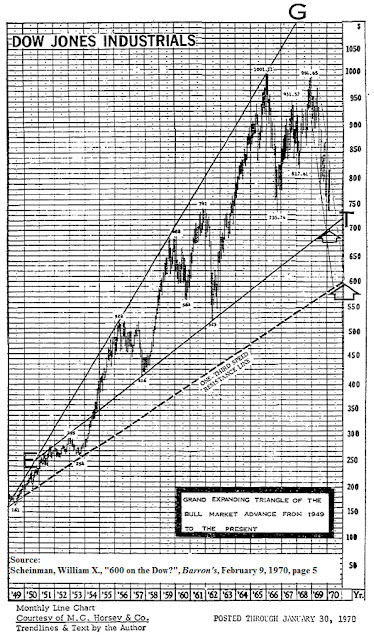
In a February 9, 1970 Barron’s article titled “600 on the Dow?” William X. Scheinman provides an interesting chart of the Dow Industrials (DJI) that outlines what he believes to be the target level that the DJI would fall to before rebounding. This analysis included macro economic analysis that supported the reasons why the Dow was expected to go to 600.

What is most compelling in Scheinman’s analysis is the accuracy of the target level that the DJI was expected to reach. An element that leaves some unanswered questions is that Scheinman had predicted that the DJI would reach 600 within the same year that the article was written. Of course, The DJI didn’t reach 600 until 1974. This has to do with Scheinman’s cycle analysis which is separate and distinct from the topic which we will examine. Being aware of this inconsistency and leaving it aside for the time being, we’ve attempted to understand the rational and methodology of how Scheinman was able to arrive at 600 on the DJI when it was trading at 755.68.

Scheinman indicates that he obtained his method for accurately predicting the level of the DJI from Edson Gould. According to Scheinman, Gould used what is known as the 1/3 speed resistance line measurement to gauge price change and elapsed time which was purported to be two key determinants of crowd psychology in the market. Scheinman goes on to say:

“Resistance lines decline or ascend at one-third or two-thirds the rates of actual declines and advances between significant bottoms and tops. Resistance to advance or decline is frequently encountered at such trendlines; however, if the resistance line is decisively penetrated, the price-action often tends to accelerate in the direction of the penetration.”
In an example provided by Scheinman below, he plots the bull market of the DJI from 1949 to 1970. In that chart, we can see that the dashed line, the one-third speed resistance line, intersects with the 600 level on the DJI.

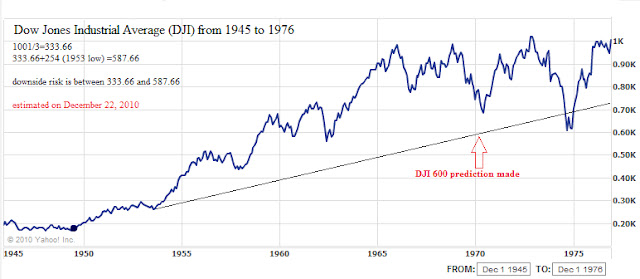
As far as we can tell, the 1/3 speed resistance line is calculated by dividing the peak of the market move by 3.  To be as conservative as possible, we’ve added the 1/3 speed resistance figure to the low of the first major decline in the bull run.  In this case, the first major low in the bull market from 1949 to 1966 was at the 1953 low of DJI 254.  The peak is indicated to be 1001 (1001/3=333.66).  Then we add 333.66 to 254 arriving at a figure of 587.66.  In order to account for the extremes, we assume that 1/3 the peak is the point at which the market finally settles.  In this case, 1/3 of the peak value is 333.66.  We feel that the conservative and extreme values help to establish a range which a market or stock that has had a near parabolic rise will finally settle at or near. 

According to our calculations for the market run from 1949 to 1966, 587.66 and 333.66 were the conservative and extreme downside targets for the market, respectively.  However, in the article, Scheinman says that the potential worst-case scenario level would be 597.61.  For the most part, Scheinman’s estimate was fairly accurate in terms of where the reversal in the market occurred.  The bottom in the stock market took place on December 9, 1974 at the 579.94 level.

In the chart of the Dow from 1945 to 1976 below, it should be noted that a large amount of “overshooting” of the 1/3 speed resistance line occurred when the low did take place in 1974 instead of 1970 as predicted by Scheinman.  In the case of the Dow, the index overshot the 1/3 speed resistance line in 1974 by 15%.  However, the price was well within the established, albeit wide, range of 587.66 to 333.66.

We decided to see how consistent the 1/3 speed resistance line would be if applied to three different situations.  First, we’ll review the bull market in the Dow Industrials (DJI) from 1982 to 2007. Next, we’ll run this model using the Philadelphia Gold and Silver Index (XAU) from the bear market bottom of 2001 to the present.  Finally, we’re going to see how this model works against Netflix (NFLX), a member of the Nasdaq 100, in a real-time example.

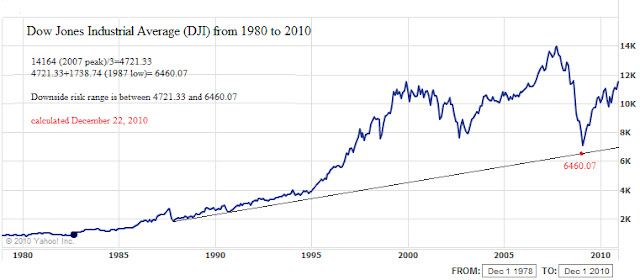
In the case of the bull market run from 1982 to 2007, we divided the peak of the market at 14,164 by 3 and arrived at 4721.33.  We then added 4721.33 to the first major low in the market after the beginning of the bull market which was in 1987 at 1738.74.  The sum of the two figures is 6460.07 for the conservative and 4721.33 for the extreme scenarios. 

When we review the actual bottom in the DJI in 2009 of 6547.05 we can see that the difference between the most conservative estimate and the 2009 low was off by 86.98 points.  There is no instance of the DJI overshooting the 1/3 speed resistance line.  Although coming within 1.5% of an estimated target seems exceptional, the real challenge becomes, would an investor commit money to an investment before the price level actually hits a projected target?  Once invested, could an investor stomach a further decline of 27% or more? [(6460.07-4721.33)/6460.07=26.92%]

In the case of the bull market run in the XAU Index, we divided the peak of the index at 206.37 in 2008 by 3 and arrived at 68.79.  We then added 68.79 to the first major low in the index after the beginning of the bull run, which was at 49.83 on November 19, 2001.  The sum of the two figures is 118.62.  When we contrast the difference between the two numbers, 118.62 and the actual low of 65.72, we see that conservative estimate was accomplished, however a further decline of 45% to below the extreme level was established instead.  Reasonably near the extreme end of the range, but who is willing to hold on after a 45% drop?
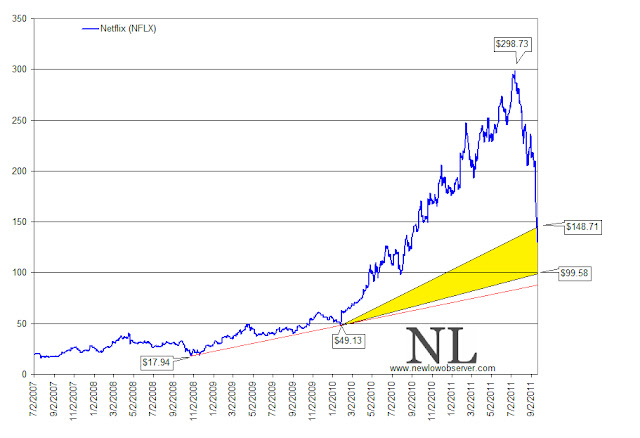
Finally, in reviewing the chart pattern of Netflix (NFLX), we have the peak of NFLX at $298.73.  The conservative estimate for the stock is that it would fall to $148 which has already taken place.  The extreme downside target would be $99.58.  Because of the nature of the rise, we believe that Netflix (NFLX) is slated to fall at least to the $99.58 level. 
If for any reason investors become interested in buying Netflix (NFLX), the ideal time to do it appears to be at a price at or below $99.58.  However, the difficulty may be that the sentiment that pushed the stock price to $298.73 would likely be just the opposite to push the price down.  Only time will tell whether Netflix is going to conform to technical patterns created by Edson Gould.
Please consider donating to the New Low Observer. Thank you.