Category Archives: Edson Gould

CMG Conservative Support Broken, Is $146 Next?

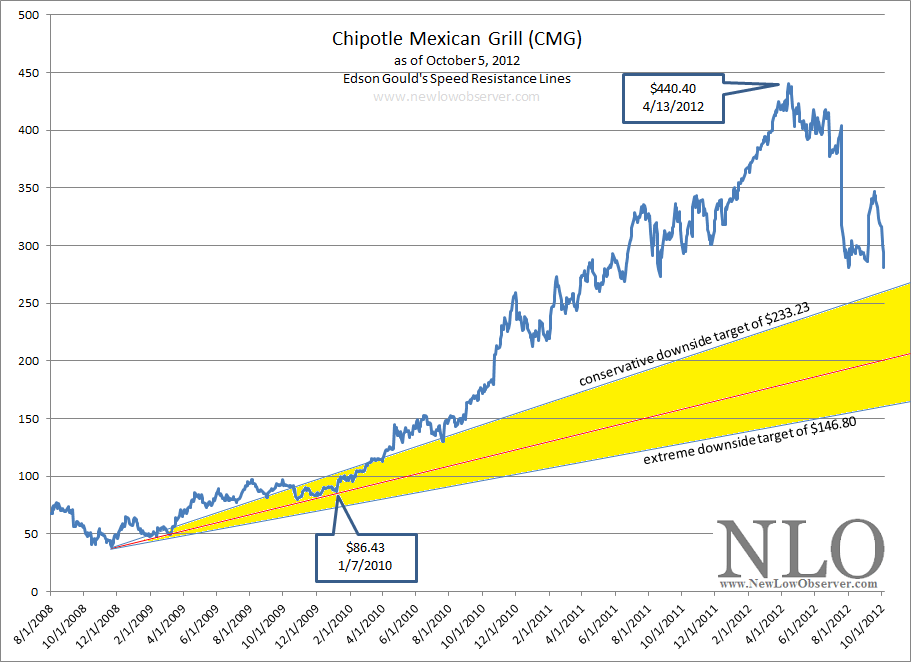
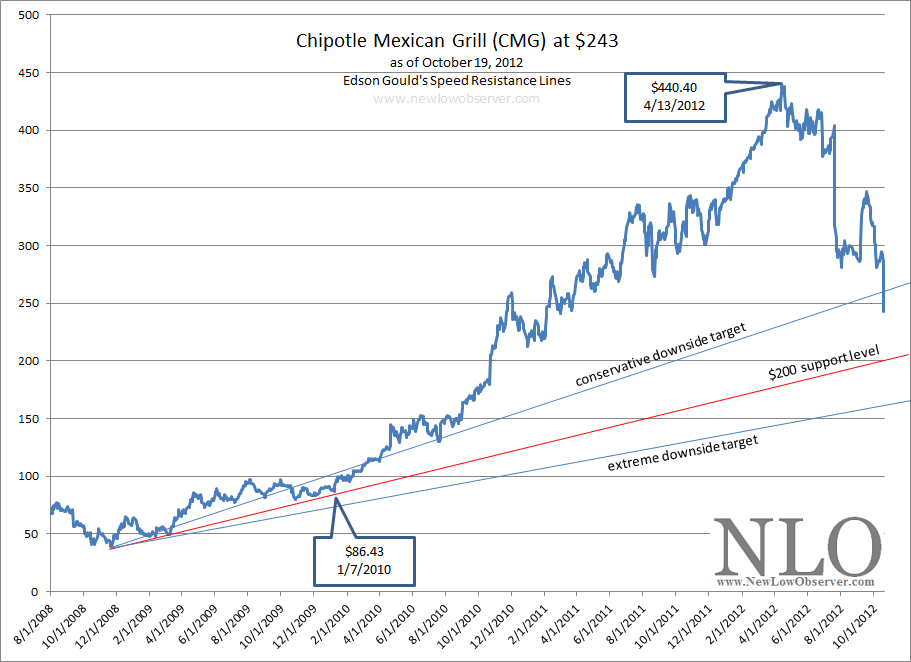
Today Chipotle Mexican Grill (CMG) broke below our conservative downside target support level.  Our downside target for Chipotle is based on Edson Gould’s Speed Resistance Line [SRL] and was initially constructed in our October 25, 2011 article (found here).  In that article, we arrived at a conservative downside target of $200.59.  However, as the price of the stock roses it became necessary to revise the downside target.  A revision of the conservative and extreme downside targets was done on October 6, 2012 (found here).

The chart below graphically represents what we believe is likely to transpire in the short-term:

image

It appears that CMG will decline to $233.23 with a high level of certainty and potentially to the $200 support level as was initially  indicated in our very first SRL analysis done on October 25, 2011.  The only remaining question is whether or not CMG will fall to our extreme downside targets as NFLX and GMCR did when we constructed SRLs for those stocks.

Our extreme downside target of $146 is based on our October 6, 2012 CMG revised target as seen in the chart below:

image

Procter & Gamble: If Overvalued, When Should You Buy?

We read a great article by Vince Martin titled “Procter & Gamble Is Severely Overvalued” (found here).  Martin went through a detailed analysis of the reasons why Procter & Gamble (PG) should be considered an overvalued stock.  Because Martin did not mention selling the stock (a cardinal sin of dividend investors), given such a strongly titled article, we thought we’d try to estimate what the downside risk for PG might be so that investors could prepare for when to buy the stock.

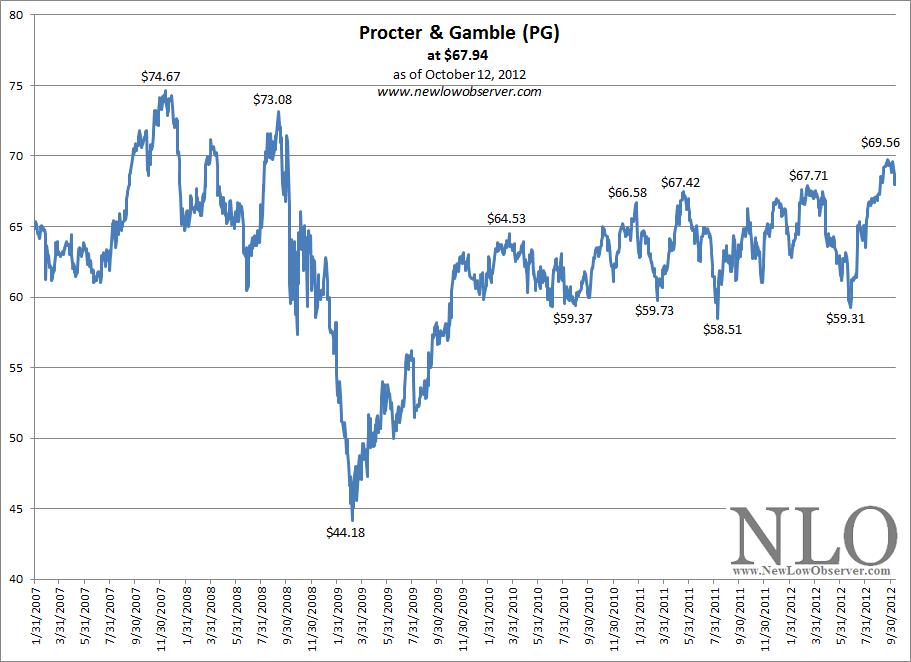
Keep in mind that as of October 12, 2012, Procter & Gamble (PG) has a price chart with the following activity since early 2007:

image

Overall, the price of PG has vacillated widely with a high of $74.67 and a low of $44.18.  Dow Theory suggests that the midpoint of such a range is the dividing line between a stock that is bullish or bearish.  In this case, the midpoint is $59.43.  As can be seen by the rise from the 2009 low, PG has found significant support at or near the $59 level.  This suggests that there is a bullish bias for this stock as accumulation seems to occur just below $60.  Keep in mind that any significant decline below $59 is considered bearish and could be the beginning of a retest of the 2009 low.

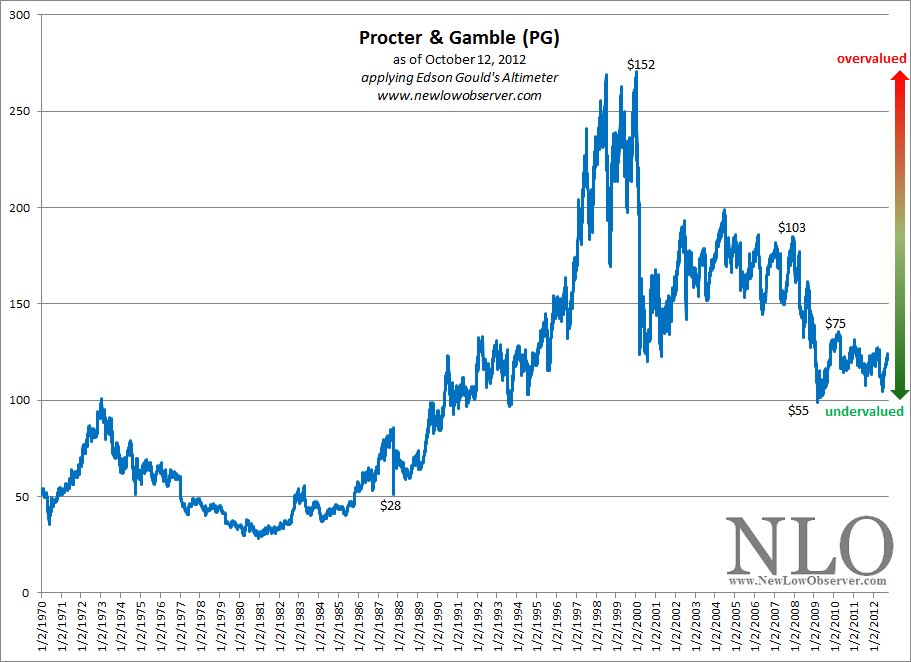
Although the article noted above did not indicate that there was a specific downside target to “fair” valuation or undervaluation, we believe that such a point must exist.  So far, Dow Theory and price activity since 2010 suggests that a fair or undervaluation sits around the $57-$59 level.  However, when viewed from Edson Gould’s Altimeter, PG seems to be trading at the equivalent of 1991 prices as seen in the chart below:

image

Gould’s Altimeter indicates that based on the current dividend, provided there are no dividend increases going forward, PG is undervalued and has critical support at the $55 level.  Any further increases in the dividend will only increase the undervaluation of the PG profile.  For now, Edson Gould’s Altimeter confirms what Dow Theory seems to indicate and that is that at the $55-$59 range, Procter & Gamble should be aggressively accumulated.

Another area of concern is the dividend payout ratio.  According to the article mentioned above:

“Assuming that 2013 dividends are paid at 60 cents quarterly -- a 6.7% raise, lower than any hike in the past decade -- the dividend will have risen 50 percent from 2008 to 2013, a period over which earnings are expected to rise just 14 percent. That is simply not sustainable, and as a result, in fiscal 2013, PG's payout ratio will almost definitely surpass 60 percent. In fact, on a free cash flow basis, PG's payout ratio has already passed that level, jumping from 58 percent in FY2011 to nearly 66 percent in FY2012.”

At some point, the dividend payout ratio can become the Achilles’ heel for PG if earnings aren’t sustainable.  However, we believe that the earnings profile of PG will evolve and remain sustainable over time.  In fact, while Value Line Investment Survey confirms Martin’s expectation for an annual decrease in earnings of -8% for 2013, PG is projected to increase their earnings by +53% in 2015-2017, bringing the fair value estimate of the stock to $97.  This fair value estimate comes with a 100% “earnings predictability” rating from Value Line (dated 9/28/2012).

Obviously, anything can happen with a stock during such volatile times.  However, we believe that Procter & Gamble, while not cheap, is a reasonable stock to accumulate if an investor is looking for a 4 to 6-year holding period.  Aggressive accumulation of PG should take place if the stock declines to $59 and below.

Carbo Ceramics is Worth Considering Now

At the time that Carbo Ceramics (CRR) was trading at $82.79,  we said the following in our May 28, 2012 article (found here):

“Based on the current dividend for Carbo Ceramics, we have anticipated that the stock price will decline to $62.40 before the next buy indication is triggered.”

Interestingly, Carbo Ceramics fell as low as $62.41 on a closing basis on October 10, 2012.  Although this is one penny above the prior $62.40 buy indication, the recent increase of the dividend from $0.24 to $0.27 put the stock well within the buy range, as shown below.  Our estimate of $62.40 was based on Edson Gould’s Altimeter which has given reasonable buy and sell recommendations in the past.

image

As indicated in the chart, there are points where Carbo Ceramics has fallen well below the normal buy range.  On two prior occasions, Carbo Ceramics fell as low as the equivalent of today’s $43.74 and $42.12.  We are not putting it past this company to accomplish a similar decline this time around.  However, this is why we recommend the purchase of this stock in two phases.

image

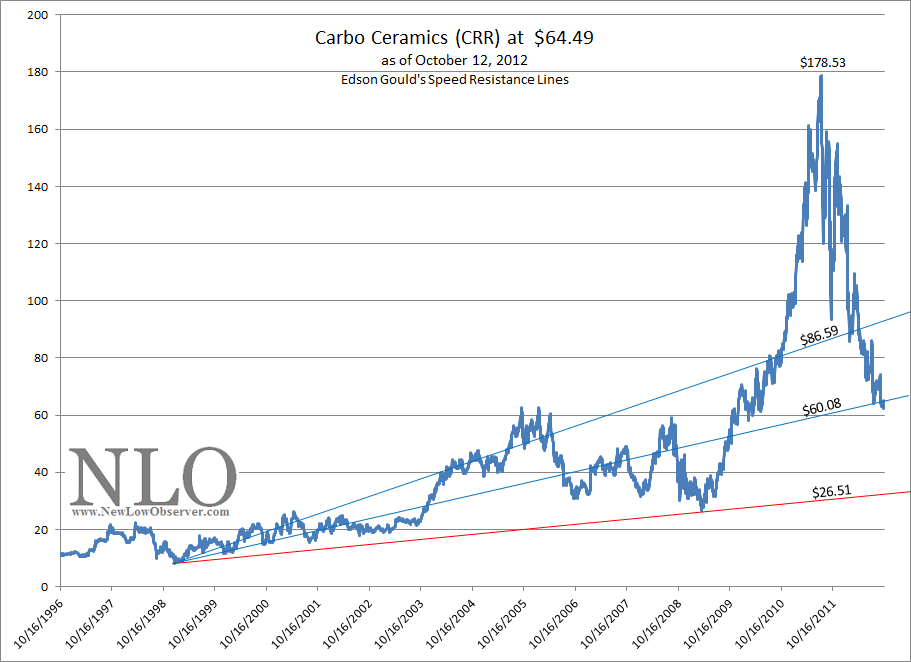
When Edson Gould’s Speed Resistance Lines [SRL] are applied to Carbo Ceramics we can see that the stock has taken back a majority of the gains that have accrued from the 2008 low to the most recent peak.   The SRL indicates that the extreme downside target of $60.08 is about to be reached shortly.  However, there does exist the possibility of going back to point where CRR established its critical support at $26.51.

According to Dow Theory, Carbo Ceramics has the following downside targets:

  • $60.29
  • $43.40
  • $26.51

As indicated in our portfolio (found here), we have already completed the first of the two purchases for CRR and are waiting for either the price to rise to the sell range or decline to the $43.74 level before implementing the next purchase.  The sell range currently stands at $96.

Note: This stock is worth considering only with the appropriate amount of due diligence by confirming the fundamental attributes and proper consideration of the downside risk as indicated above.

Gold Stock Indicator

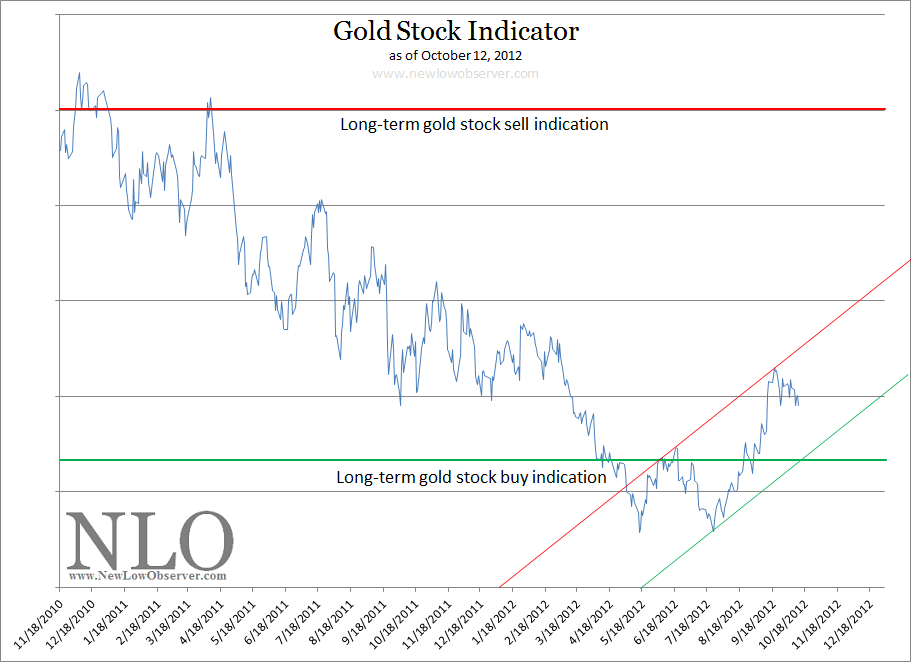
Based on our preliminary work, we believe that gold stocks, as represented by the Philadelphia Gold and Silver Stock Index, will reach our long-term gold stock sell indication between July 15, 2013 and November 25, 2013.

image
This is our best estimate based on the current trajectory of our Gold Stock Indicator. As we get closer to the dates, we will be better able to project the gold stock long-term sell indication with what we believe to be a certain level of accuracy.

This estimate is subject to change if the short-term gold stock buy indication (green diagonal line) is broken to the downside which would bring us back to the long-term gold stock buy indication. The scenario that could easily break the downside trendline is a general stock market decline.  Although Dow Theory indicates that this is a possibility, we're waiting for the appropriate confirmation either up or down. 

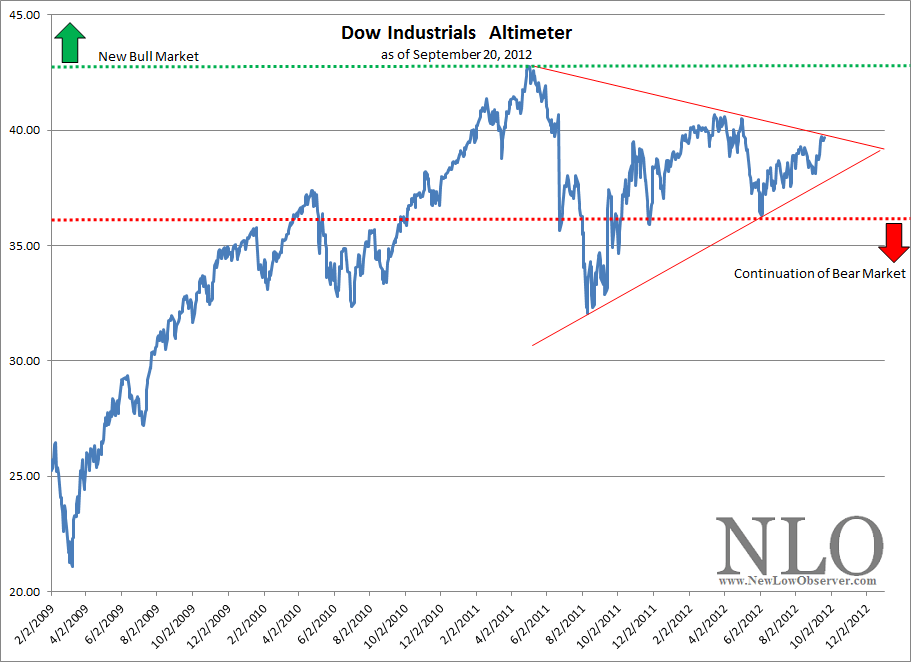
The best example of where the stock market is right now is reflected in the chart below, from our September 21, 2012 Dow Altimeter:

Royal Gold (RGLD) Speed Resistance Lines

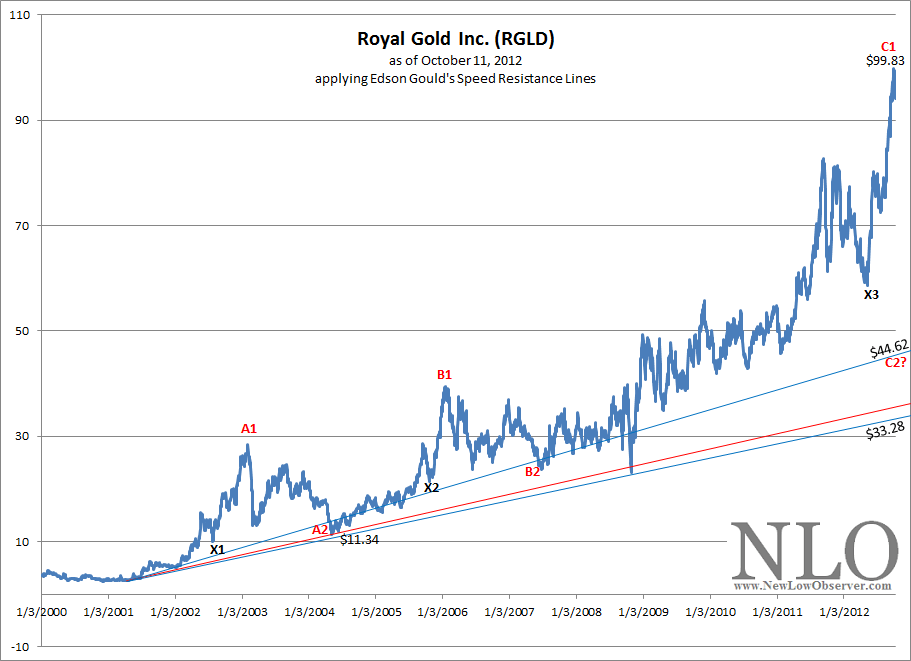
In the chart below we’ve provided Edson Gould’s Speed Resistance Lines (SRL).

image

What is interesting about the above chart is the following:

  • Point A1 to point A2 declined –60%
  • Point B1 to point B2 declined –40%
  • Point C1 to point C2 is a projected decline of –55%

The SRL for Royal Gold at $44.62 doesn’t seem outlandish given what has already occurred in the previous declines from prior peaks.  The X marks the first decline after a “minor” parabolic move that was later exceeded on a larger scale to point A1, B1 and C1.  Additionally, the  X reflects the minimum retracement from the top and has provided consistent support for the price for RGLD.

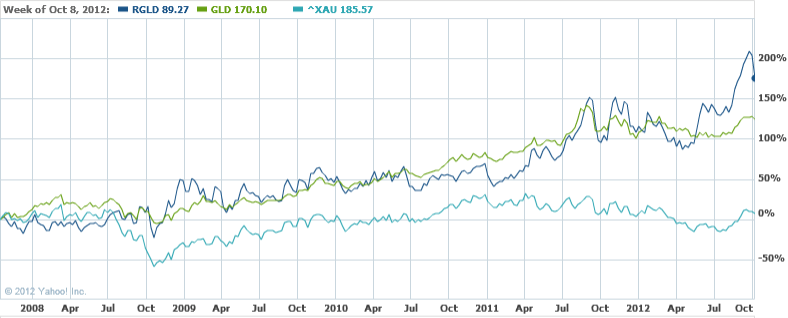
We’d consider buying RGLD if it declines to either of the support levels of X3 or C2.  The movement of RGLD has been consistent with the price of gold (GLD) which is in stark contrast with gold stocks as represented by the Philadelphia Gold and Silver Stock Index (^XAU), as indicated in the chart below.

image

Edson Gould’s SRL: Chipotle Mexican Grill Downside Target Update

In a series of articles examining Edson Gould’s Speed Resistance Lines (SRL), we put some big name stocks to the test.  The test was to see if Gould’s SRL had any reasonable predictive ability to determine the downside targets for the stocks in question.  The results have been astounding and are well worth your careful consideration.

First, we will review the SRLs for Netflix (NFLX) and Green Mountain Coffee Roasters (GMCR) and the outcome of the analysis related to Gould’s indicator.  Next, we will review the updated Chipotle Mexican Grill (CMG) downside target.

The first stock that we applied the SRLs to was Netflix (NFLX) on December 3, 2010.  At that time, NFLX was trading at $205.90.  When the stock rose to the eventual peak of $298.73, we thought that maybe the SRL was a waste of effort.

However, almost one year to the day after we ran the SRL on Netflix, the stock had broke through our conservative downside target of $117.76.  Even more amazing, NFLX later declined below the extreme downside target that we set at $68.63.  Today Netflix trades at $66.56.  Because we’re not short-sellers, we did not take any position on the decline of the stock.  However, we were able to buy the stock at $62 and sell the stock at $100 in the subsequent rebound from the initial low.

The next stock that we applied the SRL to was Green Mountain Coffee Roasters (GMCR) in our October 25, 2011 review of Edson Gould’s formula.  At the time, GMCR was trading at $64.75 after declining –42% from the peak in the stock price on September 19, 2011.  There were some who said that the stock was a bargain and should be bought.  However, Gould’s SRL indicated that at minimum, GMCR was to decline to $59.93 and possibly decline to the $37.21 level.

In a May 2, 2012 revision of Gould’s SRL for Green Mountain Coffee Roasters (GMCR), when the stock was trading at $28.50, we suggested that the stock could trade down to $22.53 with and additional downside target of $8.30.  Today GMCR trades at $22.13 (see chart above).

In the same October 25, 2011 review of Green Mountain Coffee Roasters, we covered Chipotle Mexican Grill (CMG).  At that time, Gould’s indicator suggested that CMG had a conservative downside target of $200.59 and an extreme downside target of $114.16.  As we’ve indicated in the past, SRLs are based based on the highest price the stock attains. In this case, CMG rose as much as +45.70% since our October 25, 2011 article.  Below is the revised SRL for CMG.

image

Based on the high of $440.40, Chipotle Mexican Grill has a conservative downside target of $233.23 and an extreme downside target of $146.80.  We’re cautious about anyone who suggests that CMG is a “good buy” or “undervalued” at the current price. Already, we’re within striking distance of the $233.23 conservative downside target as CMG trades at $280.93 after hedge fund manager David Einhorn recently recommended selling the stock short (article found here).  If past use of SRL is any indication, when CMG declines below the upward trending conservative downside line, you can be assured that the stock will hit $233.

Again, our purpose of using SRLs to determine the downside risk of a stock that we’d like to buy but don’t want to chase.  We’re willing to wait for the eventual decline or admit that we missed the boat on a great investment opportunity.  Again, we don’t sell stocks short because we’re interested in acquiring great companies at the best price possible.

Disclaimer: This piece is a continuation of the examination of Edson Gould's speed resistance line as explained in prior articles. This is not an endorsement to sell short at the current levels nor buy these stocks once falling below the extreme downside targets since the stocks have been randomly selected, at best.

Dow Industrials Altimeter

Below is a chart of the Dow Jones Industrial Average Altimeter.  Our best interpretation of the current altimeter pattern is that the Dow Industrials need to exceed the previous high set in April of 2011 in order for us to feel that a new bull market has emerged.

image

As we’ve described before, the Altimeter reflects the relative value of a stock or index compared to the dividend that is paid.  Those interested in knowing what the dividend for the Dow Industrials is can find that information in Barron’s Market Laboratory section under Indexes’ P/Es & Yields (found here).

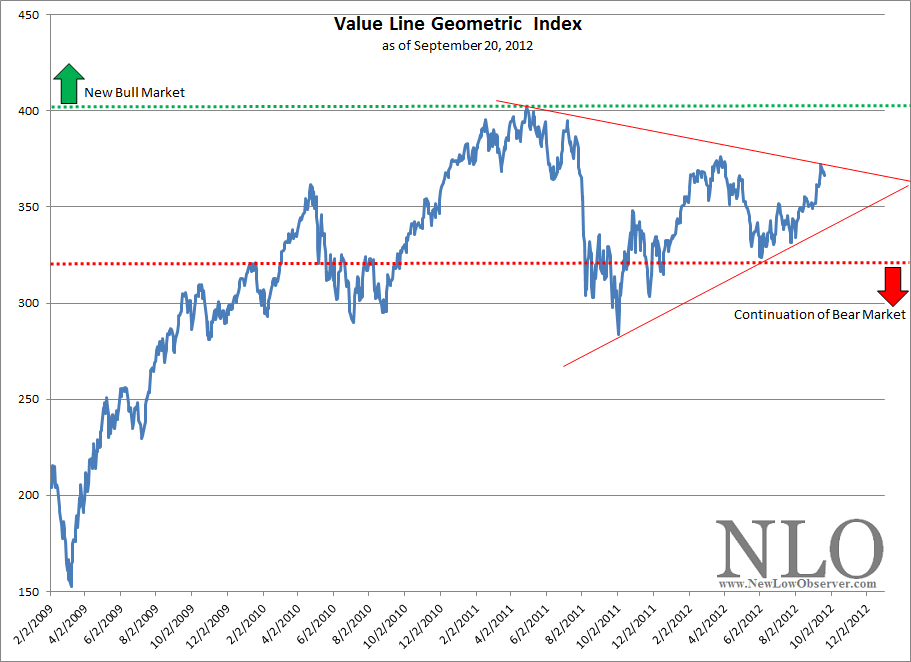
Surprisingly, the formation of the Dow Industrials Altimeter is exactly the same formation as the Value Line Geometric Index, as seen in the chart below:

image

In a previous article (found here), we talked about how the Value Line Geometric Index (VLIC) is an equal weighted index that reflects how all stocks are doing since the bull market began in the first quarter of 2009.  The fact that the Value Line Geometric Index has not achieve a new high suggests that there is limited participation by all stocks in the market. Therefore, confidence in new highs by large cap stocks, as reflected in the Dow Industrials and S&P 500, should not be trusted.

We believe that there is limited upside potential based on the Dow Theory non-confirmation (article found here) and the broader market as reflected in the VLIC Index.

Priceline.com (PCLN) Downside Targets

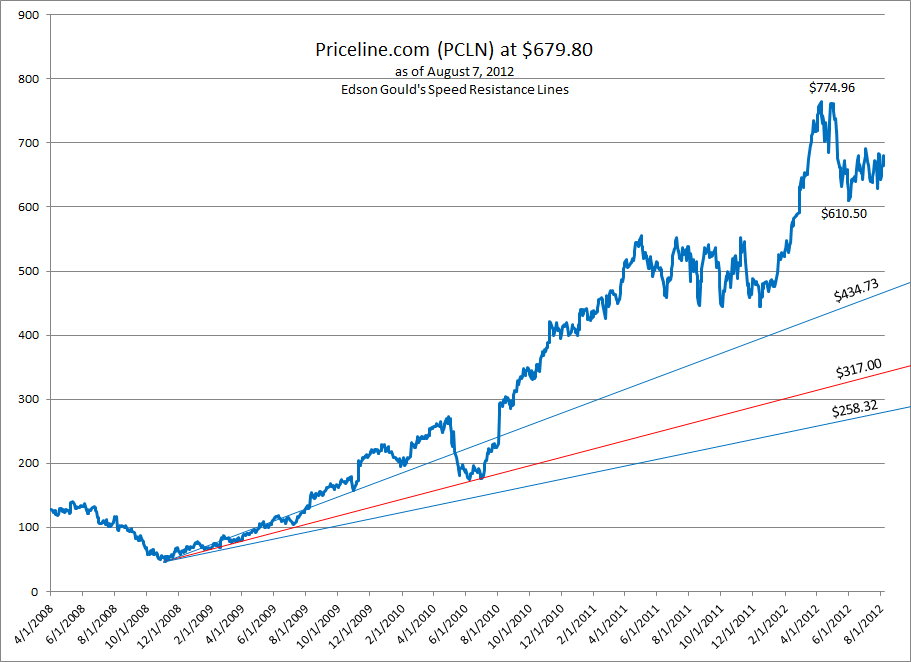
In after-hours trading, Priceline.com (PCLN) has decline below the June 1, 2012 support level of $610.50.  By declining below such a level, it appears that we can project downside targets using Edson Gould’s Speed Resistance Lines.

image

Our current assessment of Priceline.com is far different from our examination of Gould’s Speed Resistance Lines on November 10, 2011 (found here).  As the price of PCLN has increased so does the downside targets. 

Over the next several months, we’ll be able to see if Priceline.com declines to the conservative target of $434.73 and then to the $317 level.  Our extreme downside target of $258.32 appears as an outlier event at this point but will be reconsidered if PCLN declines to $317.

Transaction Alert: Bought XEC at the Market

On July 17, 2012, we have bought Cimarex (XEC) at the market.

On June 8, 2012 (found here), we outlined our rational for buying XEC based on having good management and a consistent dividend policy.  Based on the Altimeter, XEC is considered worth purchasing at $72 and below.  At the current price of $56, XEC would have to increase +28% just to get back to the $72 level.

At the quarterly dividend rate of $0.12, we believe that XEC should be sold at a price of $123 or above. This will increase or decrease with the dividend policy.  Based on the previous Altimeter buy indications, investors should expect to hold XEC for 2 to 3 years before the next sell signal.

*NOTE: In our earlier transaction alert for UNM (found here), we indicated that we would allocate 10% of our portfolio to the stock.  Instead, we have reduced the allocation by half, to 5%, and bought XEC with the other 5%.  This allows us to take advantage of two opportunities which we fully expect to add to as the price declines.

Transaction Alert: Buying UNM at the market

On July 17, 2012, we will buy Unum Group (UNM) at the market.

On July 16, 2012, it was announced that Unum Group (UNM) is going to increase the quarterly dividend by +23.5%, from $0.10 to $0.13 (found here).  The increased dividend is payable to shareholders who hold the stock on or before July 26th. This increase of the quarterly dividend has brought UNM below the Altimeter level that would indicate that the stock should be bought.

On June 18, 2012, we pointed out the reasons why we like the dividend policy of UNM (found here).  Also, the Altimeter readings for UNM based on the new dividend indicates that, at the current price, the stock is relatively undervalued.

Those wishing to follow our strategy of buying UNM should understand that the stock is expected to decline from current levels.  This explains why we're only putting 10% of our portfolio into the stock at the present time.  Our goal is to accumulate more shares as the price declines.

At the quarterly dividend rate of $0.13, we believe that UNM should be sold at a price of $40.95 or above. This will increase or decrease with the dividend policy.  Based on the previous Altimeter buy indications, investors should expect to hold UNM for 3 to 6 years before the next sell signal.

Insurance Watch List: July 3, 2012

The following is one of our personal favorite watch lists. We started tracking the insurance industry in January 2011 and we’re very impressed with the results so far.

Anyone who wishes to be successful in insurance stocks should read the book The Davis Dynasty by John Rothchild. The book starts with Shelby Collum Davis investing approximately $50,000 to $100,000 that ultimately grew to $900 million after 47 years. The strategies employed by Davis seem more accessible to average investors as opposed to Warren Buffett’s leveraged strategies and education from Benjamin Graham.

Symbol Name Price P/E EPS Yield P/B % from low div/share payout ratio
MIG Meadowbrook Insurance 8.75 12.24 0.72 2.3 0.76 5.80% $0.20 27.78%
UNM Unum Group 19.58 25.76 0.76 2.2 0.68 6.59% $0.42 55.26%
WSH Willis Group Holdings 36.8 16.45 2.24 2.9 2.39 11.38% $1.08 48.21%
ORI Old Republic International 8.17 0 -0.5 8.7 0.55 14.27% $0.71 -142.00%
TWGP Tower Group Inc. 21.63 15.83 1.37 3.6 0.78 14.44% $0.75 54.74%
MFC Manulife Financial Corp 11.28 78.88 0.14 4.8 0.86 14.87% $0.52 371.43%
PRU Prudential Financial, Inc. 49 11.81 4.15 3 0.65 15.43% $1.45 34.94%
AIZ Assurant Inc. 35.61 5.94 5.99 2.4 0.61 16.18% $0.84 14.02%
FFG FBL Financial Group Inc. 29.17 39.8 0.73 1.4 0.7 19.06% $0.40 54.79%
XL XL Group plc 21.17 0 -0.23 2.1 0.68 19.67% $0.44 -191.30%

Watch List Summary

The first company on our watch list is Meadowbrook Insurance (MIG).  According to Yahoo!Finance, “…Meadowbrook Insurance Group, Inc., through its subsidiaries, operates as a specialty commercial insurance underwriter and insurance administration services company in the United States.”

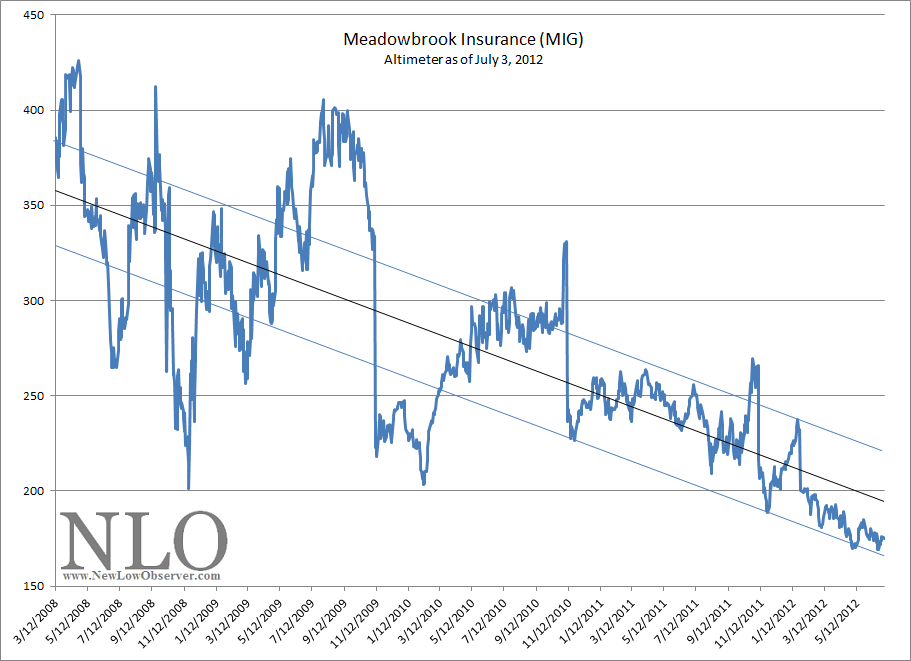
Meadowbrook has had a checkered dividend history.  However, since the reintroduction of the dividend in 2008, Meadowbrook has displayed a declining Altimeter with consistent buy and sell indications.  Below is the Altimeter since March 12, 2008:

image

Again, even though the Altimeter is in a declining trend the more important feature is the consistency of the decline.  Below is the buy and sell indications using this approach:

Date Close altimeter buy/sell % change
4/29/2008 7.45 373 sell -17.18%
6/20/2008 6.17 309 buy 20.58%
9/4/2008 7.44 372 sell -29.44%
10/9/2008 5.25 263 buy 32.76%
1/21/2009 6.97 349 sell -15.49%
2/13/2009 5.89 295 buy 16.30%
5/6/2009 6.85 343 sell -2.34%
11/10/2009 6.69 223 buy 34.38%
6/15/2010 8.99 300 sell 0.67%
11/23/2010 9.05 226 buy 9.94%
10/21/2011 9.95 249 sell -4.62%
11/23/2011 9.49 190 buy 21.92%
1/18/2012 11.57 231 sell -28.26%
estimate 8.3 166 buy 24.70%
estimate 10.35 207 sell  

From the table above we can see that all “buy” indications resulted in an average gain of +22.65%.  The average decline based on sell signals was not as consistent in helping investors avoid major losses as in the case of May 6, 2009 and June 15, 2010.  So far, it appears that if Meadowbrook declines to $8.30 and below it is considered a “buy.”   Based on the declining trend of the Altimeter, the next sell price would be at $10.35 and above.  This would result in a gain of +24.70% if acquired at the $8.30 price.

Meadowbrook has displayed a consistently growing book value since 2008.  Value Line Investment Survey indicates that Meadowbrook (MIG) has a 5-year growth rate of book value at 10.5%.  Although MIG has increased the book value nearly 100% since 2003, the shares outstanding has grown by approximately 80% in the same period of time.   With long-term debt at relatively low levels, Meadowbrook appears to be a reasonable purchase as long as the stock does not exceed 10% of portfolio value.  We are also drawn to MIG’s low payout ratio which allows for some wiggle room in case earnings decline.

Those interested in Unum Group (UNM) will find our view on the company at the following link.  We believe that UNM is a strong buy at $15.54 and below.

The next stock on our list is Willis Holdings Group Plc (WSH).  According to Yahoo!Finance, Willis Group Holdings is “…provides a range of insurance brokerage, reinsurance, and risk management consulting services to its clients worldwide.”

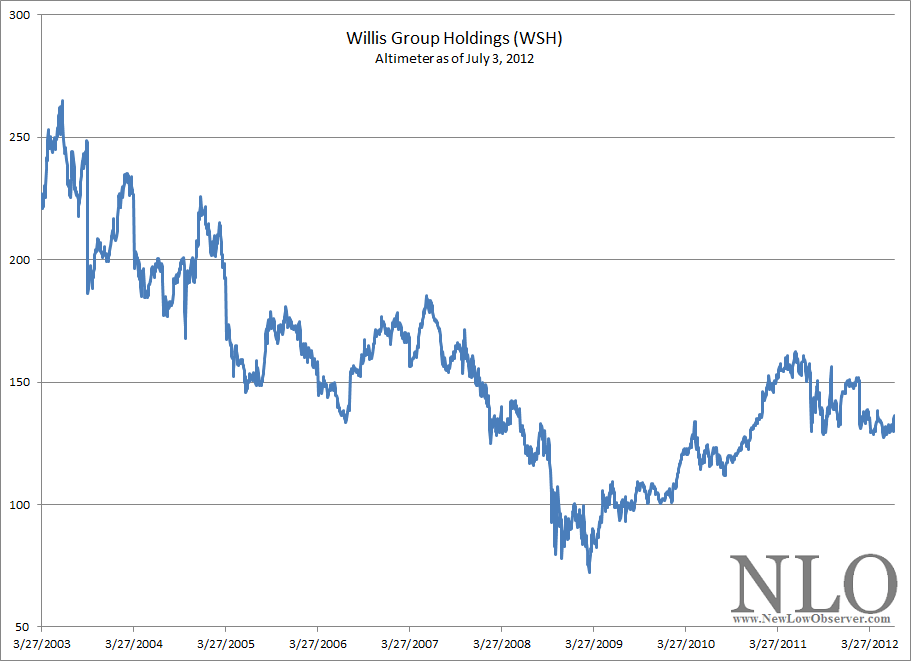
Below is the Altimeter for WSH:

image

Initially, there is very little to make of the movements in the Altimeter for Willis Group Holdings.  For this reason, we’ve applied Dow Theory to the 2009 low to the 2011 high.  According to Dow Theory, the downside targets, based on the Altimeter, are:

  • $35.64
  • $31.59 (fair value)
  • $27.54
  • $19.44

Willis Group Holdings’ ability to stay above the $35.64 would be very constructive.  However, at the current trading price of $37.64, we wouldn’t be surprised to see the stock decline to the $31.59 level before re-testing the $36.90 level.  According to Morningstar.com, Willis Group Holdings has had a steady dividend payment with reasonable increases in the last few years.  We would consider acquiring WSH at levels below $31.59.

Gold Stock Indicator Update

Our Gold Stock Indicator, as seen below, is going on an interesting ride.

image

On May 27, 2012 (found here), we did an appraisal of the gold situation and said the following:

“…in all instances of an initial ‘short-term buy indication’ [green arrow] (except August 8, 2011), the Gold Stock Indicator was followed by a second opportunity to buy [red arrow] NUGT, sometimes at lower levels.”

In the chart above, we show a red arrow between May 3rd and June 28th.  It is important to take note of the fact that even though the Gold Stock Indicator is currently at the exact same level as on May 3rd, the price of NUGT is more than $1.00 below the May price.

So far, it appears that NUGT is on course to provide us with the second opportunity to take a position, as we have anticipated.  In prior moves from the short-term buy indication to the short-term sell indication, the Gold Stock Indicator has “double dipped.”  By double-dip we mean that the price of NUGT has declined the short-term buy indication a second time before making an assault on the long-term sell indication.

Our only question at this time is how far must NUGT fall before it reaches the short-term buy level.  If the most recent comparison between May 3rd and June 28th is any indication, then it is possible that NUGT could decline as low as $6.

Unum Group (UNM) is Closing in on New Low

The latest insurance stock that has caught our eye is Unum Group (UNM) which is closing in on a 3-year low.  Prior to 1998, Unum Group had a dividend increasing history of 11 years at a compounded annual growth rate of 17.66% according to Moody’s Handbook of Dividend Achievers.  After 1998, Unum was challenged significantly resulting in a deep reduction of the dividend.  Most important to investors is the fact that after the -50% reduction of the dividend in 2003, the annual dividend remained at $0.30 for six years until 2009.  Since 2009, UNM has increased the dividend each year thereafter.  The handling of the dividend policy is important for several reasons:

  1. Cutting the dividend in 2003 was an accurate move by management since the book value declined -31% from the 2002 high to the 2008 low.
  2. As a financial services company, keeping the dividend the same through the financial crisis of 2007 to 2009 meant that the management team believed that stability had returned to the company.
  3. Raising the dividend after the financial crisis means that the management team believed the prospects for the company were improving.  After 2008, the book value for UNM has increased +51% which supports management’s decision.

We welcome a dividend cut when appropriately applied, even if the conditions that brought on the cut were based on management’s prior “bad” decisions.  In our view, the true test of any management team is not always generating blowout earnings but handling errors in an appropriate fashion.  UNM’s management has done all the right things at all the right times relative to the economic backdrop that we’ve experienced.

However, while we favor the actions of the management at Unum Group, we also need a sense of perspective on the most opportune time to actually buy the stock.  Two things that never change regarding the historical information on a stock is the dividend paid and the stock price.  This is why we prefer to look at Edson Gould’s Altimeter which reflects the stock price relative to the dividend that is paid.

image

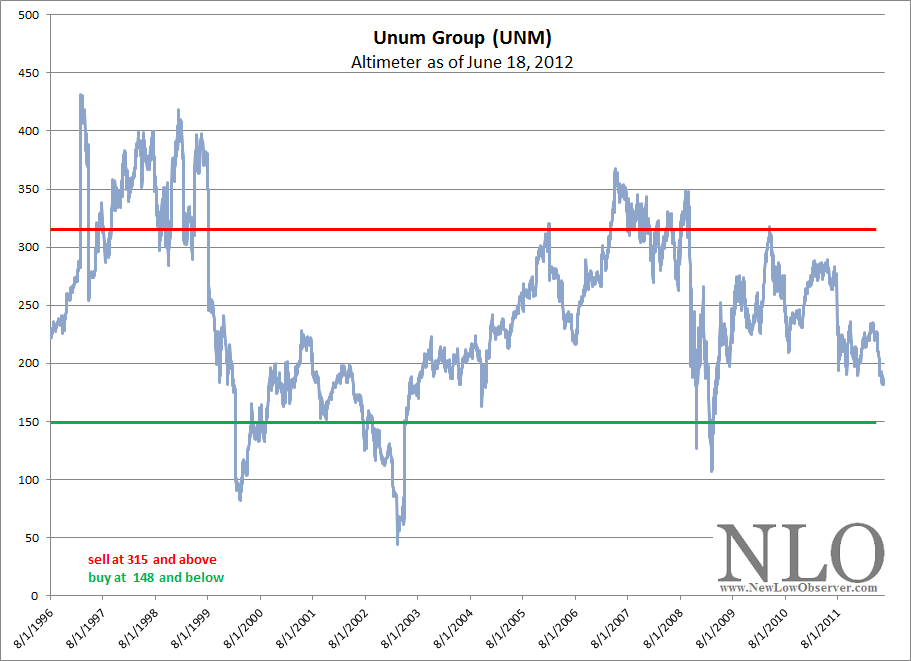
From our perspective, the movements of Gould’s Altimeter indicate that the stock should be bought at or below 148 and sold above 315.  Each time UNM has traded below or above the respective range, the following increase or decline followed:

Date Altimeter stock price buy/sell % change
2/25/1997 431.69 39.5 sell -59.97%
2/10/2000 106.82 15.81 buy 52.12%
1/27/2006 320.67 24.05 sell -60.58%
11/20/2008 126.40 9.48 buy 178.59%
4/14/2010 318.19 26.41 sell ????????
????????? 148.00 15.54 buy  

While we can’t be certain that UNM will replicate prior declines, a decline to the projected level of $15.54 seems well within reach as the stock currently trades at $19.26.  This would only be a decline of -41%, which is far less than previous Altimeter lows of –59% and –60% in 1997 and 2006, respectively.

According to Dow Theory, UNM would reach the 50% level at a price of $17.33.  Typically, the 50% level is the “make or break” level in the stock’s price.  If the stock can manage to stay above $17.33, then a majority of the shareholders since the 2009 low would be satisfied enough not to abandon the stock.  However, if the stock falls materially below the $17.33 level (say $17 or $16.50) then it would mean that most “long-term” holders of the stock are experiencing a loss and are seriously contemplating selling the stock.  The Dow Theory downside targets are as follows:

  • $14.08
  • $10.84
  • $7.60

Although UNM could be bought at $15.54 based on Gould’s Altimeter, it should be understood that there are likely to be further declines.  Therefore, an investor should not become disenfranchised with Dow Theory downside targets.  Instead, investors need to allocate appropriate amounts of capital and break up the intended purchase into 2 or 3 transactions.

Buckle (BKE): A Review

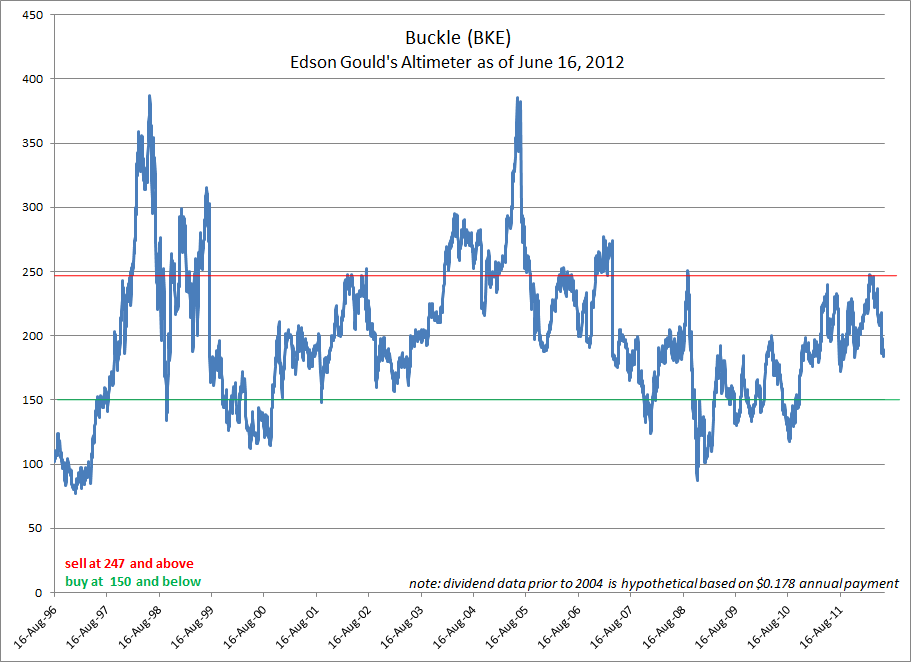
The following is a review of Buckle (BKE) using Edson Gould’s Altimeter.

image

Below is the performance of the buy and sell indications of Edson Gould’s Altimeter based on periods when the indicator first cross below 150 for buy indication, and above 247 for sell indications.

Date Price Altimeter buy/sell % change $1 invested
6/12/1997 6.57 148 buy 69% $1.69
1/28/1998 11.13 250 sell -47%  
10/8/1998 5.95 134 buy 85% $3.13
11/6/1998 11.01 248 sell -41%  
11/4/1999 6.51 146 buy 69% $5.30
3/19/2002 11.01 248 sell 120%  
11/19/2007 24.26 146 buy 72% $9.13
9/18/2008 41.78 251 sell -43%  
10/23/2008 23.94 144 buy 107% $18.90
3/9/2012 49.56 248 sell -39%  
????????? 30 150 buy ?????????  

The consistency of the indicator is amazing.  Only the sell indication of March 19, 2002 resulted in an outcome that was contrary to the desired result.  Even so, A person who only bought BKE based on the buy signal and sold based on the sell indication would have resulted in a gain of 1,890% from June 12, 1997 to the present.  This is compared to the buy and hold total return with reinvestment of dividends (including special dividends) of 766.21%.  Based on capital appreciation alone, the price of BKE rose 498% since June 12, 1997.

  • +1,890% (buy/sell Altimeter)
  • +766% (dividends reinvested)
  • +498% (based on price change only)

In the table above, the section in blue is the tentative estimate of when the next buy signal will be registered and the amount of decline necessary to get to the signal.  It appears that based on the sell indication from March 9, 2012 to the price of $30, BKE would have to decline -39% using the Altimeter.  Such a decline is well within the prior successful sell indications that resulted in losses.

We are very interested in this stock at the right price.  We believe that BKE will be a buy at $30 and below.  However, prior price movement based on Gould’s speed resistance lines indicated that the conservative downside target is $24.47 and the extreme downside target of $16.68.

Historically, based on prior Altimeters, a buy indication does not mean that the price decline has actually ended. Therefore, if the buy indication is triggered then be prepared by making your purchase of the stock in, at least, two stages. Once at the trigger price and again at any desirable price lower than the trigger level.

Investment Observation: Markel (MKL) at $433.72

According to Value Line Investment Survey, “Markel Corp. markets and underwrites specialty insurance products and programs to a variety of niche markets.” When reviewing the Value Line tear sheet on Markel, there are a couple of items that make the stock very compelling.

First, Value Line indicates that the company has a fair value of 1.5 times the book value. Using the most conservative full year data from 2011 provided by Value Line, Markel has a fair value of $528.15 which is a 20% premium above the current market price of $439.77. Value Line estimates that by 2017, Markel would have a book value of $447. This implies a fair value of $670.50. Assuming that Markel only achieves half of the projected growth in the book value, the fair value would be at $599. Considering that Markel typically trades above fair value, the prospects are reasonably favorable.

Next, Markel has increased their book value from $49.16 in 1996 to $352.10 in 2011. With Markel having the ability to consistently increase their book value at double digit rates is phenomenal in our view. As an added benefit, Markel has only increased the number of shares outstanding from 5.46 million to 9.62 million in the period from 1996 to 2011. This suggests that the growth of the company has not come at the expense of the shareholders.

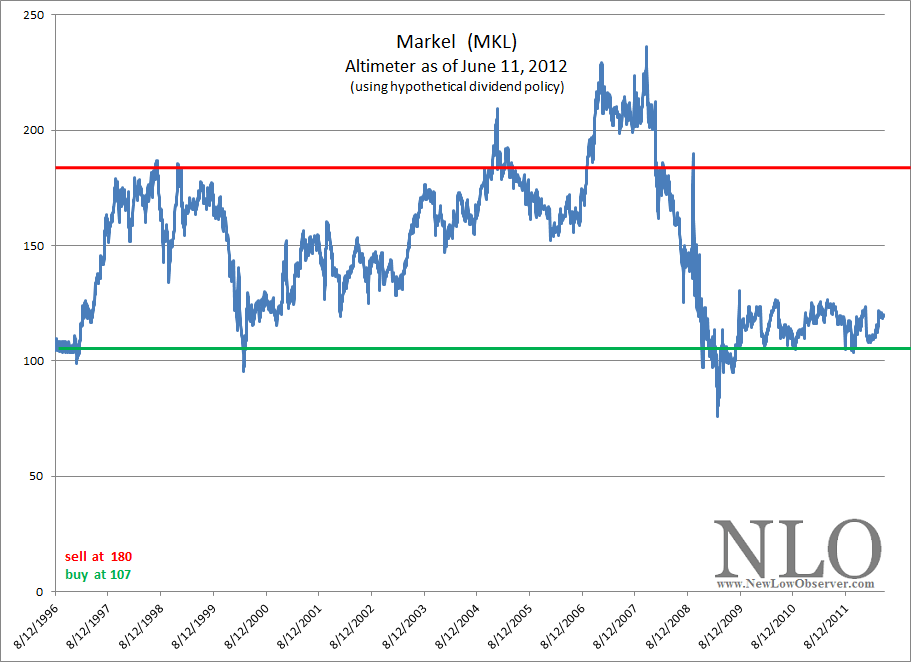
We have constructed an Altimeter for Markel (MKL) that is based on a hypothetical dividend assuming an average payout from earnings of 13%  and a compounded annual growth rate (CAGR) of the dividend at 9.9%.

image

Although hypothetical, our assumptions of a dividend policy is the most conservative possible.  We believe that, if compelled, Markel could easily maintain such a dividend policy while increasing the book value.  Whenever, the Altimeter is above 180, the stock should be sold and whenever it is below 107, MKL should be bought.  Below is the performance of the stock price when it falls within the parameters previously noted.

Date Price Altimeter buy/sell % change
2/23/1996 87 106 buy 106.61%
6/8/1998 179.75 182 sell -31.99%
3/6/2000 122.25 103 buy 157.67%
10/5/2004 315 181 sell -22.14%
11/20/2008 245.25 97 buy ????????

An alternative strategy, for investors with a long-term perspective, could be to accumulate the shares of Markel at or below 107 on the Altimeter (currently $395.90) without consideration of selling.  We feel this would be a prudent stance since the declines experienced by the stock at the “sell” indications are not meaningful enough to warrant actually selling the stock by the time the next “buy” indication is given.

Finally, our concern for the worst case scenario is always in the back of our mind.  For this reason, we assume that the lows of 2009 will be revisited and ask ourselves are we able to handle such a situation.  If based on the Altimeter low of 2009, Markel could decline as low as $281.20.  Our hope is that such a low is not visited again.  However, with the aid of Dow Theory, we are prepared to accumulate additional shares when, and if, such an opportunity arises.

Cimarex (XEC) at a New Low

Today, Cimarex (XEC) hit a new 1 and 2-year low as the energy sector continues to fall apart.  We like Cimarex (XEC) because it is a spin-off from Helmerich & Payne (HP) which has had a tremendous dividend increasing history.  Additionally, we have been very fortunate in being able to call most of the peaks and troughs in the price of Helmerich & Payne found at the links below:

Cimarex appears to be willing to continue the conservative management style that got Helmerich & Payne through hard times in the oil drilling industry during the 1980’s and 1990’s.  Therefore, we believe that Cimarex should be on your watch list as well.

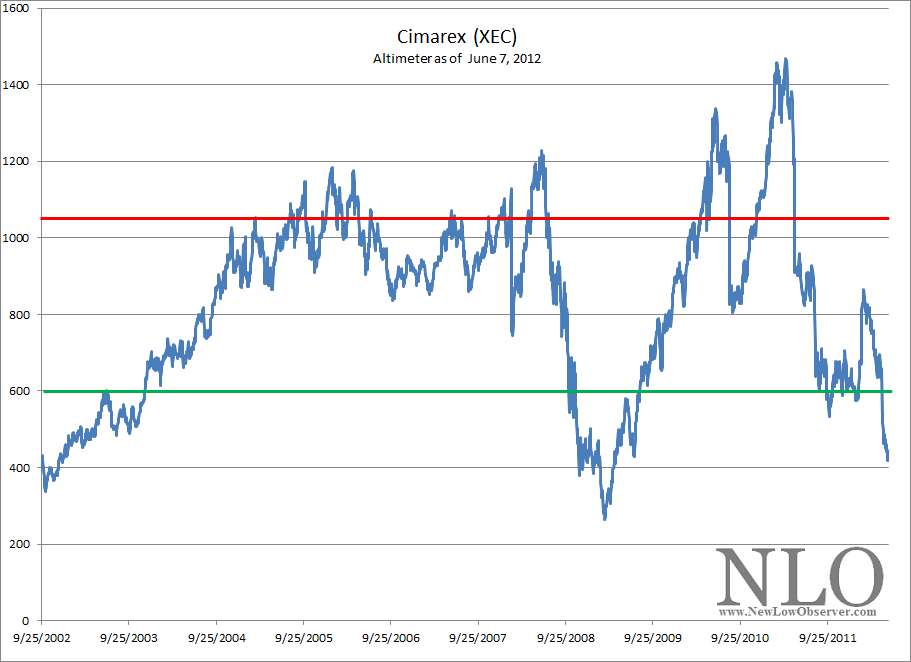
Below is the Altimeter for Cimarex since being spun off from Helmerich & Payne:

image

note: dividend data prior to 2006 is hypothetical based on $0.04 quarterly payment

We believe that whenever the Altimeter is trading at or above 1032 the stock should be sold.  Additionally, whenever Cimarex’s Altimeter is trading at 600 or below, the stock should be considered for acquisition.  Below is the performance of buy and sell indications based on the Altimeter levels just mentioned:

Date Price Altimeter buy/sell % change
6/26/2003 23.96 599 buy 72.29%
3/3/2005 41.28 1032 sell -47.25%
10/10/2008 32.66 544 buy 90.02%
3/11/2010 62.06 1034 sell -42.18%
8/22/2011 59.81 598 buy ??????????

Our expectation is that Cimarex may decline as low as, and possibly lower, than the 2009 level on the Altimeter.  That would equal a price of $31.80, or -30% from the current price.  A purchase of the stock at this time may be warranted, based on the Altimeter.  However, be prepared to buy more at lower prices.