Dividend Achiever Watch List

At the end of the week, my watch list contains 22 companies. Here is my watch list for March 12, 2010.

Symbol Name Price % Yr Low P/E EPS Div/Shr Yield Payout Ratio
XOM Exxon Mobil Corp. 66.80 5.10% 16.78 3.98 1.68 2.51% 42%
AWR American States Water 32.50 8.62% 20.06 1.62 1.04 3.20% 64%
MON Monsanto Company 72.35 8.68% 26.03 2.78 1.06 1.47% 38%
FPL FPL Group, Inc. 47.07 8.83% 11.86 3.97 2.00 4.25% 50%
CWT California Water Service 36.55 9.14% 18.74 1.95 1.19 3.26% 61%
WTR Aqua America, Inc. 16.88 9.68% 21.92 0.77 0.58 3.44% 75%
TMP Tompkins Financial Corp. 37.98 10.09% 14.12 2.69 1.36 3.58% 51%
T AT&T Inc. 25.62 10.48% 12.08 2.12 1.68 6.56% 79%
THFF First Financial Corp. 28.06 10.78% 16.22 1.73 0.90 3.21% 52%
MLM Martin Marietta Materials, Inc. 82.06 11.24% 42.96 1.91 1.60 1.95% 84%
LKFN Lakeland Financial Corp. 18.02 11.30% 14.30 1.26 0.62 3.44% 49%
WMT Wal-Mart Stores, Inc. 53.90 13.91% 14.57 3.70 1.21 2.24% 33%
UMBF UMB Financial Corp. 40.48 14.03% 18.40 2.20 0.74 1.83% 34%
BRO Brown & Brown, Inc. 17.67 15.04% 15.78 1.12 0.31 1.75% 28%
NTRS Northern Trust Corp. 53.97 15.52% 17.08 3.16 1.12 2.08% 35%
WEYS Weyco Group, Inc. 23.95 15.81% 21.58 1.11 0.60 2.51% 54%
SHEN Shenandoah Telecom 18.71 16.21% 30.18 0.62 0.32 1.71% 52%
UGI UGI Corp. 25.47 17.05% 11.52 2.21 0.80 3.14% 36%
WGL WGL Holdings Inc. 33.67 17.77% 14.96 2.25 1.51 4.48% 67%
RBCAA Republic Bancorp, Inc. 17.64 18.31% 8.73 2.02 0.53 3.00% 26%
SYBT S.Y. Bancorp, Inc. 23.19 19.66% 16.68 1.39 0.68 2.93% 49%
SRCE 1st Source Corp. 16.66 20.38% 21.09 0.79 0.60 3.60% 76%
22 Companies

Watch List Summary 

The best performer from last week's list once again is 1st Source Corp. (SRCE) which rose 2.8% or 11% in two weeks. The worst performing stock is American State Water (AWR) which fell 6.1%. Overall watch list fell 0.5% vs the Dow gain of 0.5% and the S&P 500 gain of 1%.

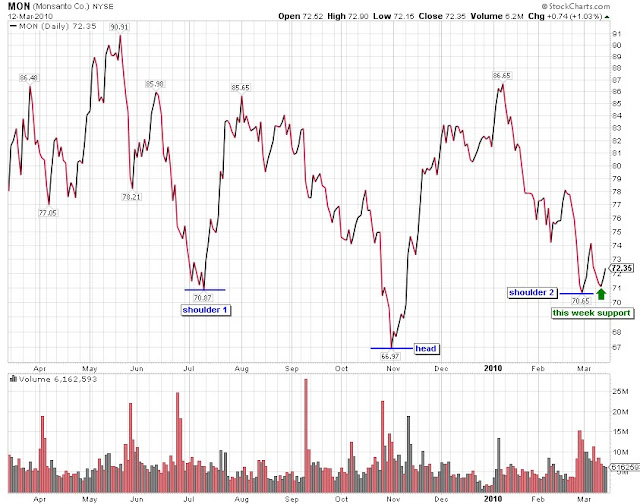
Exxon (XOM) remain a great bargain in our view. This largest market cap company has been within the 10% range for 8 consecutive weeks. Once again, I'd like to flag Monsanto (MON) technical pattern for another week. The head-and-shoulder pattern remained strong this week when the stock held above the $71 level. The team at New Low Observer have long positions in XOM and MON. - Art

Email our team here.

Lessons Learned From Our Worst Picks

In response to our “Worst Performing Picks” article, a reader asks:
“Is there some common trait among these 5 that, if known, could be used as a red flag or indicator not to repeat a future sub-optimal purchase?”
Touc’s response:
This is the payoff question and is worth its weight in your favorite commodity.
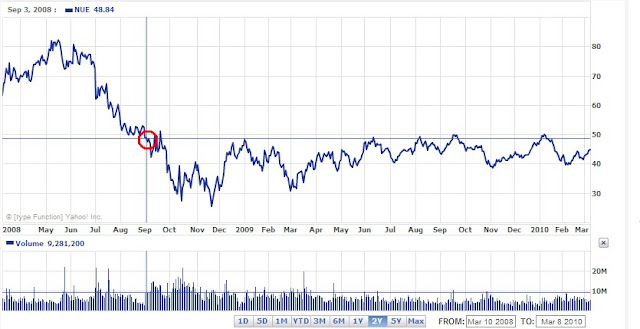
First and foremost, in four of the 5 stocks, we didn’t adhere to our own rules. One rule is to side-step stocks that have had recent cuts or no annual increase in the dividend. At the time, we didn’t wait to confirm if Masco (MAS) would increase the dividend in April 2008. Also, we didn’t wait to see what would happen after the dividend cut by Nucor (NUE) in March 2008. The concept of confirmation is incredibly important in Dow Theory, by ignoring this principle we cornered ourselves with bad recommendations.
What we should have done is wait one full year after the cut, or lack of an increase, to determine the viability of the company. Keep in mind that a cut in the dividend isn’t a death sentence. In fact, cutting the dividend might be the best management move to make. However, current shareholders of the company might abandon the stock if they have a policy to hold stocks with a steady dividend (as we advise investors to do.) We jumped the gun on Masco (MAS) and Nucor (NUE) when all the economic tealeaves were saying things weren’t looking good. I mean, how could we ignore the fact that a home building supplier and a steel maker were going to have some troubles with a declining housing market?
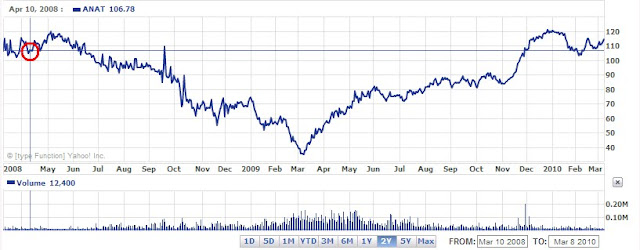
The next rule of ours that we violated was not issuing a sell on Illinois Tool Works (ITW) and American National Insurance (ANAT) after substantial gains in a short period of time. Illinois Tool Works (ITW) rose 9% in one month while American National Insurance (ANAT) rose 15% in less than one month. It is not that we want to be traders however, if the market gives you in one month what is considered to be the historical annual average gain over the last 100, 50, 25, and 10 years then we should thank our lucky stars and move on. In the 15 recommendations that were made in 2008, 10 were successful and exceeded the historical long-term market averages. We had nothing to prove yet we managed to allow these opportunities to get away from us.
On the matter of Mine Safety Appliance (MSA) there are no explanations for the reason this didn’t succeed. To think that we’d be 100% on the mark every time would be fooling ourselves. Mine Safety Appliance (MSA) was simply a bad recommendation on our part, that is, unless you bought the stock at substantially lower levels.
There are several points that must be made about our investment strategy. First, we’re trying to take responsibility for the recommendations that we make. We don’t want to make a recommendation and leave it hanging out there in the open without accountability. Too often we see Strong Buy, Buy, Accumulate, Strong Conviction, Hold, and Market Perform recommendations without the clarity that is needed for investors. Adding to the lack of clarity is the issue of the absence of sell recommendations. Our Investment and Speculation Observations are meant to alert an investor to start their own research. Our Sell recommendations are meant to alert investors that exceptional gains have been made, compared to the historical average, and that selling wouldn’t be the worst strategy. Although we issue sell recommendations, investors can clearly chose what they wish to do if they actually bought a stock that we issued an observation on.
We also want to demonstrate that what we’re doing is a matter of discipline that can be applied by anyone. We’d like to believe that what we’re doing is more than just randomness and luck. We’ll probably be proven wrong soon enough. However, until that time comes we’ll continue to gladly show our mistakes that happen to be exceptions that prove our rules.
When we make a recommendation, our goal is to buy the stock at a lower point than the recommended date. We assume that an investor or trader has to do some due diligence before deciding to invest in our recommendations. This means that if the stock ran up then don’t buy but if the stock fell since the recommendations and the fundamental attributes are intact despite the relatively low price then an acquisition of the stock might be in order.
Finally, we use the investment/speculative observation date and price as the worse case scenario for our recommendations. We hold ourselves to this as an objective measure of whether we’re making the right calls or not. If we’re right then great however, if we’re wrong then we modify the method. Since codifying our approach, as outlined in the About This Site section, we’ve had very little need to make changes. Make no mistake we’re ready and willing to change if necessary. So far we’re able to say that luck has been on our side for quite a while.
-Touc 

Email our team here.

Values According To S.A. Nelson

S.A. Nelson is credited with coining the term "Dow's Theory." In fact, Nelson tried to convince Charles Dow to write a book about his articles in the Wall Street Journal but did not succeed. After failing to get Dow to write a book, Nelson wrote his own based on Dow's writing. The book titled ABC of Stock Speculation neatly lays the groundwork for Dow's Theory to be recognized and interpreted throughout history.
In one excerpt from the book A Treasury of Wall Street Wisdom, Nelson says:
"...stocks have recovered after artificial depression and relapsed after artificial advances to the middle point which represented value as it was understood by those who bought or held as investors."
This means that if an index or stock that has fallen below the halfway point of the previous advance or risen above the halfway point of a previous decline, then the index/stock is either undervalued or overvalued. If the index/stock has fallen close to the prior level of where the advance started and the index/stock is still fundamentally sound then the index/stock could be considered extremely undervalued. Likewise, if the index/stock has risen far above the prior high then it is considered overvalued.
When I start to consider investing in an individual stock, I only want to know if the price of the stock has reached a new 1-year low. From this vantage point, I can determine if the stock is trading at an extreme relative to the halfway point of the previous advance and decline. Again, this approach can only work if the company is generally in fair condition. This means that earnings exist, the dividend payout ratio isn't too high and management has a track record of rewarding the shareholders and etc.
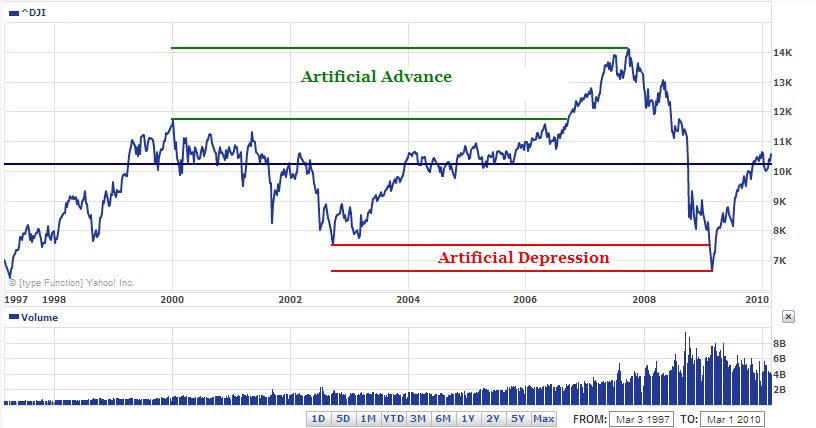
The halfway point of the previous advance or decline is the point at which "long-term" investors would consider the stock or index fairly valued. Traders can take advantage of this fact and use it to their benefit. In the chart below, I show the Dow Jones Industrial Average since 1997.
What is important to notice is that the artificial advance and artificial depression meet at the halfway point of 10,302.31 (dark blue horizontal line.) If drawn backwards to the point when the Dow first went above 10,000, we can see an enormous amount of time spent at or around 10,302.31 (as is currently the case.) This indicates that, for now, "long-term" investors fairly value the market at around the 10.3K level. 
Take note of the fact that the Dow volume has fallen as the index has risen since the March 2009 bottom.  This is in stark contrast to the bottom in 2003 which had volume more or less in a flat to higher range.  As it stands, we have the upside limit to this market at the 11,722 level.  Basically, we're still in a bull market rally, or cyclical bull, within the context of a secular bear market. 
-Touc
This article was originally published in May 2009 on our former site Dividend Inc.

Celebrating Market Gains by Reviewing Our Worst Performing Picks

While champagne glasses are being raised to celebrate the nearly 62% increase in the Dow Jones Industrial Average over the bottom that was reached on March 9, 2009 we’d like to outline some of our worst performing research recommendations as part of our former website at Dividend Inc. We’re not surprised at the markets rise as outlined in our article on SeekingAlpha.com titled “The Importance of Market Perspective” issued in February 2009. Our only concern now is how much further the market could go before a mild decline of 30% or so.
As you may know, even in the worst environment for investing in stocks (during 2008) we still made recommendations for investors to look out for as new investment opportunities. Of the 15 companies that we recommended in 2008, only five under-performed. However, anyone who actually put money in these five stocks might have lost a large portion of their assets if they didn’t sell early enough.
First on the list is Mine Safety Appliance (MSA) which fell 61.93% from the Research Recommendation date to the lowest point on March 9, 2009. Almost as soon as we made the recommendation the stock fell to $35 a share from $41.61. The stock moderated for a couple of months until it finally collapsed in early October. (MSA) discontinued its policy of increasing the dividend every year which is a warning sign for the future outlook on earnings. Adjusted for dividend payments, (MSA) is in the lose column to the tune of –32.19%.
Next on our list is Masco Corp. (MAS). (MAS) also took an incredible dip right after the recommendation. Falling from $19.43 all the way down to $14.00. After a rise all the way back to the recommendation level of around $19, (MAS) made the amazing march down 81.27% to the March 9, 2009 low. Because (MAS) is in the home improvement and building industry it stands to reason that the stock would fall as much as it did. Not surprisingly, (MAS) cut their dividend which for the New Low Observer teams means sell the stock and watch what develops from the sideline. Adjusted for dividend payments, (MAS) is in the lose column to the tune of –15.41% since the initial recommendation.
The next stock is Illinois Tool Works (ITW) which was a stock that was handled in the most irresponsible manner on our part. After recommending the stock on April 2, 2008 at $50.34, we were able to watch the stock exceed a gain of 9% in less than 2 months but didn’t put in a sell recommendation. Given what we knew about the market conditions at the time, we should have been more vigilant about the movement of this stock. Subsequent to our recommendation of ITW the company’s stock fell by as much as 49.15% at its worst and has discontinued it’s record of dividend increases. Adjusted for dividend payments since the recommendation date, ITW is in the lose column by –2.14%.
American National Insurance (ANAT), one of my favorite insurance companies has had an astounding run since our recommendation. ANAT initially rose 15% after our recommendation which was great. However, we didn’t adhere to our rule of taking exceptional gains in a short period of time. The price to pay for this error was to watch ANAT fall a gut wrenching 67.87% to the low of March 9, 2009. Even more astounding is the rise from the bottom however, we cannot take any credit for the rise that has taken place since. ANAT has discontinued its record of increasing the dividend every year. One claim that can be made is that since our recommendation date, ANAT has risen by 14.97% when adjusted for dividend payments.
Finally, our recommendation of Nucor (NUE) fell by 47.75% at the lowest point on November 20, 2008. NUE later cut the dividend and has an adjusted lose of –2.97% since or initial recommendation.
It should be pointed out that our policy is to make Investment Observations at a time when we think a stock should be investigated as a potential investment opportunity. Our hope is that after the recommendation/observation the stock price will be lower than when we first pointed out the stock. If you review our 2008 Transaction Overview, you will see that we did carry a few of these stocks in our portfolio with varying results. Despite the fact that these companies cut or did not increase their dividend we will continue to follow these stocks as former Dividend Achievers.
-Touc
  • When things are going great, investigate and learn from the worst performing assets

A reader asks:
“Is there some common trait among these 5 that, if known, could be used as a red flag or indicator not to repeat a future sub-optimal purchase?”

Touc’s reply is here.

Water Utilities Look Affordable

As we have indicated in our February 26th posting, “as a sector, the water utilities are the most undervalued in our Dividend Achiever Watch List." After the rumblings in the water utility sector this week with the announced acquisition of Southwest Water Company (SWWC) by Water Asset Management LLC, we have decided to outline the potential price and percentage change that the stocks would go to if they only went to the 10-year average for the respective fundamental valuation metric. However, as has been pointed out by Warren Buffett in his 2009 annual report, “Even evaluations covering as long as a decade can be greatly distorted by foolishly high or low prices at the beginning or end of the measurement period.”
Company
Price Valuation Target % Up
American States Water (AWR) $34.62 P/Earnings $37.27 7.88%
P/Book $36.12 4.55%
P/Sales $38.80 12.30%
P/Cashflow $40.29 16.61%
San Jose Water (SJW) $23.56 P/E $22.28 -4.74%
P/B $27.89 19.25%
P/S $30.94 32.27%
P/C $32.61 39.43%
California Water (CWT) $36.90 P/E $46.02 25.09%
P/B $42.36 15.15%
P/S $40.53 10.16%
P/C $38.61 4.94%
AquaAmerica (WTR) $16.75 P/E $20.93 25.00%
P/B $23.70 41.56%
P/S $23.95 43.05%
P/C $24.76 47.92%
Data Source: Morningstar.com

Again, the target prices are based on the 10-year average for the given valuation metric. Of the water companies above, AquaAmerica (WTR) has the highest average upside potential of 39% for all four valuation categories. Although San Jose Water (SJW) is not currently on our Watch List, but it has the second highest average upside potential of 21%. California Water (CWT) and American States Water (AWR) followed closely behind with an average upside potential of 13% and 10% respectively.

The biggest risk factor for water utilities is interest rates. If, for some reason, there is a spike in interest rates, then all utilities will suffer tremendously. As we are at historical lows in the cycle for interest rates, we can only expect that there is greater risk of rates rising than falling. Even if rates were to fall, there is little to fall from, whereas, there is tremendous upside.Despite our seemingly aggressive investment strategy, we only consider the mean as the best guess of the potential for where these water stocks might go. In addition, we enter into every transaction accepting the possibility that any investment might fall at least 50% as outlined in our article titled “A Simple Way to Avoid Losing Money in Stocks.”-Touc

Email our team here.

Nasdaq 100 Watch List

Below are the Nasdaq 100 companies that are within 20% of the 52-week low. This list is strictly for the purpose of researching whether or not the companies have viable business models or are about to go out of business. These companies are deemed highly speculative unless otherwise noted (view all here.)

Symbol Name Price P/E EPS (ttm) Yield P/B % from Yr Low
FSLR First Solar, Inc. 108.61 14.43 7.527 N/A 3.42 10.04%
ERTS Electronic Arts Inc. 17.12 N/A -2.31 N/A 2.12 15.99%
GILD Gilead Sciences, Inc. 47.61 16.87 2.82 N/A 6.51 17.21%
APOL Apollo Group, Inc. 62.39 15.01 4.16 N/A 6.53 18.19%
QCOM QUALCOMM 38.76 31.11 1.25 1.70% 3.08 18.64%
ATVI Activision Blizzard 11.03 128.26 0.09 1.40% 1.3 19.11%
SRCL Stericycle, Inc. 55.35 27.33 2.03 N/A 5.54 20.43%

Nasdaq 100 Watch List Summary

This week the lowest performing stock was Gilead Sciences (GILD). Gilead Sciences was up 0.02% for the week.

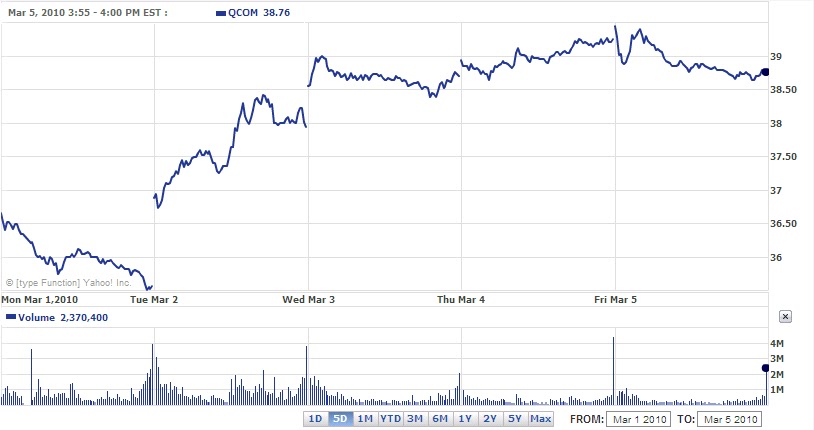
The leading gainer from last week was Qualcomm (QCOM) with a gain of 5.53%. While there are many reasons why QCOM increased so much in one week. Most market analysts attribute the gains to some syndicate operators (aka hedge fund managers or famous investors) or the fact that QCOM, in a desperate attempt to lure new investors, indicated that it would increase the dividend and buy back shares. Our reason for the shares to rise is because they were so underpriced (the value component was too difficult to ignore). It doesn't mean that QCOM can't go lower but our suspicion is that the stock could only fall for a short bit lower from the previous 52-week low. (chart below)

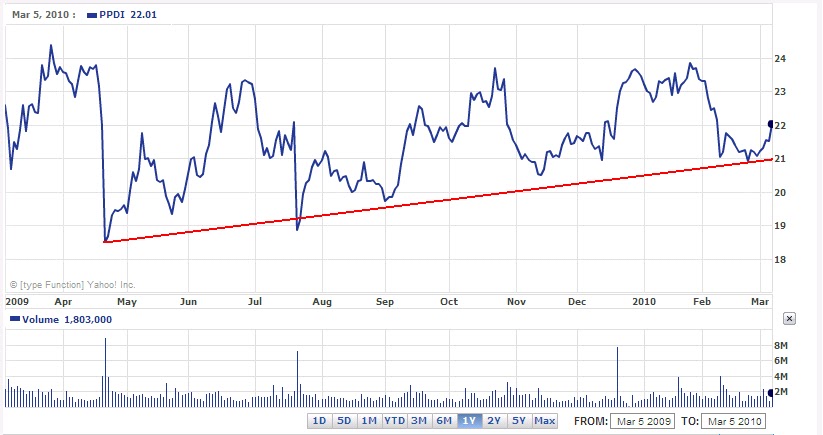
Pharmaceutical Products (PPDI) had the second largest gain for the week with 4.71% to the upside. PPDI is no longer on our watchlist and is tracing out a pattern of higher lows with a resistance to the upside at the $24 level. if PPDI can convincingly break above the $24 level then PPDI might be able to test the $29 level in a relatively short period of time. (chart below)

Apollo Group (APOL) gained 4.02% for the third highest gains for the week. The average gain for the last week for all companies on our Nasdaq 100 watch list was 3.02%. QCOM and APOL seem like the best companies to research for potential investment opportunties at this time.

-Touc

Email our team here.

Dividend Achiever Watch List

At the end of the week, my watch list contains 16 companies. Here is my watch list for March 5, 2010.

Symbol Name Price % Yr Low P/E EPS Div/Shr Yield Payout Ratio
XOM Exxon Mobil Corp. 66.47 7.45% 16.70 3.98 1.68 2.53% 42%
WTR Aqua America, Inc. 16.75 8.84% 21.75 0.77 0.58 3.46% 75%
MON Monsanto Company 72.50 8.91% 26.08 2.78 1.06 1.46% 38%
CWT California Water Service' 36.90 10.18% 18.92 1.95 1.19 3.22% 61%
THFF First Financial Corp. 28.44 12.28% 16.44 1.73 0.90 3.16% 52%
WMT Wal-Mart Stores, Inc. 54.14 14.83% 14.63 3.70 1.09 2.01% 29%
FPL FPL Group, Inc. 47.65 14.87% 12.00 3.97 2.00 4.20% 50%
T AT&T Inc. 24.99 15.59% 11.79 2.12 1.68 6.72% 79%
BRO Brown & Brown, Inc. 17.36 16.12% 15.50 1.12 0.31 1.79% 28%
AWR American States Water 34.62 16.33% 21.37 1.62 1.04 3.00% 64%
SRCE 1st Source Corp. 16.20 17.05% 20.51 0.79 0.60 3.70% 76%
WGL WGL Holdings Inc 33.68 17.80% 14.97 2.25 1.47 4.36% 65%
UGI UGI Corporation 25.04 18.45% 11.33 2.21 0.80 3.19% 36%
NTRS Northern Trust Corp. 54.89 19.90% 17.21 3.19 1.12 2.04% 35%
SHEN Shenandoah Telecom 19.31 19.94% 31.15 0.62 0.32 1.66% 52%
MLM Martin Marietta Materials 82.14 20.79% 42.56 1.93 1.60 1.95% 83%
16 Companies
Watch List Summary 
The best performer from last week's list is 1st Source Corp. (SRCE) which rose 8.5%.
The worst performing stock is Aqua America (WTR) which fell 2.2%. Overall watch list gained 3.8% vs the Dow gain of 2.3% and the S&P 500 gain of 3%. We are at the one year anniversary of the March 2009 low. As a result, companies appearing on this week list may interesting to consider.

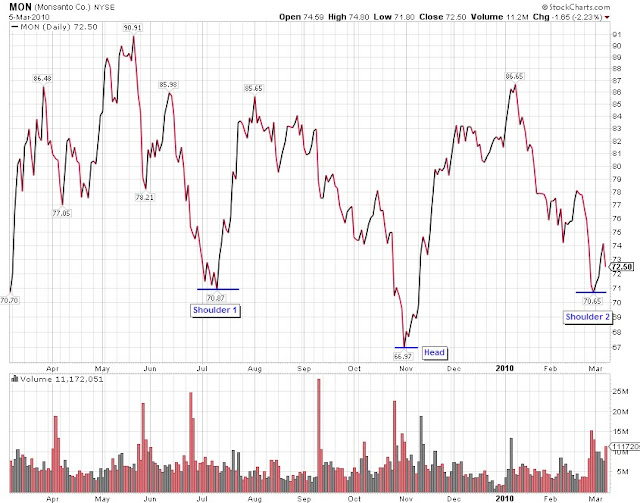
Once again, we'd like to highlight Exxon (XOM) which rose from the March low to December high of $76. This largest market cap company has been within the 10% range for 7 consecutive weeks. Monsanto (MON) is another name we flagged in our Nasdaq 100 watch list last week. A nice head-and-shoulder pattern developed this week when the stock held above the $70 level. The stock rose as high as $74.55 mid-week but gave most of the gain back on Friday.

As a sector, the water utilities still remain the most undervalued in our Dividend Achiever Watch List. A recent acquisition of Southwest Water Company (SWWC) left the sector with one less competitor. We are currently long California Water (CWT). 
- Art 
Email our team here.

Water Utilities on the Move

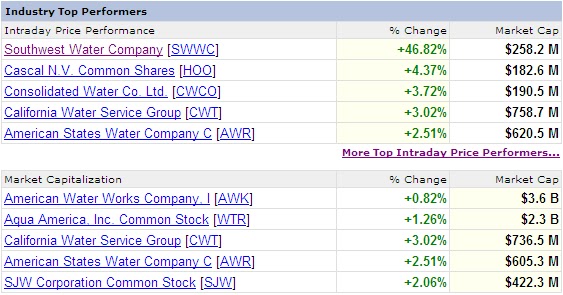
Yesterday, water utilities were on the move because Los Angeles-based, Dividend Achiever Southwest Water Company (SWWC) announced that it was being bought by Water Asset Management, LLC in a deal valued at $427 million. The stock of Southwest Water Company (SWWC) jumped 46% during market hours.  On the news, almost all other water utility companies moved higher as seen in the table below.
It should be noted that of the eight companies listed above, San Jose Water (SJW), American States Water (AWR), California Water Service (CWT), AquaAmerica (WTR), American Water Works (AWK) and Consolidated Water (CWCO) are Dividend Achievers.  In the last month, San Jose Water (SJW), California Water (CWT), AquaAmerica (WTR) and American States Water (AWR) have been on our Dividend Achiever Watch List at the same time.  The New Low Observer had issued Investment Observations on AquaAmerica (WTR) on October 31, 2009 and the other on California Water Service (CWT) on January 3rd.
As a general observation of our Dividend Acheiver Watch List and our Nasdaq 100 Watch List, when companies from an industry start to cluster on the list we know that whatever cyclical forces are at play require us to look closely at that industry and those companies.  Although we have sold our initial investment in AquaAmerica (WTR), we subsequently acquired a "substantial" position in California Water Service (CWT). 
Anyone interested in the qualitative elements of water utilities should be mindful of our boiler plate warning on investments in the industry:
"Although water is critical to life, investors need to understand that companies in this industry aren't a "sure thing." The biggest reason for this is that when, and if, water becomes scarce, municipalities will step in to take over (nationalize) what should otherwise be sold at the most profitable price (thereby curbing wasteful consumption.) There is literally an upside cap on profitability to companies like these due to the critical importance of the resource being sold."
Despite my personal concerns on the water utility industry, I encourage readers to follow our Watch Lists closely for potential signs of other exceptional investment opportunities.
-Touc
Email our team here.

Quote of the Day

U.S. District Judge Jed S. Rakoff said he found it "troubling that backdating stock options and the accounting fraud that it generated were seemingly so widespread in corporate America."

Source:  "Internet job site exec's cooperation earns no jail," Tuesday March 2, 2010.
http://finance.yahoo.com/news/Internet-job-site-execs-apf-3696221220.html?x=0&sec=topStories&pos=2&asset=&ccode=

Email our team here.

Sell Cephalon (CEPH) at the Market

It is now time to recommend that Cephalon (CEPH) be sold at the market. The stock has performed moderately since the Speculative Observation was issued on January 4, 2010. However, CEPH has performed well since our Speculative Observation of August 27th and October 8th of 2009. Since our original Observations, CEPH has provided many opportunities to buy the stock low with the better than even prospect of selling high.
Since our October 8th reiteration of CEPH, the stock has risen 31% to the current market price of $70.78. However, if we go by the last observation on January 4, 2010, CEPH has increased 13.41%. In the pursuit of "seeking fair profits" the returns that CEPH has provided within the last 61 days say that it is necessary to consider alternative opportunities. The key to investment success and a key principle of economics is to seek the best alternatives.
CEPH was re-recommended when it closed at $62.42 on January 4, 2010. As of March 2, 2010, CEPH was quoted at $70.78. Again, CEPH has gained 13.41% since the beginning of the year. The annualized return on this position would be close to 80%. Since it is unlikely that the stock can continue to climb unabated, we feel selling now is a reasonable policy.
Those not interested in following through with our sell recommendation can feel comfortable knowing that CEPH is a great long-term holding with a 13.41% downside cushion since our last investment observation. As the price of CEPH rises, it should be noted that the stock faces significant upside resistance at $70 and $80. We are going to continue watching this company to determine if the stock will meet our prior 3 month targets based on the Coppock Curve and other technical indicators.
As we have indicated in the purposes and function of this site, our goal is to:
  • maximize the annual yield of each trade.
  • reduce time between buying and selling of each stock.
  • exceed the annual yield of government guaranteed alternatives in each trade.
Investment observations are intended to be a starting point for investigating a quality company at a reasonable price. It is hoped that after doing the background research you can buy the stock at a lower price. Ideally the stock should be held in a tax deferred account and should not consist of less than 20% of your holdings. Personally, we prefer holding only 2-3 stocks at a time.
Sell recommendations are intended to deal with the short term reality of the market. The tracking of the Sell recommendations are the worst case scenario if you happen to have bought a stock at the time the Speculative Observation was made (please avoid making this mistake.) We aim for mediocrity in our returns, therefore we are happy with 9-12% annual gains. However, since codifying this approach to investing in 2005, we have had annual returns of 20% and above every year since.
It is always recommended that when selling a stock, one should not place stop orders, limit orders or orders after hours. This leaves the seller in the position of being vulnerable to the whims of the market makers. Instead, place your sell orders only as a market order during market hours. Some would complain that a market order during market hours might leave some profits on the table. However, we would rather leave some money on the table rather than have it taken away from us by the trades that are placed by institutions and market makers.
-Touc

Dividend Yield is a Matter of Perspective

A reader asks:

How is it that you can characterize stocks that yield less than 2% as "dividend" stocks?

Touc's reply:

The purpose of tracking the stocks in our Dividend Achiever Watch List is because the companies have a history of increasing their dividend every year for at least 10 years in a row. The choice of selecting a Dividend Achiever based on the yield becomes up to the investor.

However, as a matter of observation, selecting stocks based solely on the "high" yield has seldom resulted in long-term financial security. In addition, my "research" has shown that stocks with a low dividend yield but a higher average annual compound growth of the dividend tend to outperform stocks with a "high" dividend yield but a low compounded annual growth rate of the dividend. For this reason, I'm willing to look more closely at the compounded annual growth rate of the dividend for lower yielding stocks. Again, this is among the many factors that go into selecting any one of the stocks on our New Low Watch List.

Another factor that we consider when selecting Dividend Achievers is the relative yield of the stock. If a stock has a history of dividend payment increases over an extended period of time then we can determine the relative buy and sell points. Buying and selling stocks based on the relative yield is explained in the books Relative Dividend Yield by Anthony Spare, Dividends Don't Lie by Geraldine Weiss and Dividends Still Don't Lie by Kelley Wright. An excellent February 20, 2010 interview of Kelley Wright's most recent book can be found on the Financial Sense website here.

One example of a low yielding stock is Helmerich & Payne (HP). We recommended the stock on Sept. 2006 because, on a relative basis, the stock was under-priced. Subsequently, we gave a sell recommendation after the stock had gained 141% in August 2008. We later recommend HP when, on a relative basis, it was attractively priced in March 2009. Since March 2009, the stock has increased over 80% to the current price of $40.52. The point is that, on an absolute basis, the yield on HP never reached 1.50% when the stock was at its lowest price (high price = low yield/low price = high yield.) However, on a relative basis, the yield was very high for the stock.

It is far more important to focus on the history of dividend increases rather than the yield. Once you’ve narrowed down the quality stocks based on dividend increases then it is suggested that you compare the current dividend yield to the historical range for the stock in question. At least, this is the way the New Low Observer team likes to look at dividend paying stocks, regardless of the yield.

-Touc

Nasdaq 100 Watch List

Below are the Nasdaq 100 companies that are within 20% of the 52-week low. This list is strictly for the purpose of researching whether or not the companies have viable business models or are about to go out of business. These companies are deemed highly speculative unless otherwise noted (view all here.)
Symbol Name Trade P/E EPS (ttm) Yield P/B Pct from Yr Low
First Solar
105.56
14.02
7.53
N/A
3.26
6.94%
Electronic Arts
16.58
N/A
-2.31
N/A
2.08
12.41%
QUALCOMM
36.7293
29.48
1.246
1.80%
2.91
12.53%
Apollo Grp
59.98
14.43
4.16
N/A
6.37
13.62%
Activision
10.645
123.78
0.086
1.40%
1.26
14.96%
Pharm. Prod.
21.02
15.67
1.34
2.80%
1.87
16.97%
Gilead
47.60
16.87
2.82
N/A
6.56
17.18%
Stericycle
55.28
27.30
2.03
N/A
5.60
20.28%
Watch List Summary

Over the last week, First Solar (FSLR) and Qualcomm (QCOM) had the worst performance. First Solar (FSLR) fell nearly 14% intra-week by Thursday but managed to recover losing only 7% for the week. Qualcomm (QCOM), on the other hand, fell consistently throughout the week and closed at the low for the week. As I ran my stock screeners, looking for quality dividend achieving stocks, Qualcomm (QCOM) kept coming up with the highest return on equity (ROE), return on assets (ROA) and lowest debt. The odd thing is that QCOM isn't even a Dividend Achiever. From a qualitative standpoint, QCOM seems to come up as a solid company with a "wide moat" according to Morningstar. If I were to invest in any stocks at this time Qualcomm (QCOM) and Monsanto (MON) are at the top of my list.

As if to awaken from the dead, Apollo Group (APOL) was the leading gainer for the week by rising slightly above 4%. Apollo Group (APOL) was the leader among stocks that were on the Nasdaq 100 Watch List from the previous week. Provided the stock market can hold up, Apollo Group (APOL) might have a chance at a temporary rebound in the price after having been at the low for so long. Also able to scratch out a gain this week was Stericycle (SRCL) which was up over 1.5%.
Again, Qualcomm (QCOM) and (MON) are my two favorite stocks to start some research on and possibly acquire despite the coming stock market and global economic collapse that is forecasted because of the Spain/Greece/England/Euro implosion. Also, don't forget the U.S. debt and dollar crisis to come. With all of these calamities on the horizon, I would highly recommend factoring in, at least, a 50% lose on any new investments from the current level (a strategy explained in our article "A Simple Way to Avoid Losing Money in Stocks".)
-Touc

Dividend Achiever Watch List

At the end of the week, my watch list contains 21 companies. Here is my watch list for February 26, 2010.

Symbol Name Price % Yr Low P/E EPS Div/Shr Yield Payout Ratio
THFF First Financial Corp. 26.28 3.75% 15.19 1.73 0.90 3.42% 52%
XOM Exxon Mobil Corp. 65.00 5.08% 16.34 3.98 1.68 2.58% 42%
MON Monsanto Company 70.65 6.13% 25.41 2.78 1.06 1.50% 38%
CWT California Water Service 35.88 7.14% 17.94 2.00 1.19 3.32% 60%
SRCE 1st Source Corp. 14.93 7.88% 18.90 0.79 0.60 4.02% 76%
AWR American States Water Co. 32.16 8.06% 19.85 1.62 1.04 3.23% 64%
WTR Aqua America, Inc. 17.12 11.24% 22.53 0.76 0.58 3.39% 76%
FPL FPL Group, Inc. 46.37 11.79% 11.68 3.97 2.00 4.31% 50%
TMP Tompkins Financial Corp. 35.86 11.89% 13.33 2.69 1.36 3.79% 51%
SHEN Shenandoah Telecom 18.03 11.99% 29.08 0.62 0.32 1.77% 52%
BRO Brown & Brown, Inc. 16.78 12.24% 14.98 1.12 0.31 1.85% 28%
UMBF UMB Financial Corporation 38.31 13.85% 17.41 2.20 0.74 1.93% 34%
WEYS Weyco Group, Inc. 23.02 14.30% 23.02 1.00 0.60 2.61% 60%
WGL WGL Holdings Inc 32.85 14.90% 14.60 2.25 1.47 4.47% 65%
WMT Wal-Mart Stores, Inc. 54.07 15.04% 14.61 3.70 1.09 2.02% 29%
T AT&T Inc. 24.81 15.72% 11.70 2.12 1.68 6.77% 79%
NTRS Northern Trust Corp. 53.29 16.40% 16.71 3.19 1.12 2.10% 35%
NWN Northwest Natural Gas Co. 43.99 16.65% 15.22 2.89 1.66 3.77% 57%
RBCAA Republic Bancorp, Inc. 16.87 17.40% 8.35 2.02 0.53 3.14% 26%
UGI UGI Corporation 25.05 18.50% 11.33 2.21 0.80 3.19% 36%
SYBT S.Y. Bancorp, Inc. 21.95 20.01% 15.79 1.39 0.68 3.10% 49%
21 Companies


Watch List Summary

The best performer from last week's list is Weyco (WEYS) which rose 3.7%.

The worst performing stock is Monsanto (MON) which fell 9.1%. We are considering Monsanto as a possible investment. After some diligent research, out team was able to uncover the fact that MON had increased the dividend every year since 1967. In 1999, Pharmacia & Upjohn bought MON which technically discontinued the dividend increases. However, in 2000 Pharmicia spun-off MON which allowed MON to start their dividend increases in 2001.

One company that had been of particular interest was Northern Trust (NTRS). As the stock approached getting within 10% of the low, we ramped up our research of the company. In fact, just before our research was being completed the stock price jumped from $50 to $54 in a matter days. A primary rule of thumb when investing is to never chase a rising stock price. At $53.29, we can only watch from the sidelines. NTRS is a top notch financial institution which would end up being the subject of a bidding war or an acquirer of a substantially undervalued asset.

Overall performance of last week's list is a gain of 1.5%. Exxon Mobil (XOM), the largest company by market cap, has been within the 10% range for 6 consecutive weeks. As a sector, the water utilities are the most undervalued in our Dividend Achiever Watch List. A cursory examination and some patience will prove to be fruitful.

- Art


Something to Ponder About Investing: Case Study of H&R Block (HRB)

We at New Low Observer are constantly challenging our own method of investing. We often ask "how is it possible that a great stock like that can be down/up that big?" To answer that question, we looked at what could be a potential explanation and we turned to our trade on H&R Block (HRB).

Buy Recommendation from the "Pro" in 2008
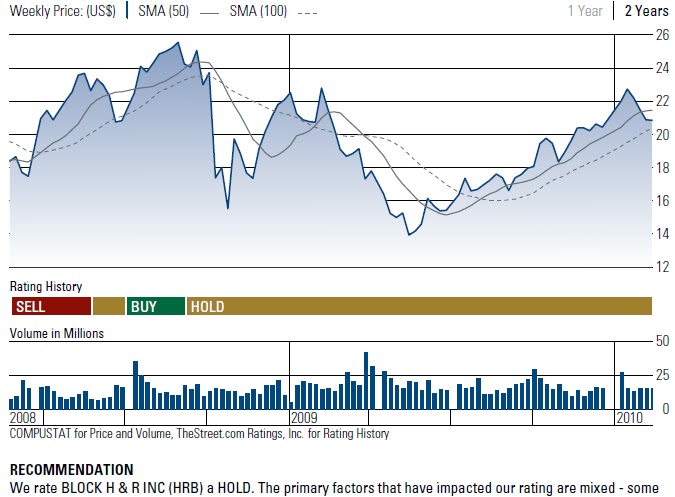
The chart below shows a buy recommendation from TheStreet.com. They upgraded HRB from hold to buy on July 1, 2008 at $21.08. Then TheStreet told investors to hold it on September 5, 2008 at $24.24. At the current price, it would take a 40% rise (from $17.20 to $24.24) to break-even.
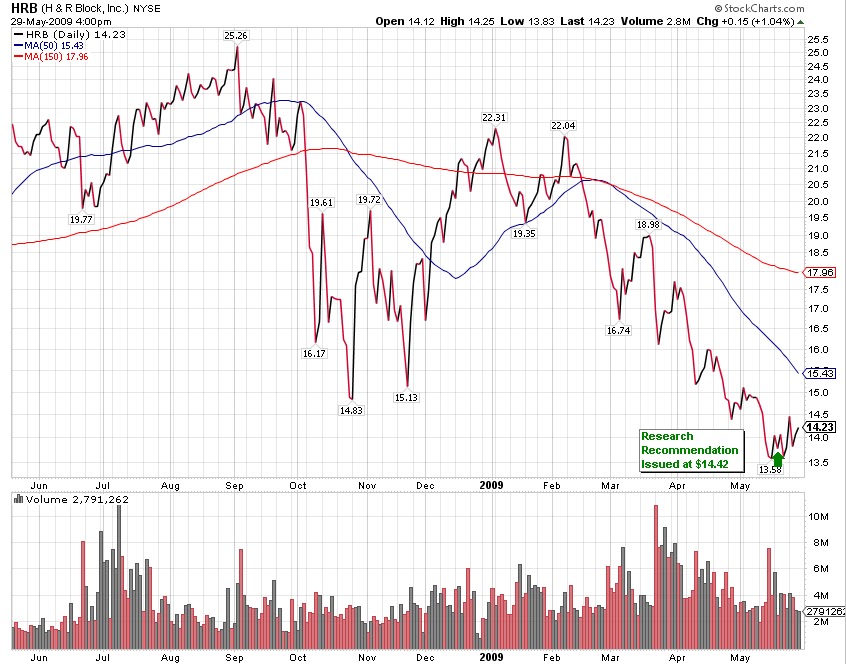
We began our coverage of HRB on May 19, 2009 when the stock was trading at $14.42 or 5% within the 52-week low of $13.73. Please see chart below.
Our article was published on Seeking Alpha which received less than welcomed comments. One reader stated:
"HRB's core business is doing tax preparation. People are moving to doing it via a computer. They are losing core business and been doing so for years. You sure you want to invest in a company losing its core?"
The other came from a former employee. He provided us with great insights:
"As a former employee, I can tell you that this ship has sailed. Every article you read that talks about an upside merely mentions shedding the toxic business, (Business that by the way doubled the profits for a number of years), but fails to mention the drop in repeat clients. If this any other retailer, the first thing you would look at is same store sales YOY and ignore entities that they no longer own. Same store sales are dismal and this year were down close to double digits. This year when they could have been the client's champian with wallets tight, they raised the average fee by nearly 9%. The 5.6% drop in clients includes a 10% increase in digital clients where the profit margin is razor thin.

Every year it is a push to pick up new clients and that is harder than ever. The clients they need to pick up are the thirty-somethings who grew up in the computer age and are very comfortable with a software solution. Good luck because they are also reluctant to pay $300.00 to have their taxes prepared by someone that they are not convinced is smarter than they are.

If you own it, hold it until Breedan sells the company and if you don't, don't."
Based on these comments, one might have considered HRB to be doomed. The stock had nowhere to go but down. But wait...
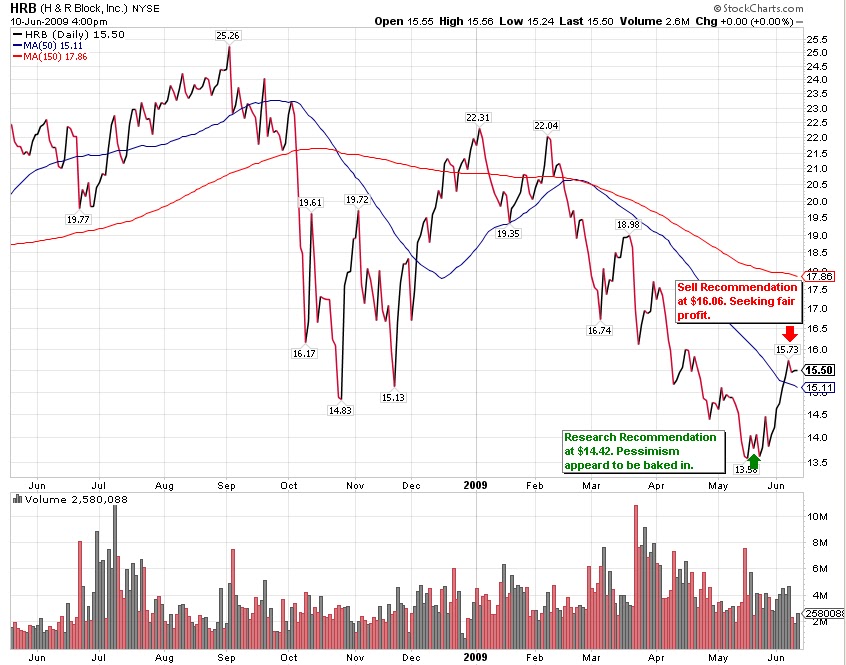
To our surprise, in just 17 days, HRB rose a little over 10% by June 5, 2009. We didn't expect to garner such a large profit in such a short period of time. Because our goal is "seeking fair profits" we had to recommend selling the shares.
Investors should be asking, how can HRB rise 10% during a period with no news and such a negative outlook based on comments above. Ironically, the company came through in Q4 beating the street on June 30, 2009.
The Current Situation
On February 24, 2010, H&R Block (HRB) reported their earnings which sank the stock price by more than 10%. How can this be when a great article was written on HRB on November 3, 2009? HRB shares should be approaching $40, not falling back below $20.
A Key Take Away
The key point here is not to say we are right or others are wrong. We simply felt that it was more luck than anything else that our article was published at or near the stocks' low. But remember our approach starts from the New Low Watch List which could explain a little about our "timing."
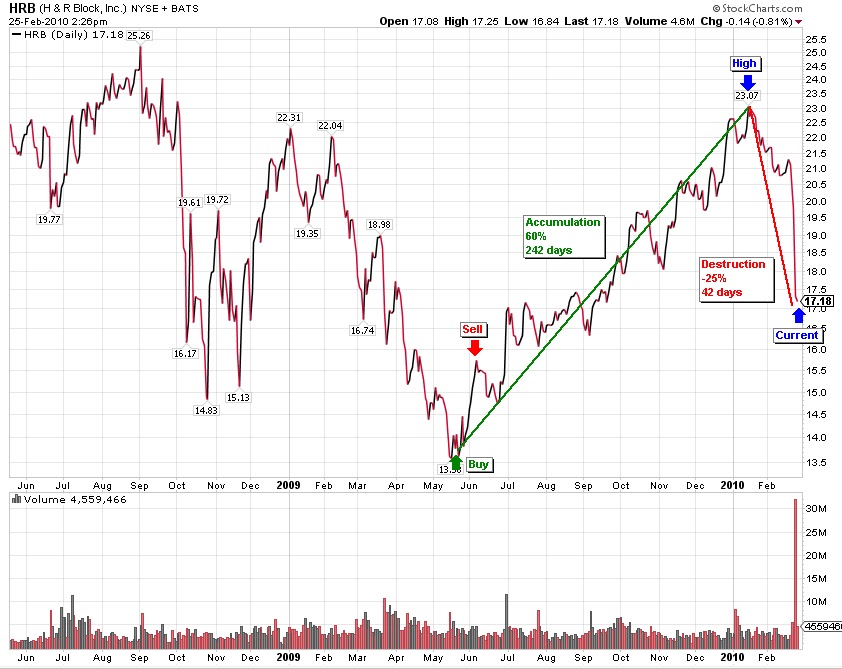
I have annotated the chart below to demonstrate what happened after our initial research recommendation of H&R Block (HRB). It's true that many people said we issued a sell recommendation too soon and missed out on the big upside (60%.) But one does not know that until after the fact. It took 242 days or nearly 8 months to accumulate a gain of 60%. But it only took 42 days or little over one month to wipe out half of that gain.
The current price of $17.20 is still above our sell recommendation. However, investors who are unwilling to accept the reality of gains (selling at higher prices) have to live with the reality of less gains or even losses. We are willing to accept any gain even if it is 16% of the 60% rise.
Going back to our initial question, how is it possible that a great stock like H&R Block (HRB) can be down/up so much? To which we answer, "we don't know." One person cannot justify the price rise or fall. Investors should be focused on the risk/reward of an investment opportunity rather than the reasons why. Of course, we only ignore the reason why with companies that have a proven track record of dividend increases.
During May 2009, the news and outlook for HRB was at its bleakest. However, bad news wouldn't likely move the stock down much further. But a glimmer of hope will shoot the stock up. The opposite occurred in early 2010. All the good news was baked in already. Any good news would no longer boost the price much higher, but a slight change in sentiment will crater the stock.
- Art

Sell Cardinal Health (CAH) at the Market

Since our write-up on Cardinal Health (CAH) on September 29, 2009 the stock has appreciated 23%. Purchasing the stock on 9/30/09 for $26.80 and selling it on 2/23/10 for $33 would yield an annualized return of 57%. This exclude two dividend payments.

Let's review the numbers. The table below shows the previous article's fundamentals compared to today's figures.

Date P/B F P/E P/CF Yield
9/29/2009 1.11 12.00 6.00 2.60%
2/23/2010 2.33 13.81 8.70 2.10%

As you can see, the valuation improved quite a bit given that nothing substantially materialized other than the company raising the profit outlook. Looking at the figures above, you can see that the price-to-book (P/B) ratio has more than doubled. This occurred because of the 2nd quarter results. Because of the recent changes, CAH is no longer the bargain we saw back in September 2009 when it was trading as if they didn't have any intangible assets. Remember, I stated that "given that all CAH competitors (ABC, MCK, and OMI) are trading at more than 2.3x book value, CAH is deeply discounted at 1.1." Now that CAH appears to be fully valued, I have to urge investors to search for safer alternatives.
A 23% profit may not seem like much, however it is a big accomplishment given the stock was held for nearly 5 months. Remember, we are only interested in "seeking fair profits". We at New Low Observer, feel that the risk/reward is no longer in our favor and we would rather take 23% in 147 days.
Investment Observations are intended to be a starting point for investigating a quality company at a reasonable price. It is hoped that after doing the background research, you can buy the stock at a lower price. Ideally the stock should be held in a tax deferred account and should not consist of less than 20% of your holdings. Personally, we prefer holding only 2-3 stocks at a time.

Sell recommendations are intended to deal with the short term reality of the market. The tracking of the Sell recommendations are the worst case scenario if you happen to have bought a stock at the time the Investment Observation was made (please avoid making this mistake.) We aim for mediocrity in our returns, therefore we are happy with 9-12% annual gains. However, since codifying this approach to investing in 2005, we have had annual returns of 20% and above every year since.

It is always recommended that when selling a stock, one should not place stop orders, limit orders or orders after hours. This leaves the seller in the position of being vulnerable to the whims of the market makers. Instead, place your sell orders only as a market order during market hours. Some would complain that a market order during market hours might leave some profits on the table. However, we would rather leave some money on the table rather than have it taken away from us by the trades that are placed by institutions and market makers.

- Art