Today it was announced that H&R Block (HRB) was a potential buyout candidate by Liberty Tax Service. On the news, HRB stock jumped 4.50% on trading volume that was 2½ times the 3-month average.
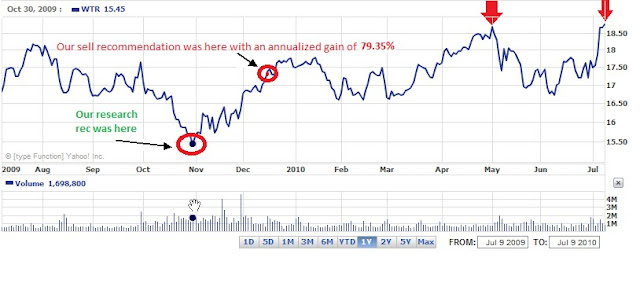
In our opinion, it is no coincidence that the buyout offer, or talk of a buyout, from Liberty Tax Service would come in at or near the exact price that we initiated our research recommendation almost a year ago. Most recently, HRB has been on our Dividend Achiever Watch List since May 21, 2010. However, in a SeekingAlpha.com article on May 19, 2009, we suggested that HRB was an ideal research candidate at a price of $13.73.
Our observation has been that although we recommended selling (HRB) literally days after our initial recommendation, thereby missing the nearly 45% increase in the stock price, if we had held the stock as “long-term” investors we’d have little reason to celebrate at an announced buyout. However, our policy of “seeking fair profits” at the risk of potential tax consequences especially for non-deferred accounts is a sound policy when properly implemented.
An important point about our watch list is that companies may not be undervalued. However, we know for a fact that they are not overpriced. Some have accused the NLO team of “bottom fishing” rather than doing “real” analysis of stocks. However, our applied research and practical experience has demonstrated that when you choose to use fundamental analysis is almost as important as the stocks you us it on.
As we’ve duly noted, all the fundamental analysis in the world will do no good when a stock has reached a new high. In fact, using fundamental analysis to justify a stock purchase that has reached a new high or even in a rising trend undermines the credibility of fundamental analysis. In effect, the numbers begin to lie regardless of the question that is asked.
Based on the use of fundamental analysis, when a stock is rising, if the stock goes up in price then the buyer is convinced that their analysis was accurate. If the price falls then the buyer has to justify the reason why the stock should continue to be held typically on a basis that was may have been flawed from the beginning. If the stock falls out of proportion to all expectation then the buyer of the stock is left with the feeling that investing in stocks must be gambling and those who pursue this effort are fools. There are few valuable lessons to be learned when attempting to apply fundamental analysis to stocks in a rising trend.
Applying fundamental analysis to stocks when they’ve reached a new low however, will quickly tell the investor/analyst whether they are wrong or right in their analysis. Not only can the soundness of the analysis be determined very quickly, you can also determine exactly where the analysis is flawed. All theory about the soundness of fundamental analysis becomes “obvious” to anyone who is willing to observe. For us it also doesn’t hurt that we expect, and look forward to, any recommendation or purchase to fall at least 50% as pointed out by Warren Buffet’s right hand man Charlie Munger.
If the deal for H&R Block never goes through, we know that the company is under priced at the current level. It should be noted that our recommendation of HRB last year just happened to be at the lowest point since May 2001. In addition, our meager 11.50% gain in 18 days surpasses the absence of gains (saved for the annual dividend) since our May 19, 2009 recommendation.
We think H&B Block is at fair valuation when it sells for $18.34. HRB would need to rise by 25% in order to reach fair valuation from today's closing price of $14.61. Any price above $18.34 would be considered a premium in our view.