Below are the valuation targets for Dentsply Sirona (XRAY) for the next 10 years. Continue reading
-
Topics
Archives
-
-
Recent Posts
-
-
-
-

Below are the valuation targets for Dentsply Sirona (XRAY) for the next 10 years. Continue reading
Review
On February 6, 2017, we took a position in Dentsply Sirona (XRAY). Dentsply Sirona is a leading manufacturer of dental products provided to dentists throughout the world. By February 8, 2018, we said the following of XRAY:
“At the time of the purchase of XRAY on February 6, 2017, we sold our shares of UNM Group (UNM) which had increased exceptionally from the February 5, 2016 purchase. XRAY did not meet our goal [gaining +1.14%] and while UNM has gained +5.19% in the same period of time.”
On February 8, 2018, we sold our holdings of XRAY and the stock has subsequently declined –31.30%, a staggering loss in such a short period of time.
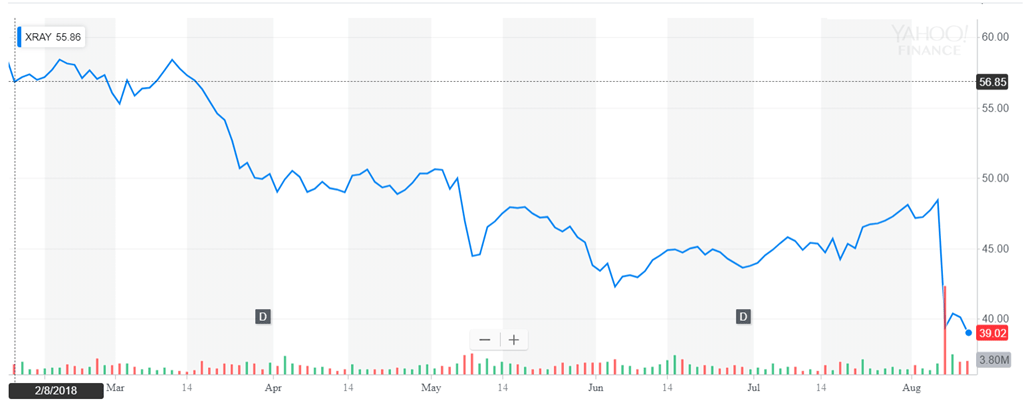
Downside Targets
According to Charles H. Dow, co-founder of the Wall Street Journal, a stock should be viewed from the context of when it last performed the worst. Dow has the following to say (emphasis ours):
"The point of importance for those who deal in industrial stocks is whether the capitalization of the companies into which they propose to buy is moderate or excessive, when compared with the aggregate earnings of the various concerns forming the combination in a period of depression. It is probable that consolidated companies will be able to earn as much in the next period of low prices as the companies forming the combine were able to earn in the last one; hence the very foundation of investments in industrials should be knowledge of what these companies earned, say in 1893 to 1896, making, perhaps, reasonable allowances for economies under consolidation. Where the earnings so shown would have provided dividends for industrials now active, the fact must be regarded as a very strong point in favor of those stocks (George W. Bishop Jr., Charles H. Dow: Economist, Dow-Jones & Company,Princeton, 1967, page 11.)"
Without seeing the reported earnings, dividends, debt and shares outstanding, the price of the stock is the best quick take on the downside risk. In theory, the price reflects some or all of the news and fundamental data on a given stock. Looking at the price and applying the work of Edson Gould, we have estimates for the downside target.
Below are the Nasdaq 100 companies that are within 10% of the 52-week low. This list is strictly for the purpose of researching whether or not the companies have viable business models. These companies are deemed highly speculative unless otherwise noted.
| Sym. | Name | Price | P/E | EPS | Yield | P/B | % to Low |
| GILD | Gilead Sciences | $31.94 | 10.24 | $3.12 | 0.00% | 4.29 | 0.35% |
| NVDA | NVIDIA | $10.05 | 20.85 | $0.48 | 0.00% | 2.14 | 1.52% |
| XRAY | DENTSPLY | $29.25 | 15.99 | $1.83 | 0.70% | 2.46 | 1.77% |
| FISV | Fiserv, Inc. | $45.60 | 14.29 | $3.19 | 0.00% | 2.31 | 1.79% |
| SPLS | Staples, Inc. | $19.31 | 17.86 | $1.08 | 1.80% | 2.18 | 2.60% |
| PAYX | Paychex, Inc. | $25.67 | 19.46 | $1.32 | 4.70% | 6.83 | 3.13% |
| AMGN | Amgen Inc. | $52.17 | 11.07 | $4.71 | 0.00% | 2.29 | 3.68% |
| VRTX | Vertex Pharma. | $32.47 | 0 | -$3.50 | 0.00% | 6.89 | 3.90% |
| ERTS | Electronic Arts Inc. | $14.79 | 0 | -$2.08 | 0.00% | 1.87 | 5.19% |
| ADBE | Adobe Systems | $27.39 | 38.47 | $0.71 | 0.00% | 2.86 | 5.31% |
| FWLT | Foster Wheeler | $21.52 | 7.85 | $2.74 | 0.00% | 3.28 | 5.85% |
| AMAT | Applied Materials | $12.19 | 38.09 | $0.32 | 2.20% | 2.29 | 6.18% |
| HOLX | Hologic, Inc. | $14.12 | 25.67 | $0.55 | 0.00% | 1.35 | 6.49% |
| CA | CA Inc. | $19.00 | 12.9 | $1.47 | 0.80% | 1.99 | 6.74% |
| SHLD | Sears Holding | $63.23 | 32.69 | $1.93 | 0.00% | 0.87 | 6.79% |
| SYMC | Symantec | $14.59 | 16.73 | $0.87 | 0.00% | 2.62 | 7.44% |
| YHOO | Yahoo! Inc. | $14.90 | 26.75 | $0.56 | 0.00% | 1.67 | 8.36% |
| GOOG | Google Inc. | $459.61 | 20.92 | $21.97 | 0.00% | 4.11 | 8.53% |
| LOGI | Logitech Intl | $14.33 | 0 | $0.00 | 0.00% | 0 | 8.81% |
| MSFT | Microsoft | $24.89 | 12.9 | $1.93 | 2.00% | 4.89 | 9.50% |
| KLAC | KLA-Tencor | $29.23 | 68.45 | $0.43 | 2.00% | 2.34 | 9.52% |
| EBAY | eBay Inc. | $20.09 | 10.87 | $1.85 | 0.00% | 1.95 | 9.72% |
| APOL | Apollo Group | $45.57 | 11.68 | $3.90 | 0.00% | 4.77 | 9.94% |
Watch List Notes
“The recent non-confirmation by the Transports may have served as an entry spot for bold speculators, but I doubt if the 2007 highs in the Averages will be approached or bettered. Nevertheless, we may see a brief period of better markets, a "breather" in the long life of the bear. I believe this primary bear market will extend into 2016.
A near-term marker or target is to see whether the Dow and the Transports can better their recent June highs. Those highs were 10450.64 for Industrials and 4467.25 for Transports. Write those figures down. I'm betting that the two D-J Averages will not be able to better the June highs. Let's wait and see.”
All I can say is, at least he indicated an upside target that matches the one we came up with yesterday. Can't understand how he was so bullish on Friday and is now sounding so skeptical today.